Time techno update.
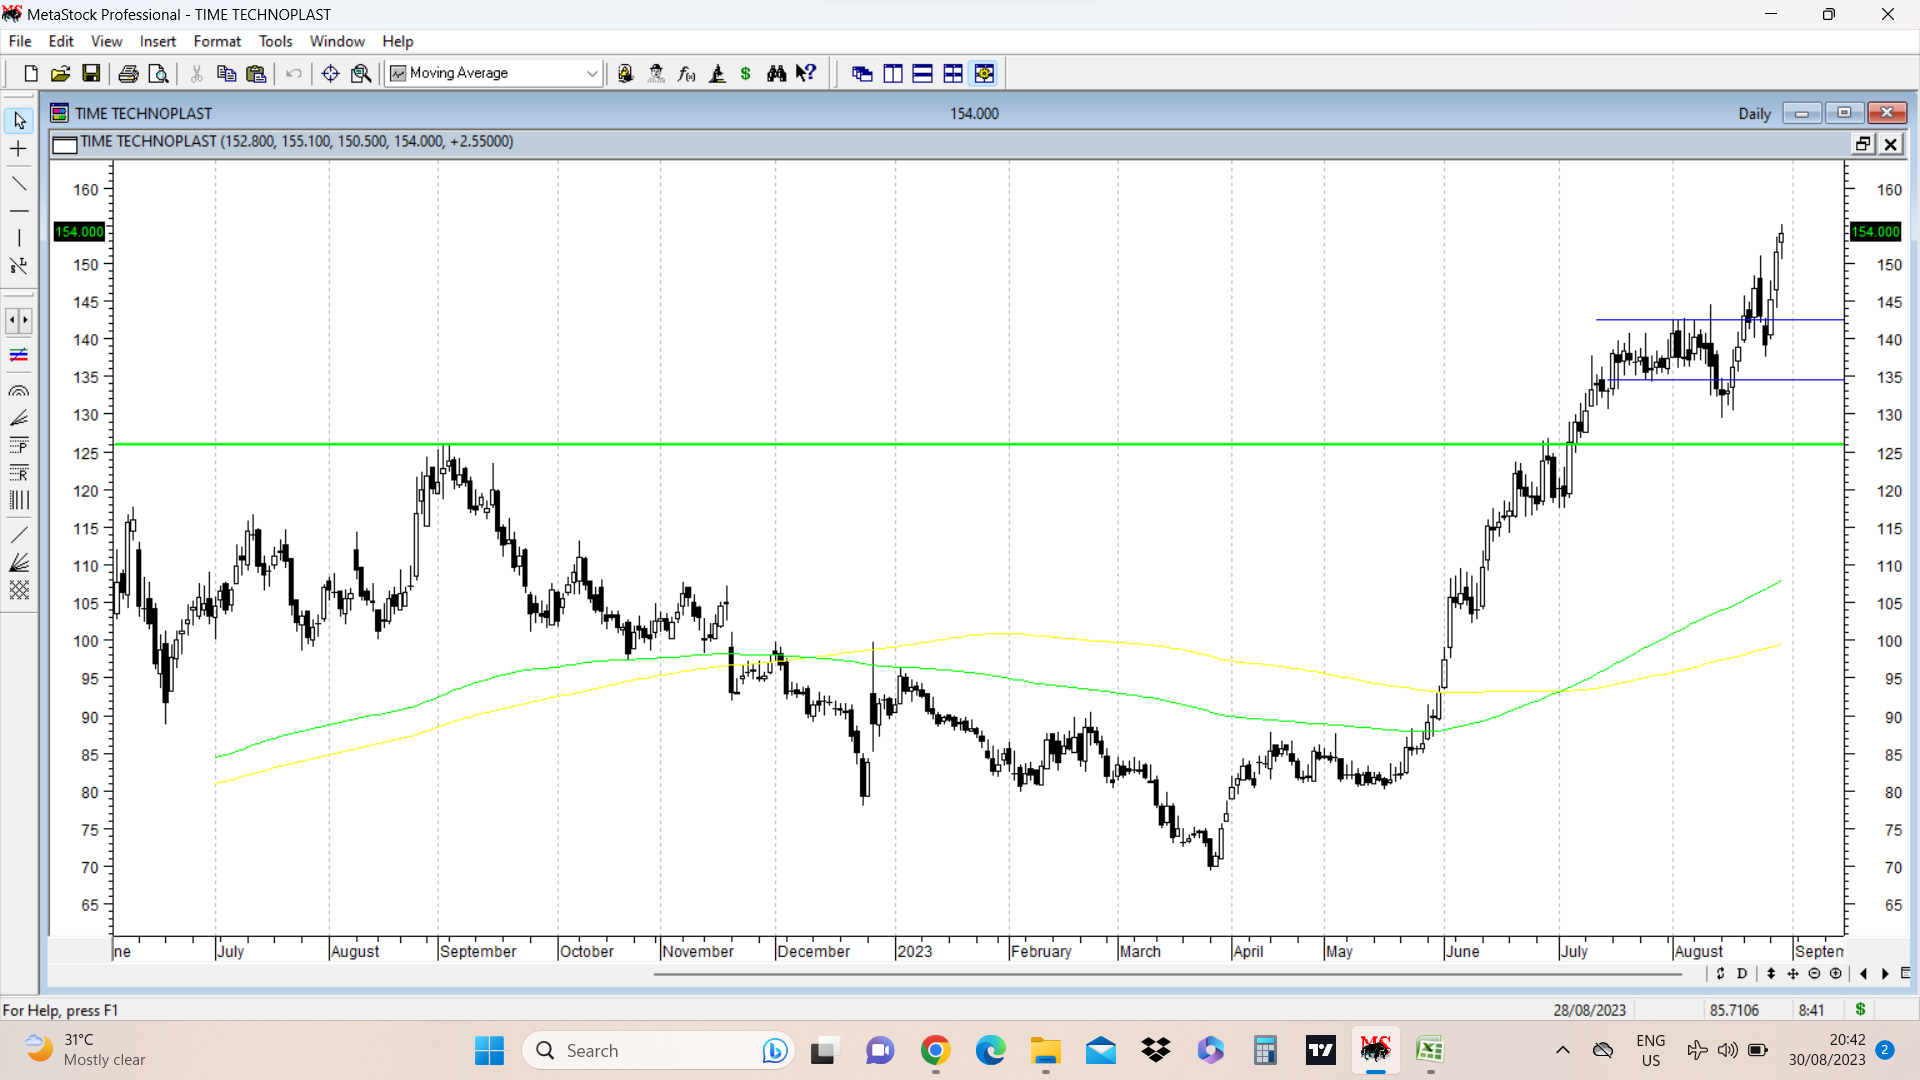
As mentioned in above post, resistance of 140-144 was taken out with a weekly bull candle. But on daily charts, there was a little bit of drama playing out. As shown in the daily candlestick chart, stock price was range bound between levels of 134 on downside and 142-144 on upside. There was a false breakdown and stock price hit a swing low of 129.50 before reversing and getting back into the channel. It then started an upmove, went out above the resistance and hit a swing high of 151, and then was promptly followed by two bearish dark candles and the retest of the breakout zone of 142-144 went down to a low of 138 and then it turned up again and there have been three bullish daily candles with today’s closing at 154, well above the resistance zone.
The weekly candlestick chart provides a much more clearer picture and there, this week is a major breakout week in terms of candlesticks. We still need to see how it closes this week. ( will update once we get a weekly close)
The all important nearly 5 year high level is marked in green solid line at 125.
disc: invested.