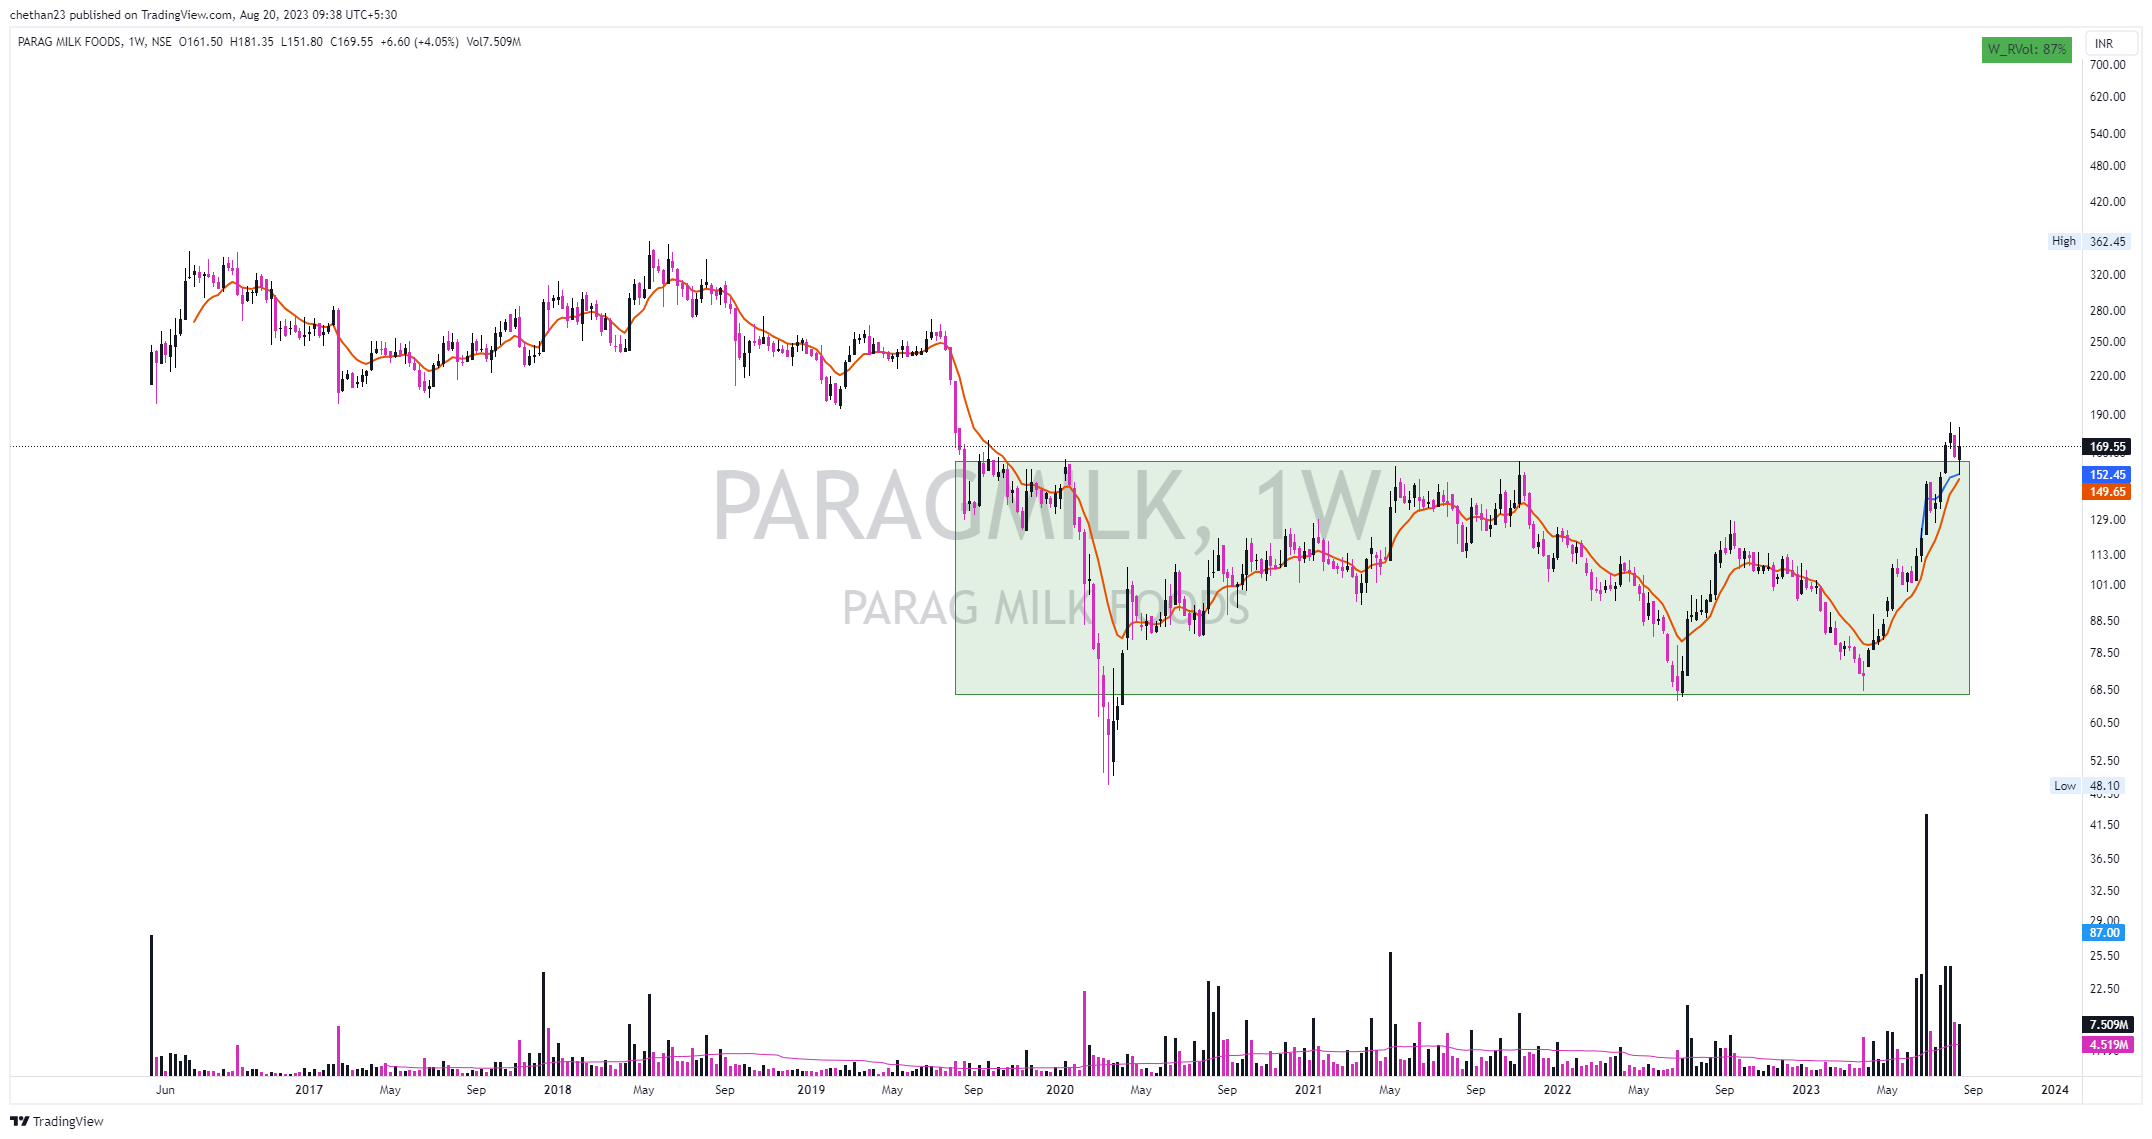
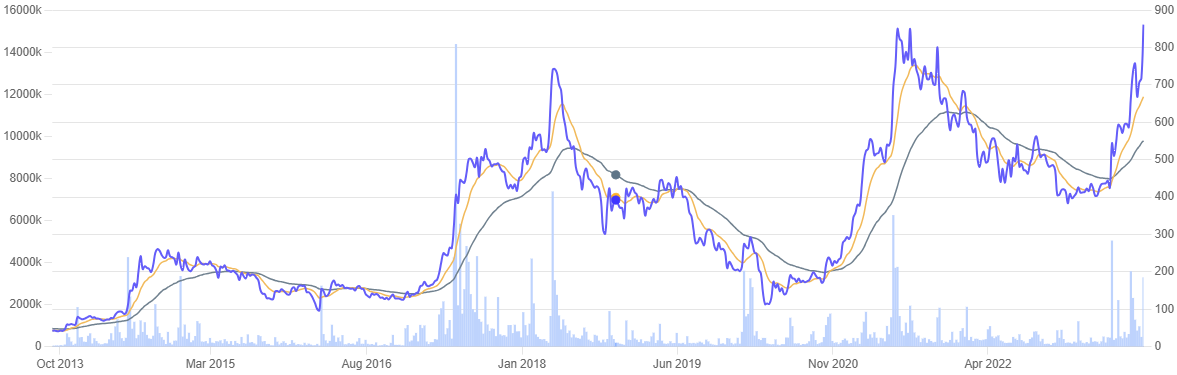
Parag Milk long consolidation of about 4 years, price kind of broke out the stage and then retraced and almost took support from 10 WMA, which is a good sign. also recent few weeks volume build up can be seen, also dairy sector overall seems show some traction
6 Likes
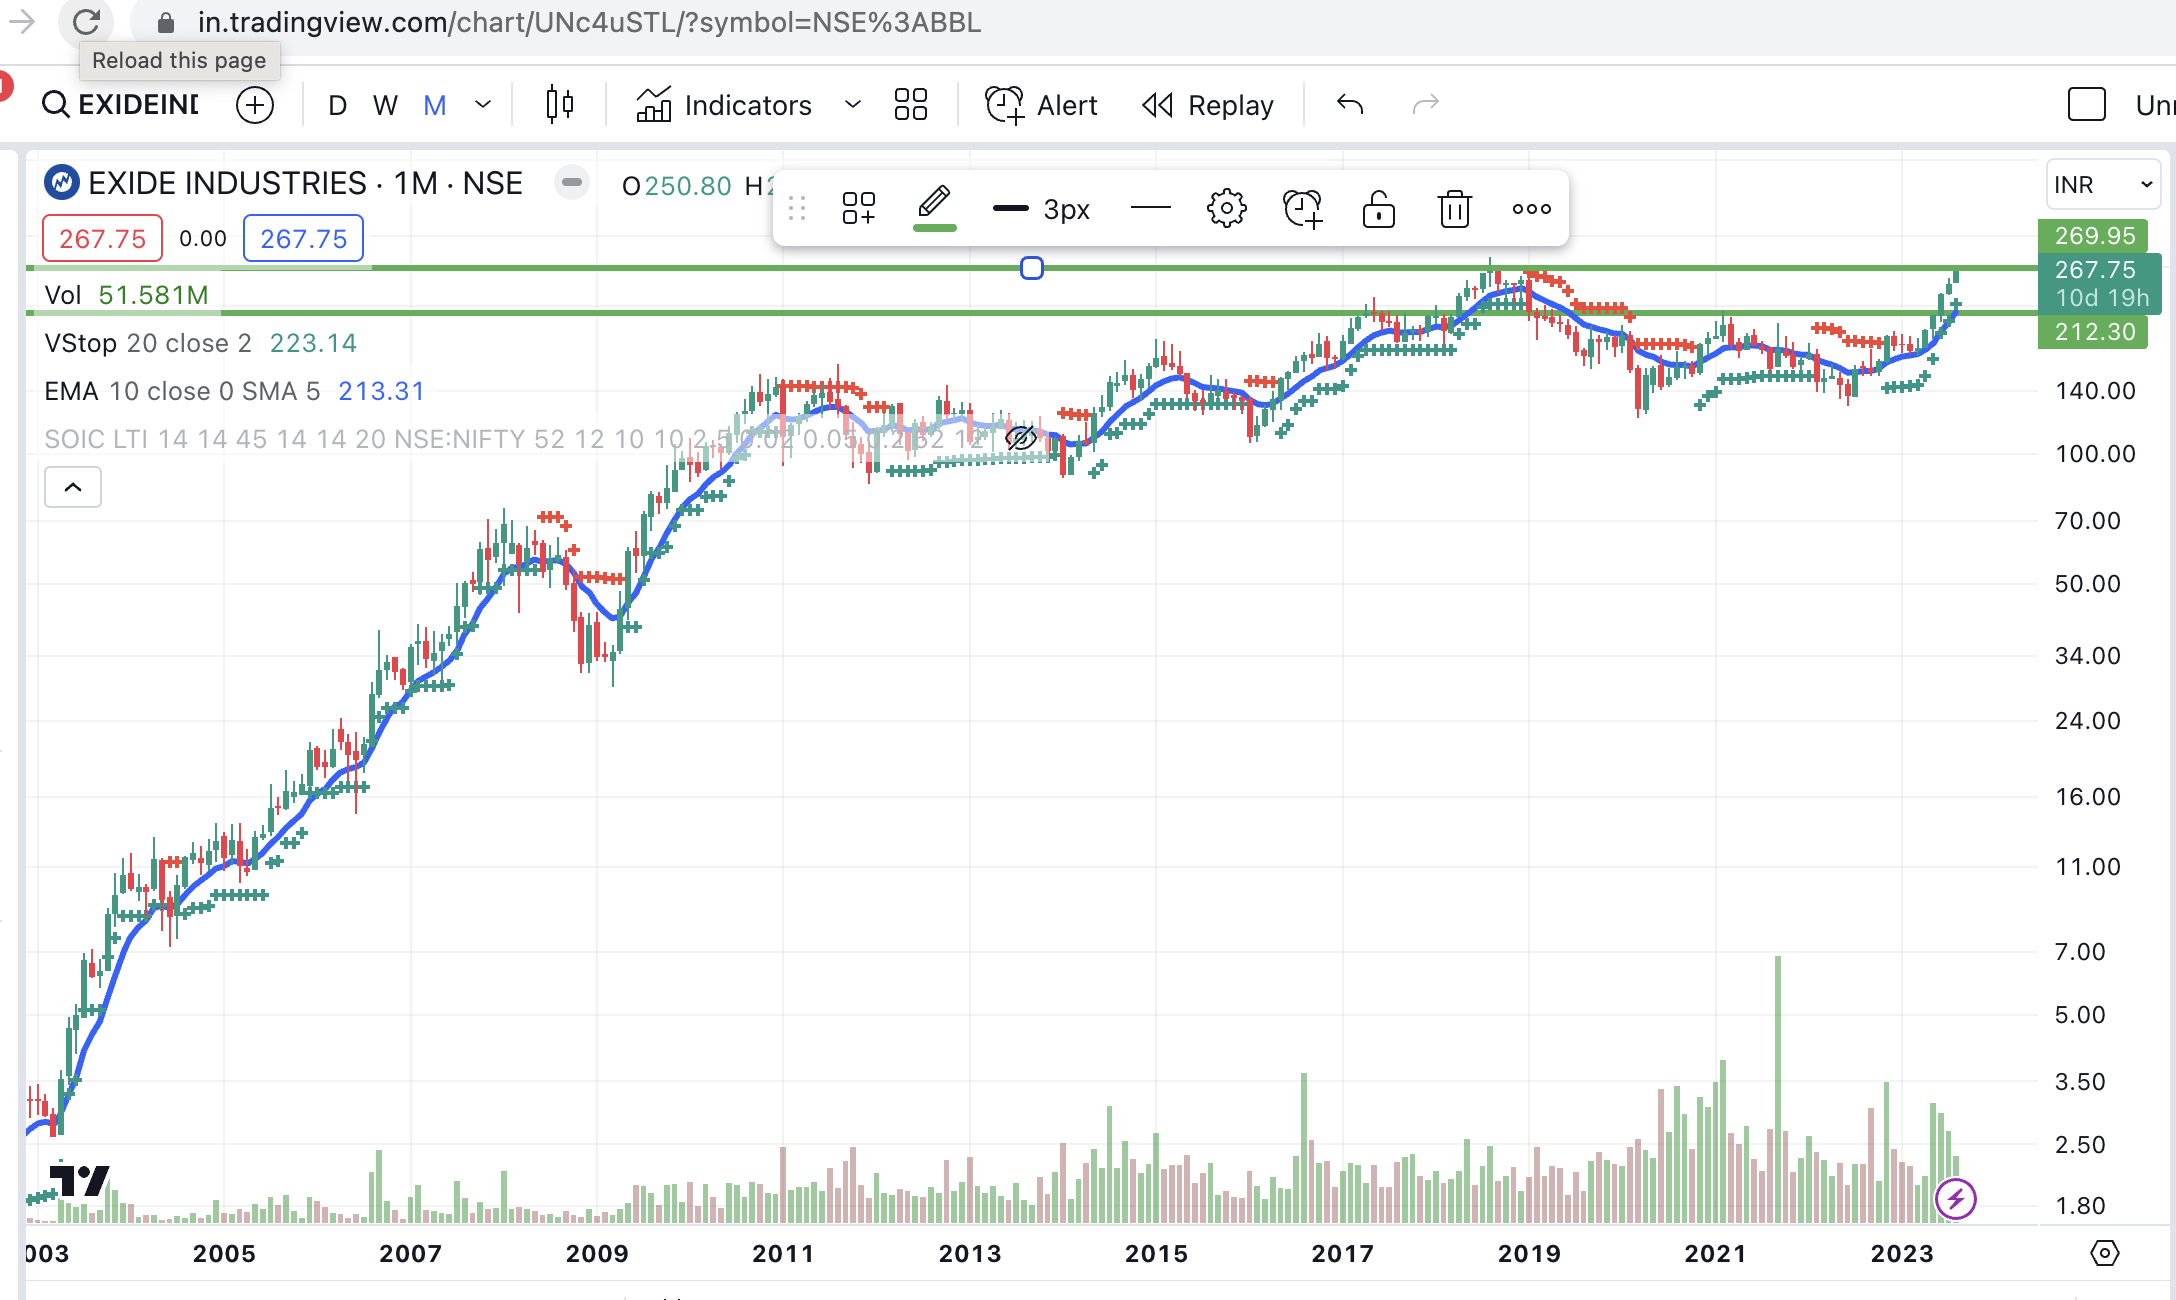
Exide Industries seems to be on verge of 5 year breakout with good volumes.
As EV is the buzzword throughout the world, company has started EV plant and made a technical collaboration with SVOLT Energy Technology Co. Ltd., China, for lithium-ion cell manufacturing. Company says Lead acid demand will still be in Solar(preserve energy), data center and partially in auto too. We are not sure who will be the winner in EV battery as there are many players entering in it. We have to wait and watch.
9 Likes
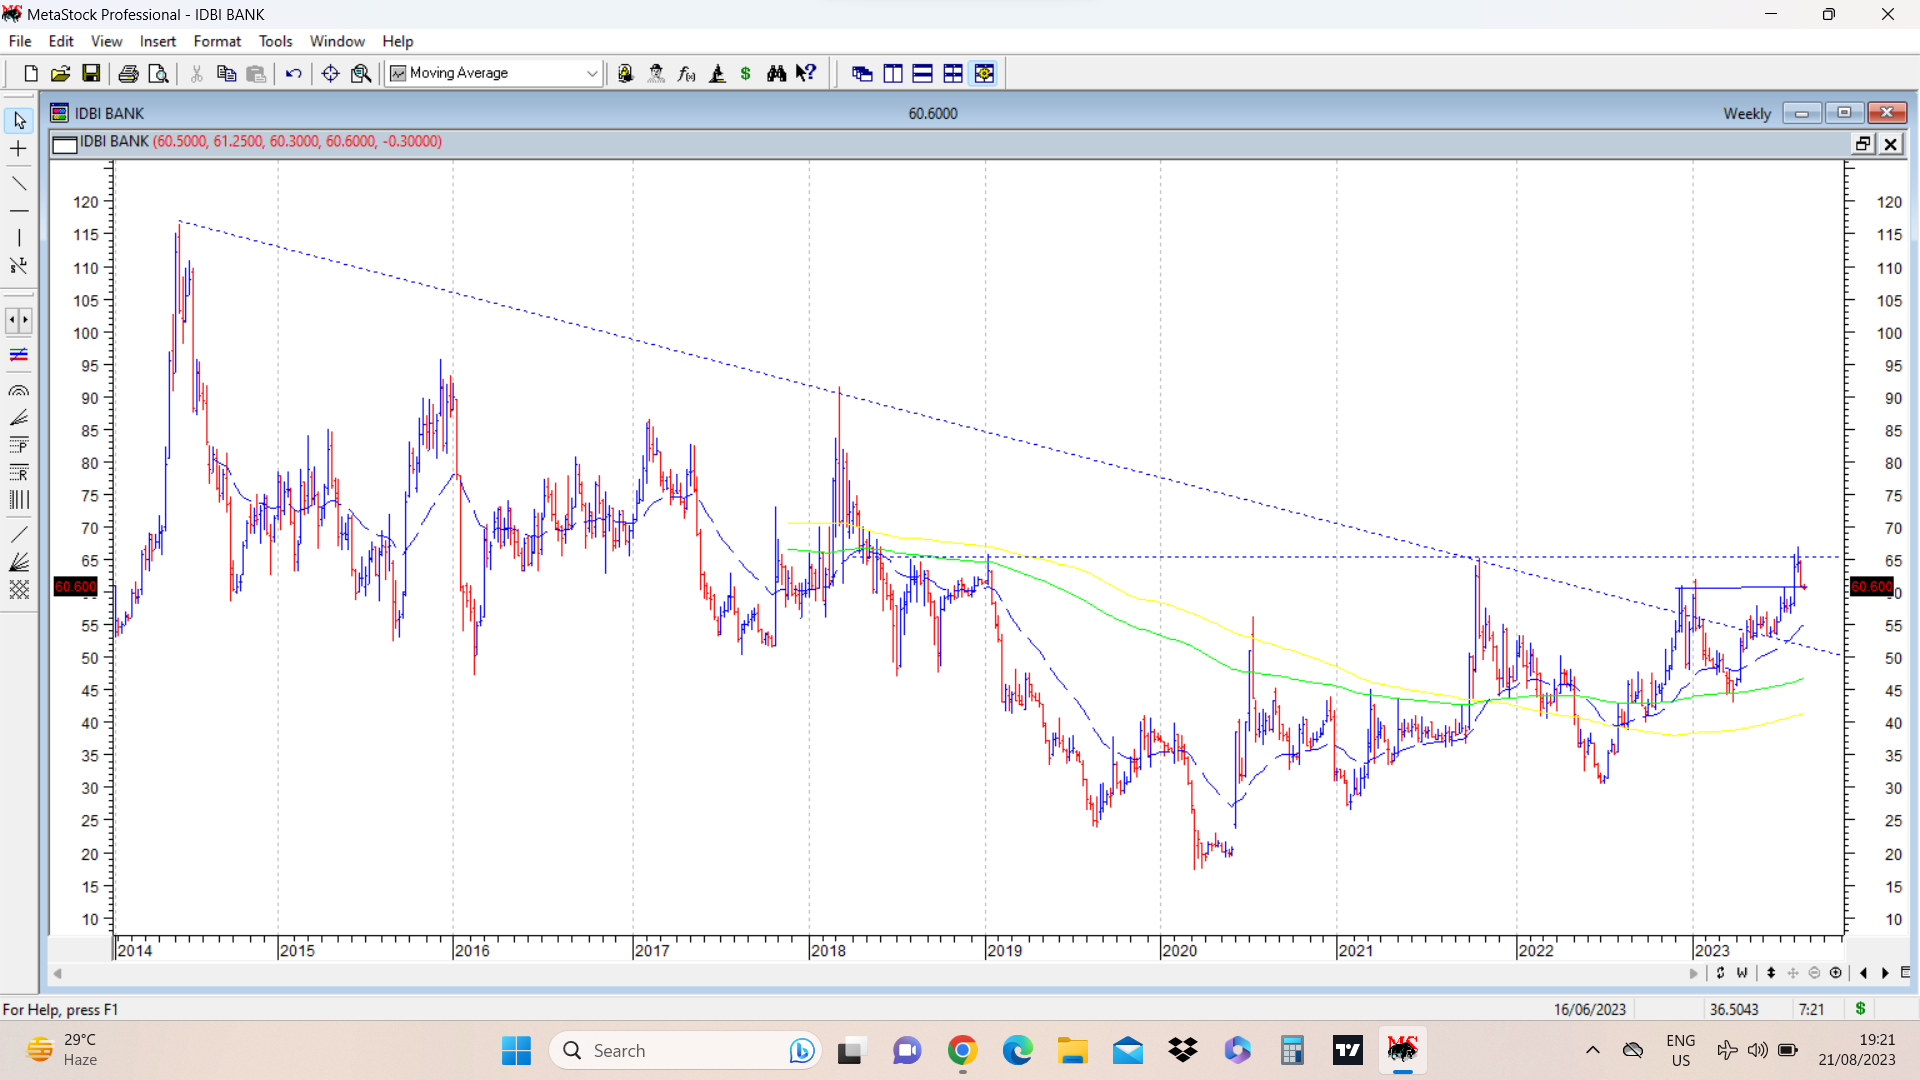
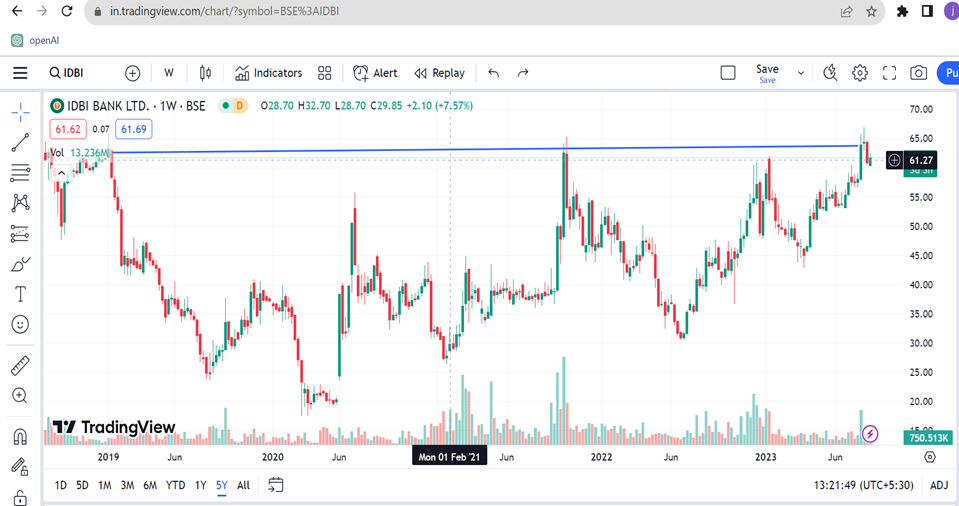
IDBI weekly chart attached shows some interesting observations and patterns within patterns. Stock price crossed its 5 year high of 65 in second week of August and with recent correction in overall markets, has corrected and is now retesting the breakout zone of a smaller time frame inverted head and shoulders pattern at around 60-61.
Fundamentally it has been reporting very good numbers since past 2 quarters, with improvement in loan book, NPA, profits, PCR etc.
Govt and LIC together hold 94% stake and this has always been a candidate for divestment, but for one or another reason divestment keeps getting delayed.
disc: invested as a techno funda buy with a small allocation. Not a recommendation to buy/sell.
7 Likes
J&K bank update. Since last couple of days news regarding dismissal of chief manager of J&K Bank has been floating around and a lot of investors were nervous about the impact it would have on stock price on Monday.
Today’s price action was a bit surprising. Initially stock price corrected to around 82-83 and then reversed and kept gaining strength and ultimately ended up going nearly 8% as compared to last close. So effectively today’s initial downmove proved to be a shakeout move and then stock rallied hard.
I had read somewhere, that when stock does not react too negatively to perceived bad news, the move in the opposite direction is usually very strong. (something similar to a failure pattern) Today’s move was an example in the extreme short term. We can use this kind of learning in situations where something similar happens on a longer term weekly or monthly time frame in positional trades. If something like this is kept at the back of the mind, it helps in future possible situations.
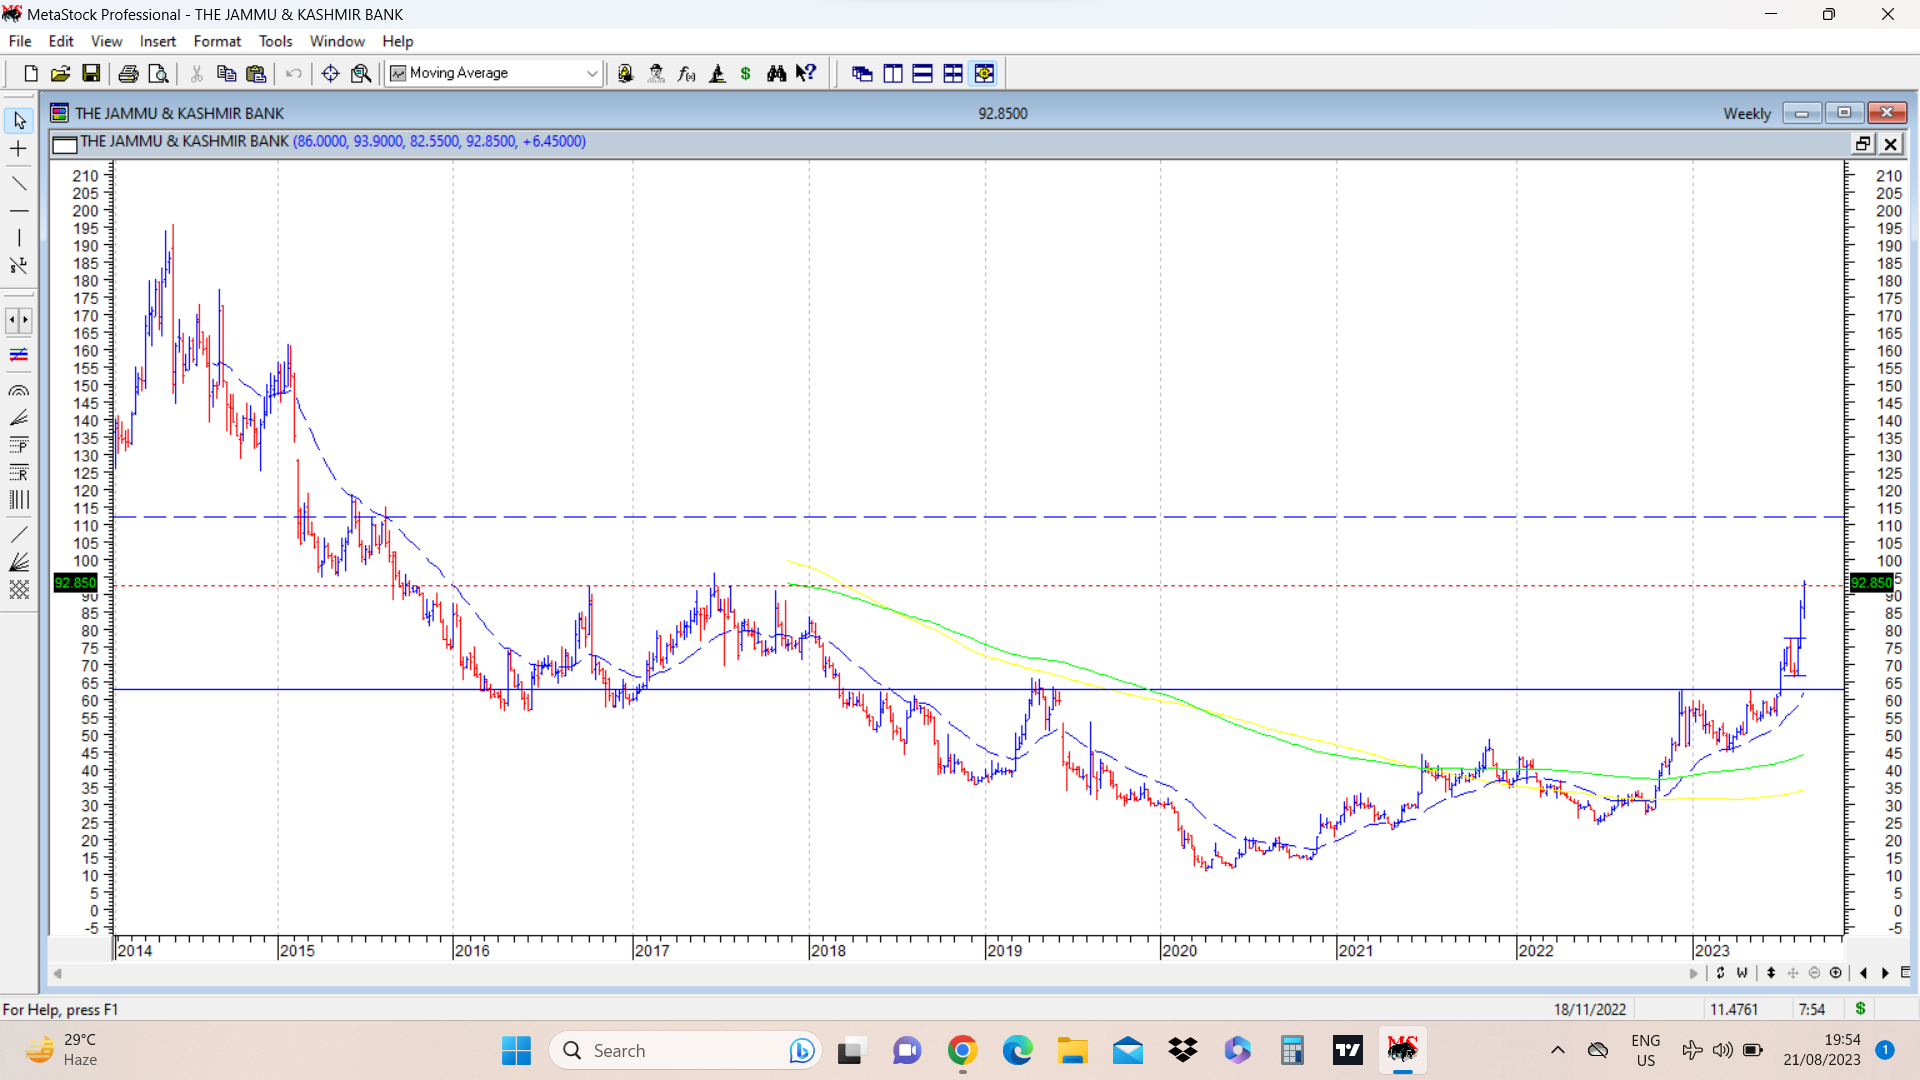
Attached chart shows a crossing of major previous resistance marked in earlier posted chart at 92. Next major resistance also is marked on charts. Ideal scenario would be consolidation at or around 92 for some time before next move to take out next resistance in zone of 112. But how things go is something not in our hands. We have to observe and see how it goes. As of now, uptrend remains strong.
19 Likes
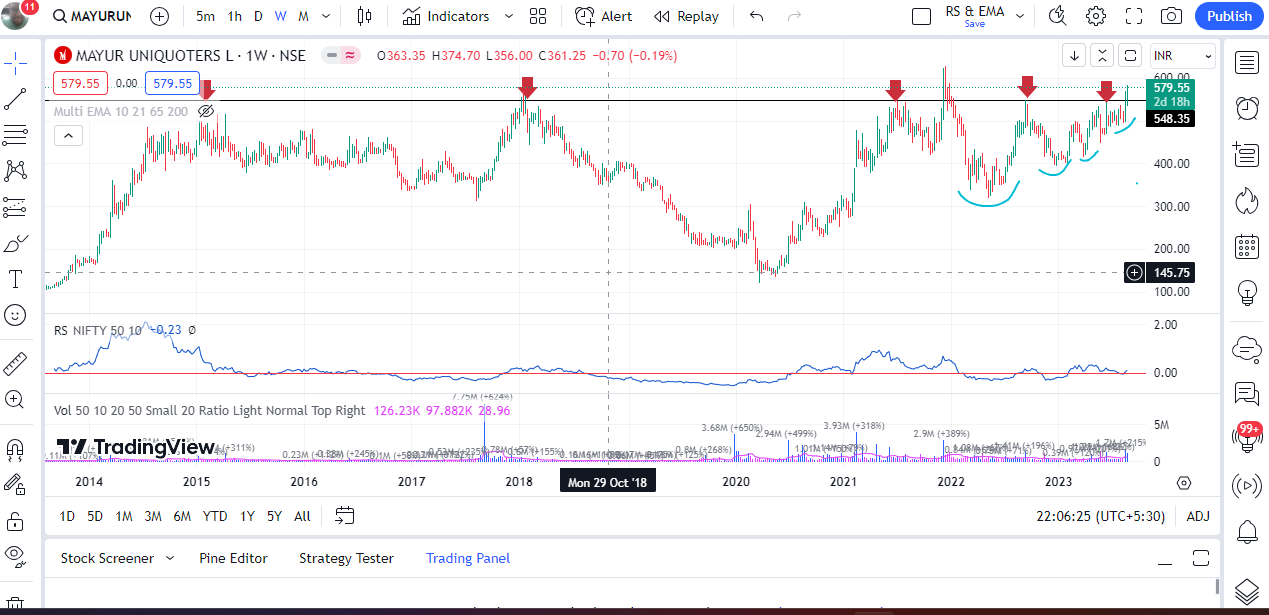
Mayur Uniquoters: Breaking out from a 9 years of consolidation. Mark Minervini classic VCP pattern is formed.
On fundamental side, management Q1 commentary is very bullish and company is guiding for 20% cagr for FY24 to FY26 with margin improvement.
14 Likes
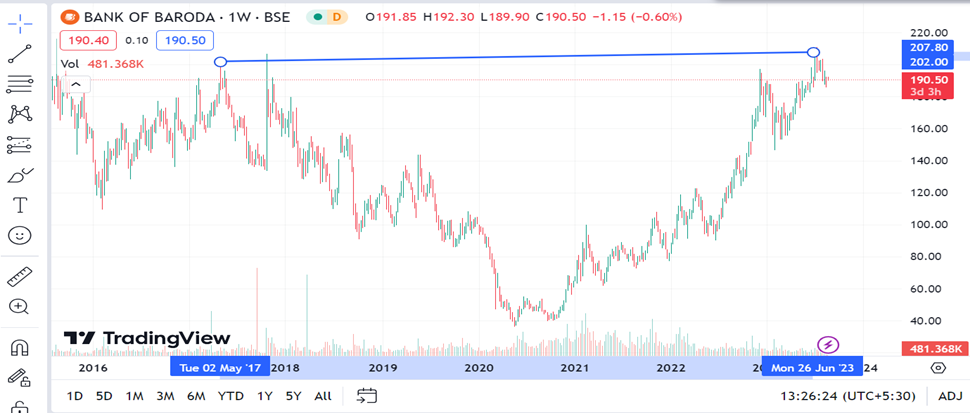
@hitesh2710 - Hi Hitesh, thanks for your consistent contributions to this thread. You got me interested in identifying patterns, charts, price action etc., which I never used to look at earlier. So in the PSU themed stocks, I noticed that after having had a great rally in the last 1 year (which is still on going), most of them are now still at the same level where they were 5 years ago. Posting some examples here. Interested to know your read on these from a technical set up standpoint. Also, you reckon they are completely out of the woods yet after having under performed for almost a decade?
Bank of Baroda
IDBI Bank
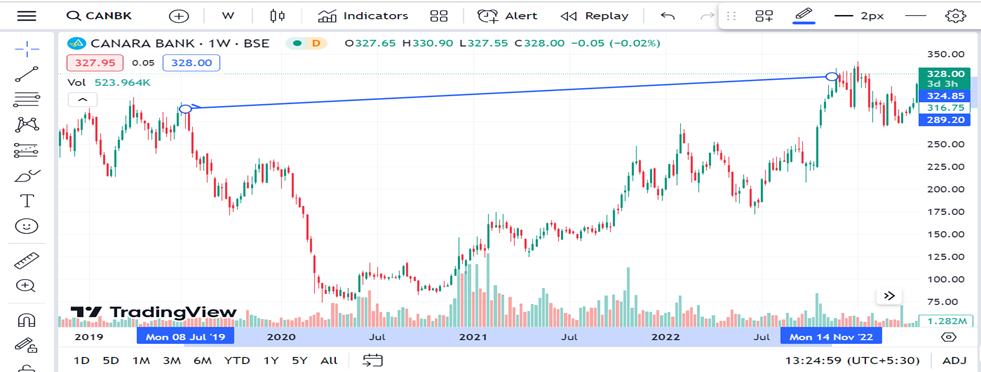
Canara Bank
2 Likes
Usually when a stock ( or more specifically stocks in same sector or group) clears a major resistance like 1-2-3-5-10-15-20 year highs, it indicates that something has changed for that company or group or sector. Stocks can go up 5-10% based on rumours, or some concentrated buying by a famous names and then followed by their followers , or some fundamental triggers etc. But these often are short lived, unless the trigger is strong enough to keep the stock’s uptrend going.
But when we have a stock that clears say 5 year high, it indicates that all the negative sentiments, news,fundamentals that it suffered from during the last 5 years have been overcome. ( In some rare instances, stocks collapse after clearing major resistances. But these are rare) And once a change in perception (positively ) regarding a business happens, there is a strong appetite for that particular stock among market participants.
And logically speaking also, for a stock that has not gone anywhere for a long period of time to post all time highs will entail clearing first a 1 year high then a 2 year high and so on and so forth. So for us, its a choice when to join the journey in a stock’s upmove . For that we have to work on the company and try to figure out triggers, by researching the company in details.
48 Likes
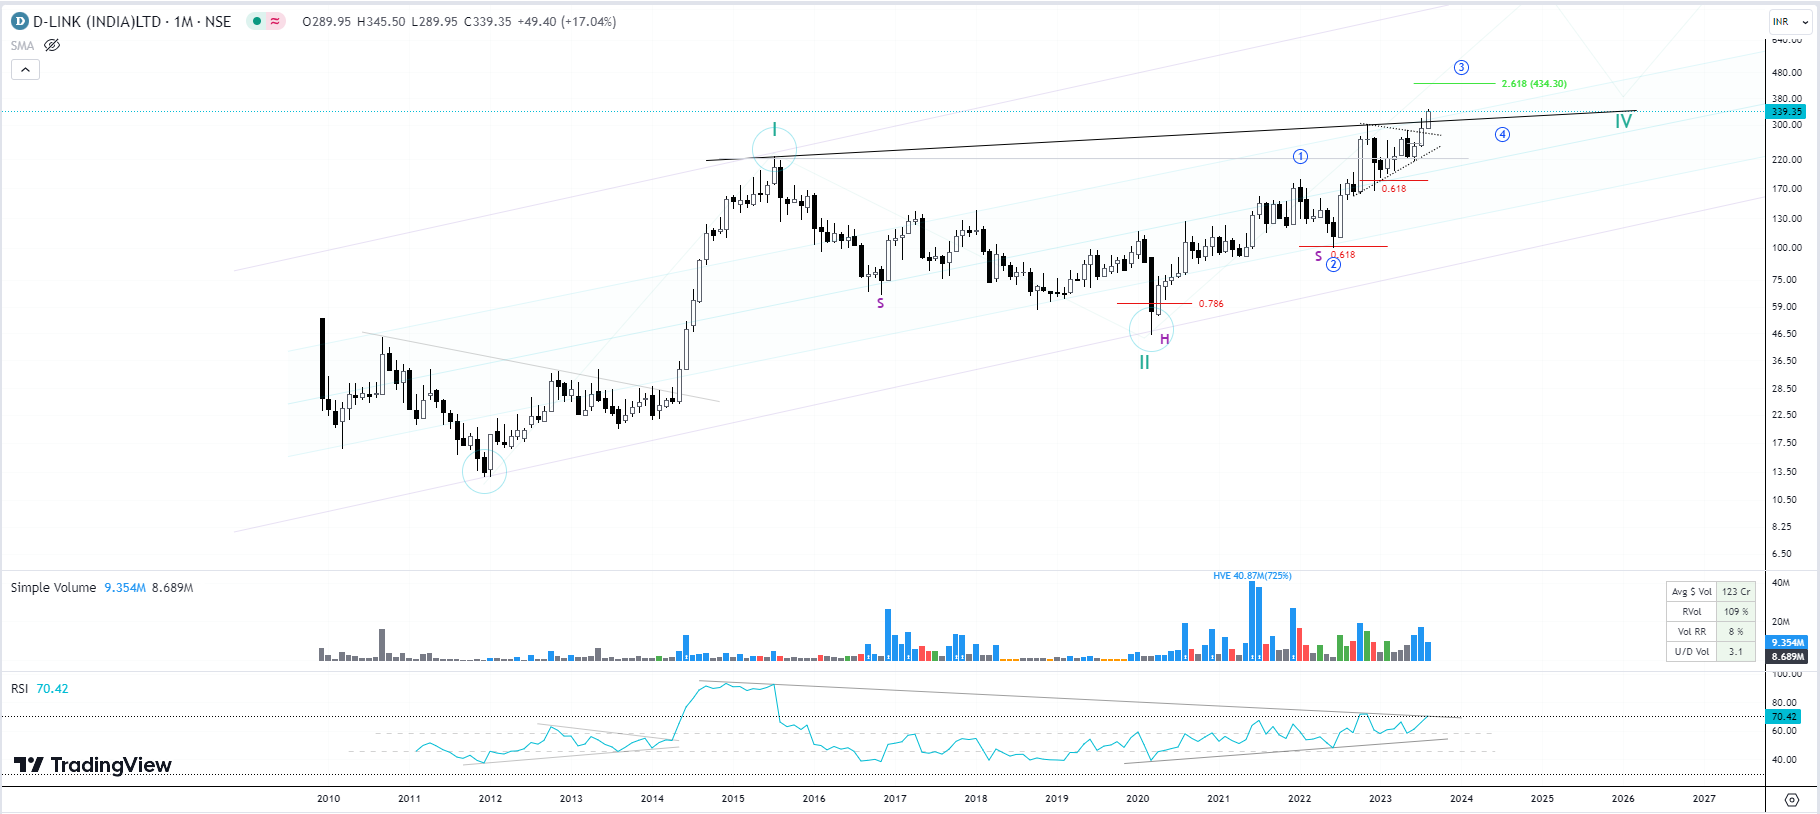
Update on DLINKINDIA- 265-340 CMP:
- As discussed earlier, the pennant has broken out.
- A multi year slant breakout seem done on Monthly chart, with rising volumes.
- RSI is on the verge of breaking out.
Safe to assume bullish bias ahead.
5 Likes
VST Tillers Tractors - 2 year breakout on weekly chart. Fundamentally also company looks good. They have given a growth guidance of 3000cr in FY 26(current revenue is 1000cr). Need to be monitored on quarterly basis to see if company can achieve the guidance
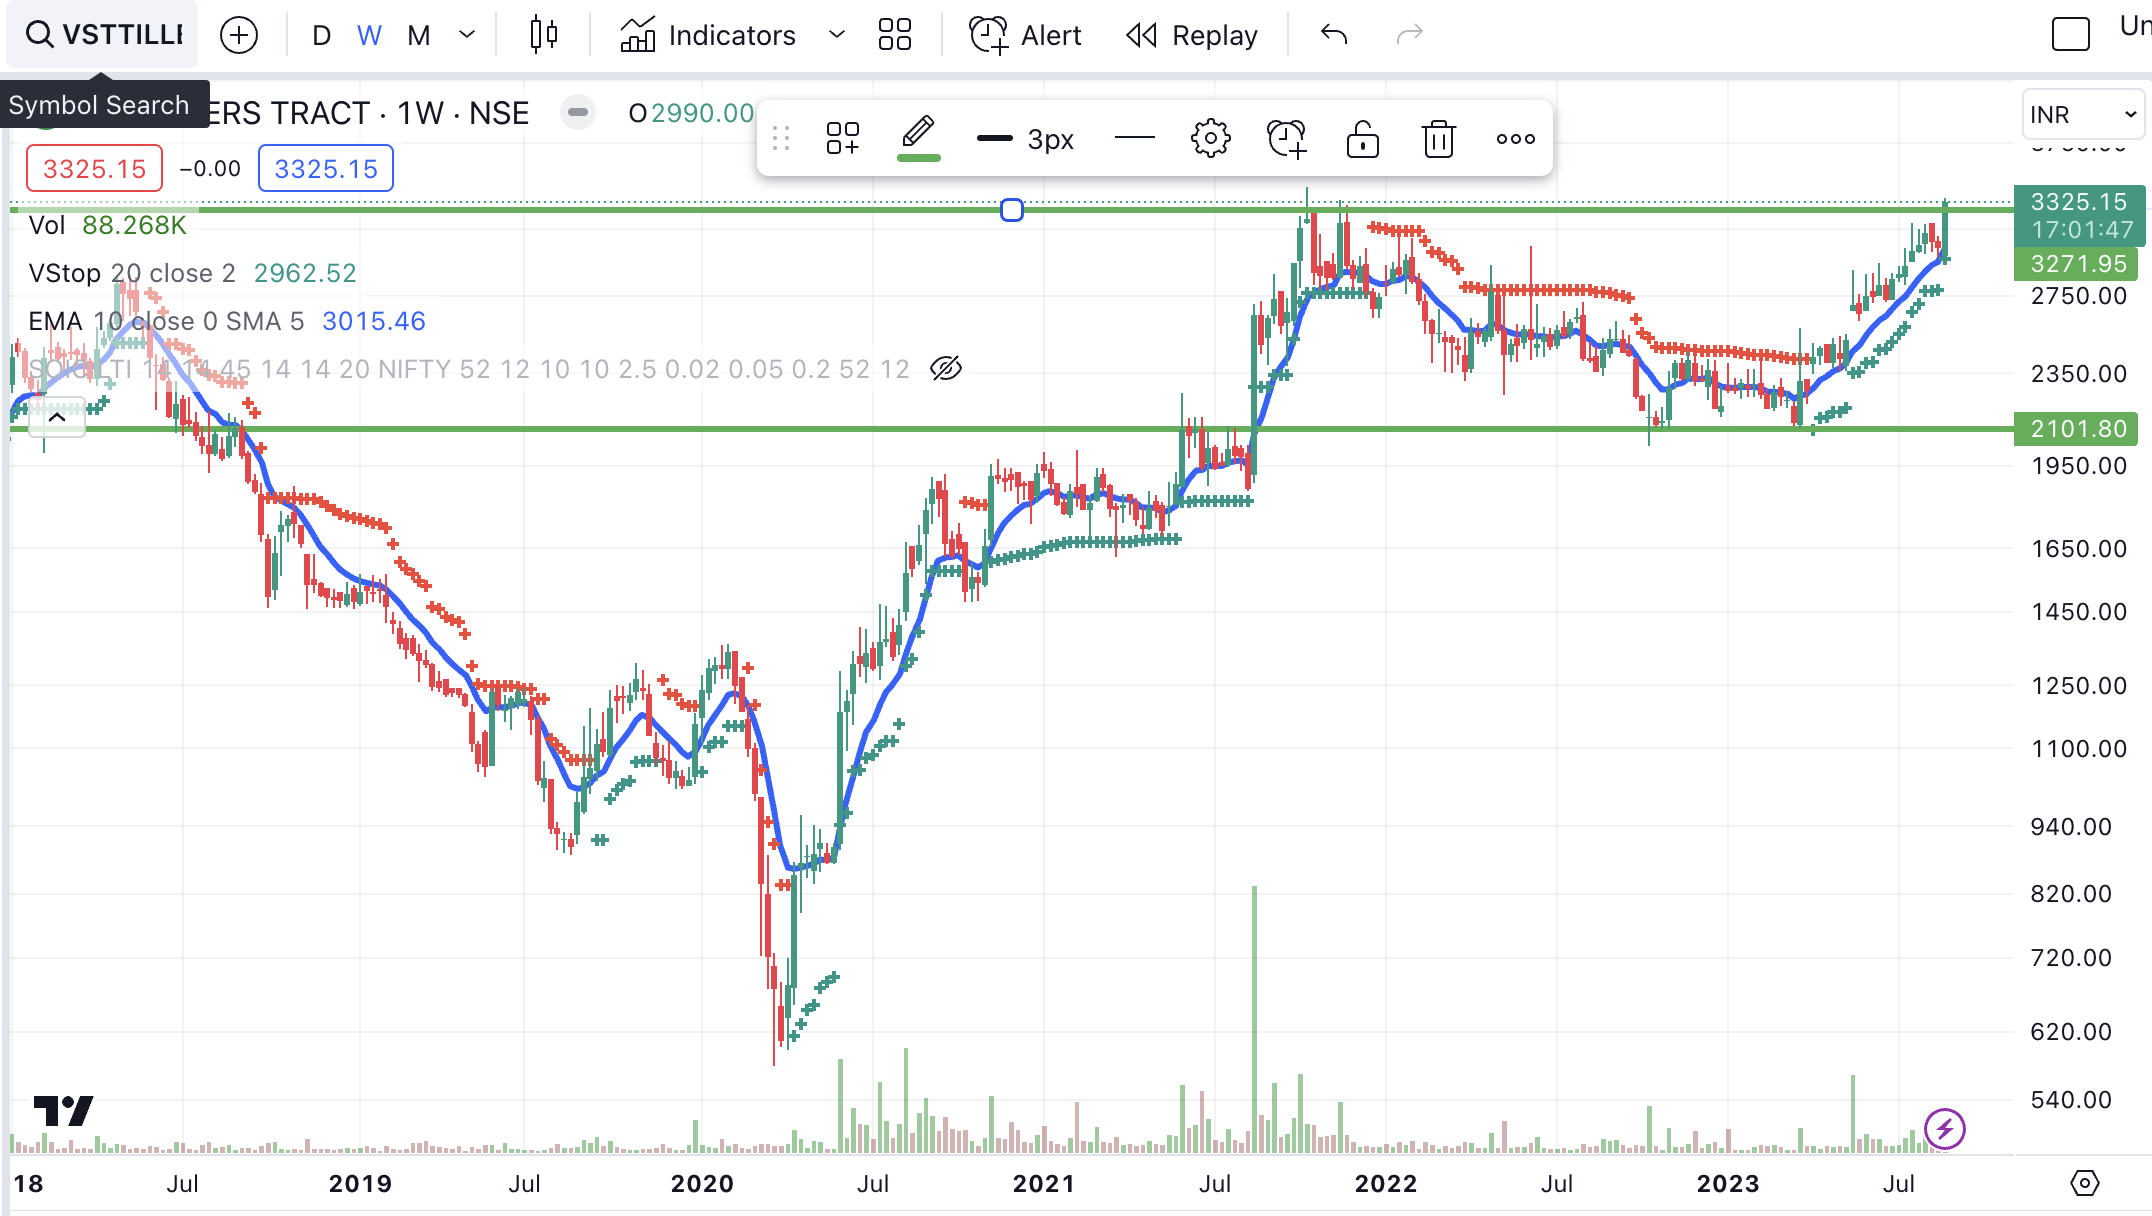
6 Likes
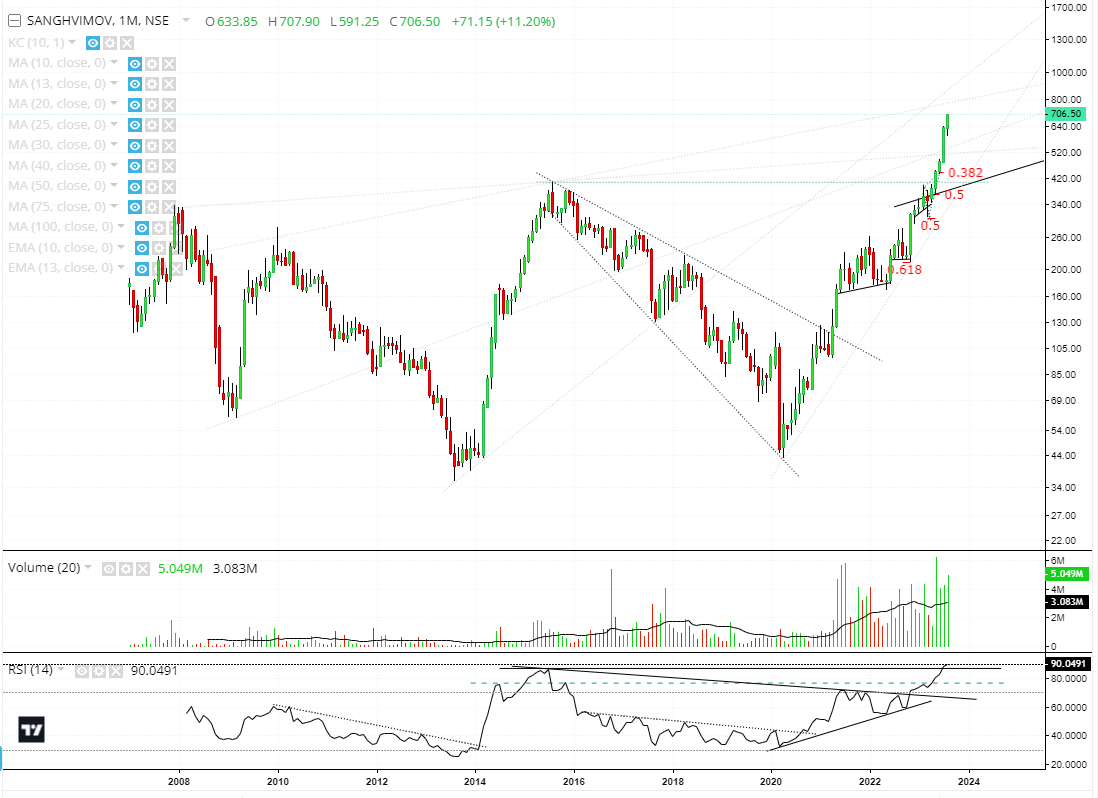
Update on Sanghvi Movers: 370-624-706
- A series of bearish HnS patterns negated,
- A multi year downward wedge played out,
- Shakeouts at multiple junctures along with positive RSI divergences
Has all led to it making an ATH. Monthly chart below:
8 Likes
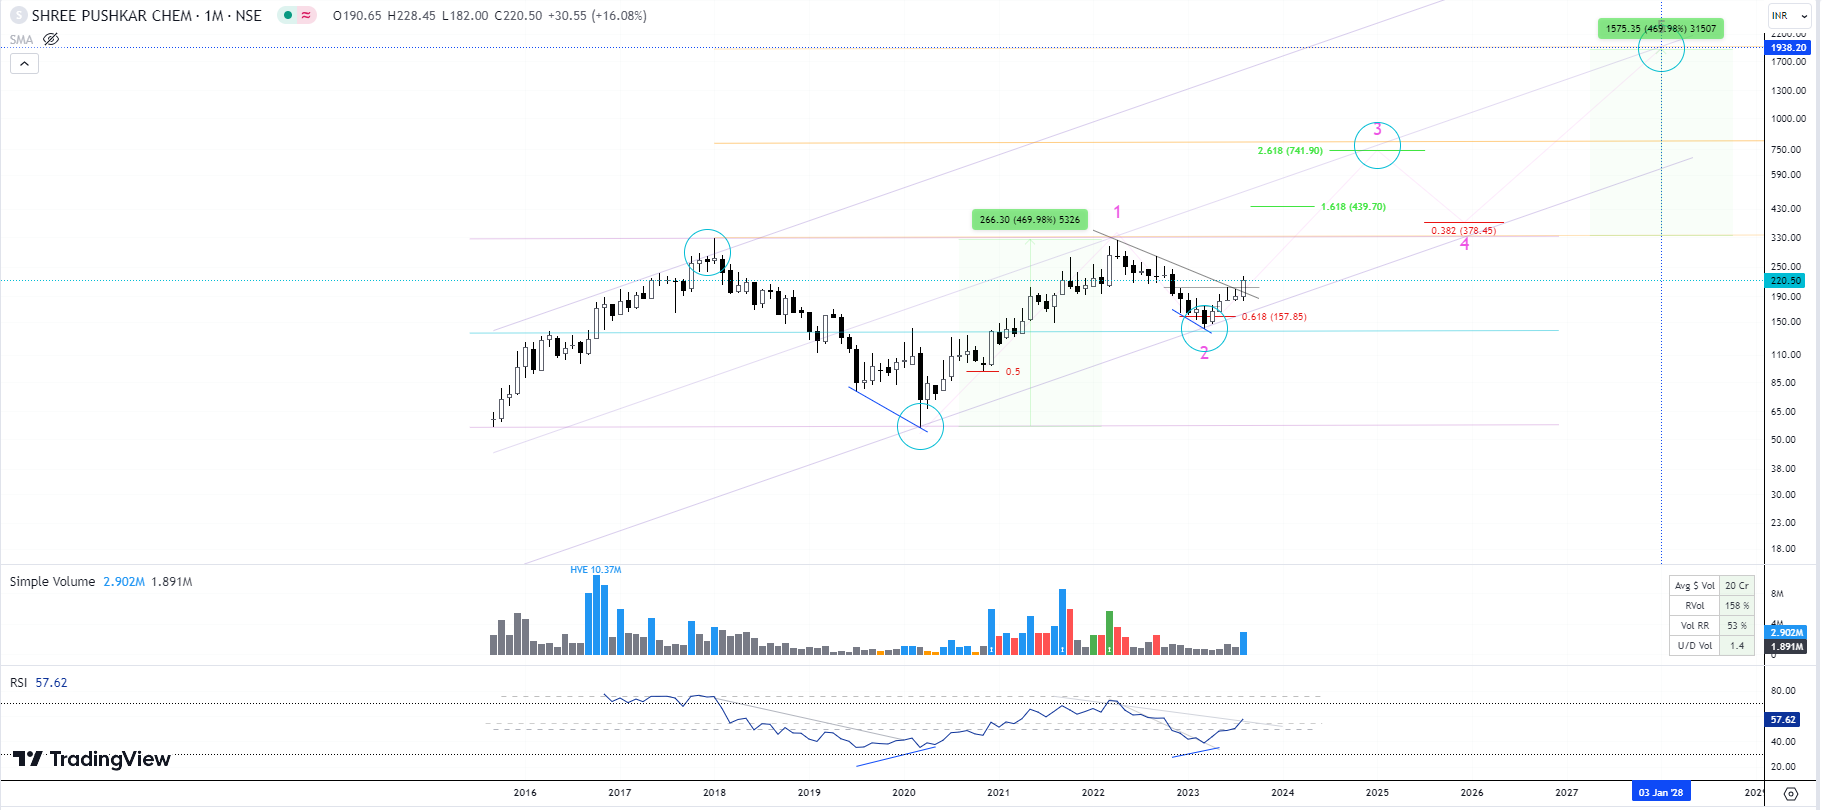
Update on Shree Pushkar: 167-225;
- Monthly chart attached: significant breakout with volumes.
- Channel bottom respected and Fibo 0.618 level respected and price turning from those levels.
- Weekly Chart, breakout, retest and tennis ball jump seen with high volumes.
Safe to assume a turnaround on cards and bullish bias moving forward.
5 Likes
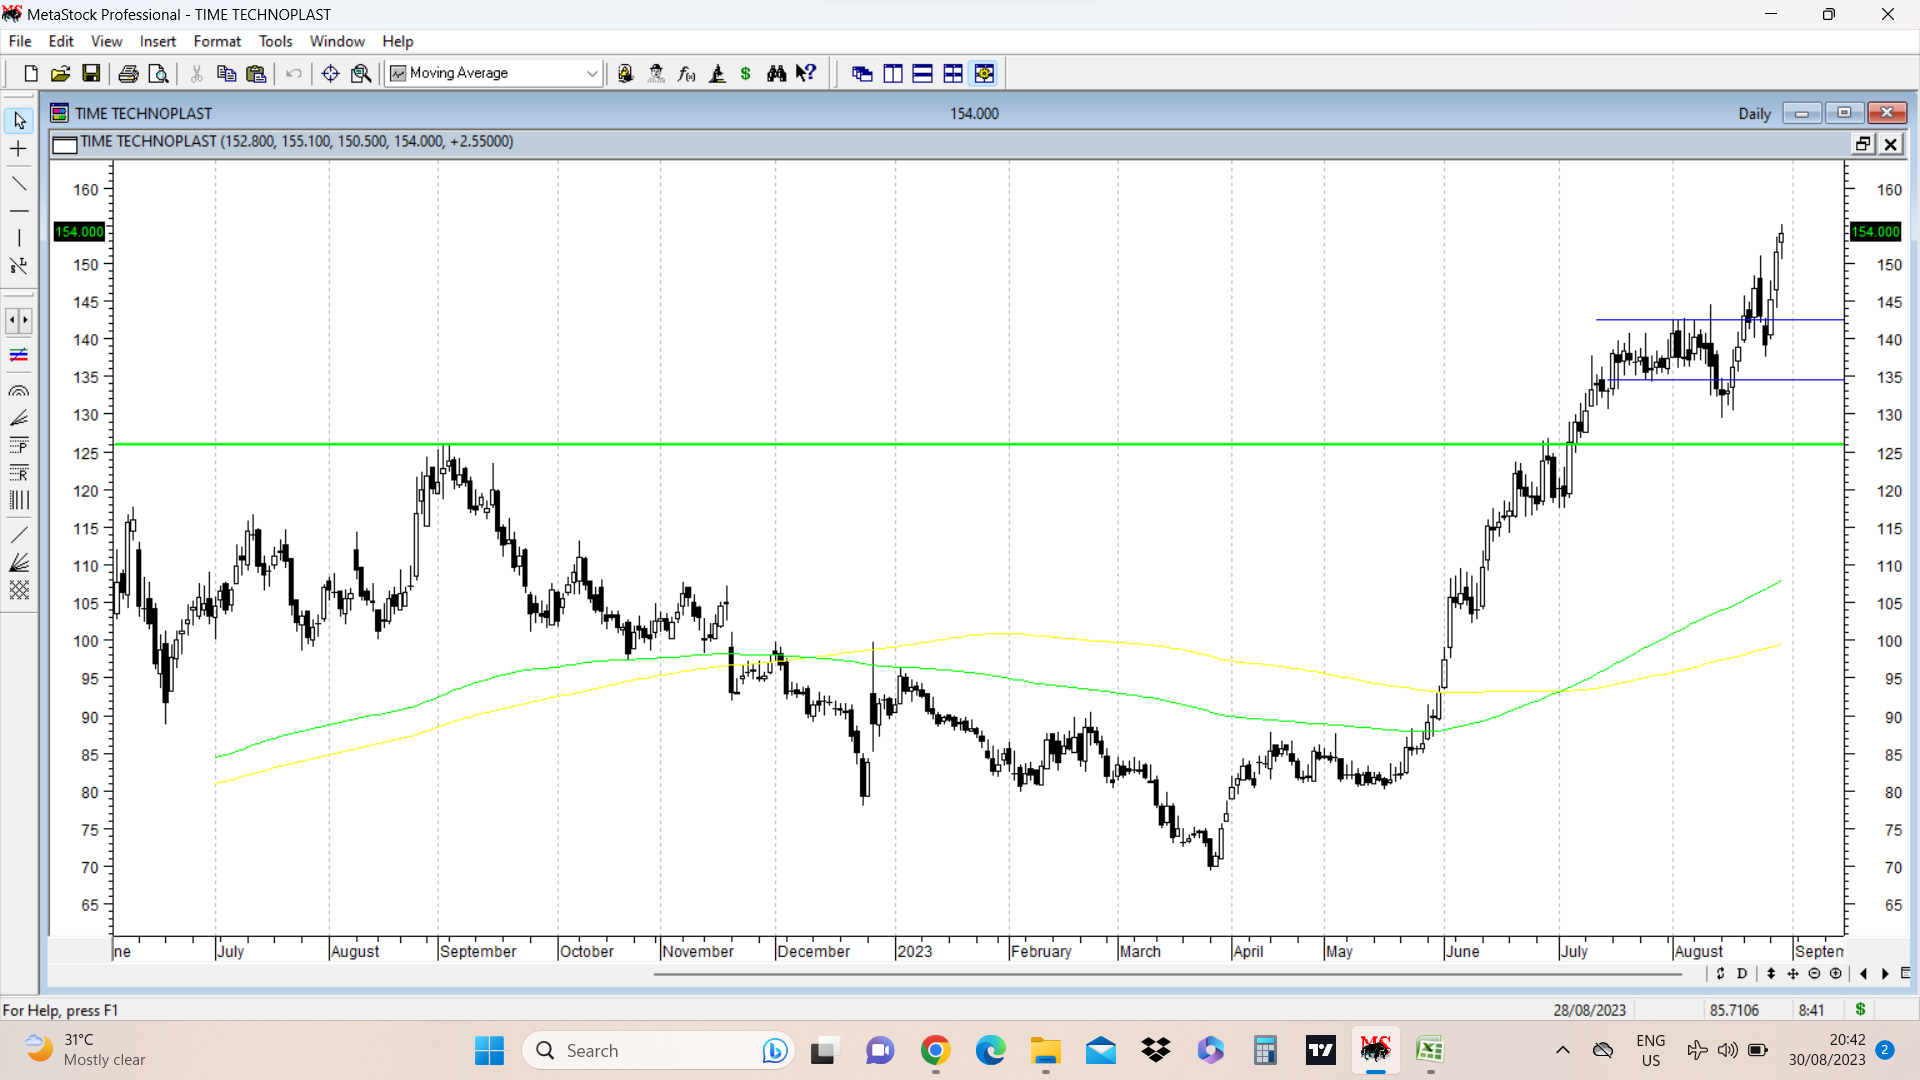
Time techno update.
As mentioned in above post, resistance of 140-144 was taken out with a weekly bull candle. But on daily charts, there was a little bit of drama playing out. As shown in the daily candlestick chart, stock price was range bound between levels of 134 on downside and 142-144 on upside. There was a false breakdown and stock price hit a swing low of 129.50 before reversing and getting back into the channel. It then started an upmove, went out above the resistance and hit a swing high of 151, and then was promptly followed by two bearish dark candles and the retest of the breakout zone of 142-144 went down to a low of 138 and then it turned up again and there have been three bullish daily candles with today’s closing at 154, well above the resistance zone.
The weekly candlestick chart provides a much more clearer picture and there, this week is a major breakout week in terms of candlesticks. We still need to see how it closes this week. ( will update once we get a weekly close)
The all important nearly 5 year high level is marked in green solid line at 125.
disc: invested.
14 Likes
Shree Pushkar weekly chart shows a small cup and handle breakout above 207. Since 3 weeks post this breakout, stock price is consolidating above the breakout level. Range of this cup is between 140 to 207, and if pattern plays out, target can be 270. Neckline of cup and handle and potential target marked in blue lines. All time high is at 330 range, marked by dotted red line.
disc: no positions, but in watchlist.
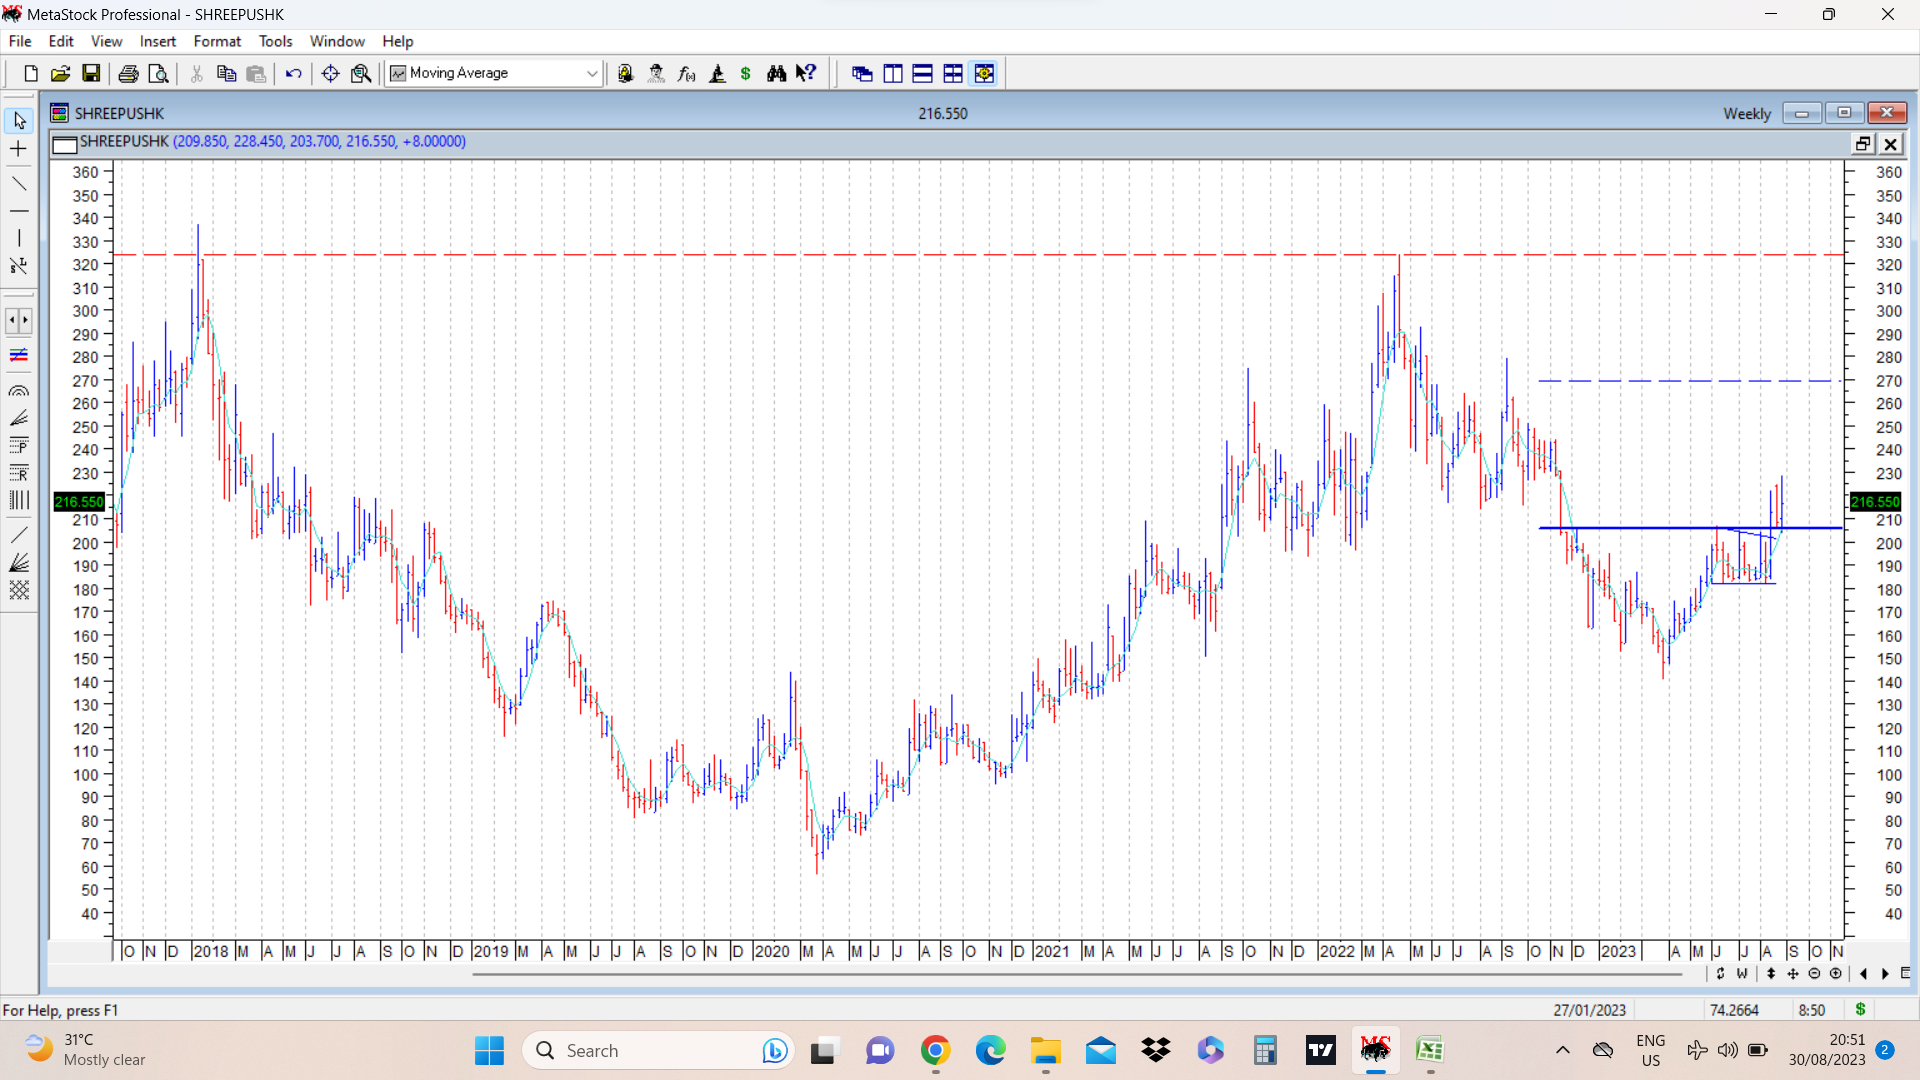
15 Likes
Sir, do you consider volume, or only price? If you do, how much focus or emphasis do you place on volume?
Does volume need it to be incorporated in chart analysis, for all kinds of participants, or retail need not bother because of their smaller positions, and is the absence of high price move, but good volume a precursor to a big up move?
Your thoughts please.
2 Likes
@hitesh2710 Sir,
Is there cup and handle formation in Shakti Pumps, it is on the verge of breaking all time high levels:
1 Like
Here the handle is too deep to be considered a classical C&H.
11 Likes
4 Likes
Volumes play an important role in chart analysis. I usually look at volumes mainly in few scenarios.
First is during some kind of volatility contraction pattern, where stock price undergoes tight consolidation/compression and volumes dry up totally. If there is a breakout from this kind of a pattern, it should ideally be with very heavy volumes. ( Its very rare to see such a breakout with lower than expected volumes. )
Second is during initial stage of correction in a particular stock. When after a sustained bull run, we get a big bearish candle with very heavy volumes, it is usually a precursor to a bigger fall. Most of the times during routine bull market corrections, the corretions happen on low volumes as compared to volumes on up days.
Thirdly when there is a major breakout above a strong resistance area, say breakout from a cup and handle, or inverted head and shoulders or a rounding bottom, or above 52 weeks highs, or multiyear highs, a big bull candle on weekly charts with heavy volumes gives added confirmation.
Most of the technical analysis books will lay emphasis upon volumes along with price action. I usually don’t put up volumes in most charts I put up because it creates too much messiness in the picture. But usually I check volumes to confirm that they are in sync with pattern breakouts.
51 Likes