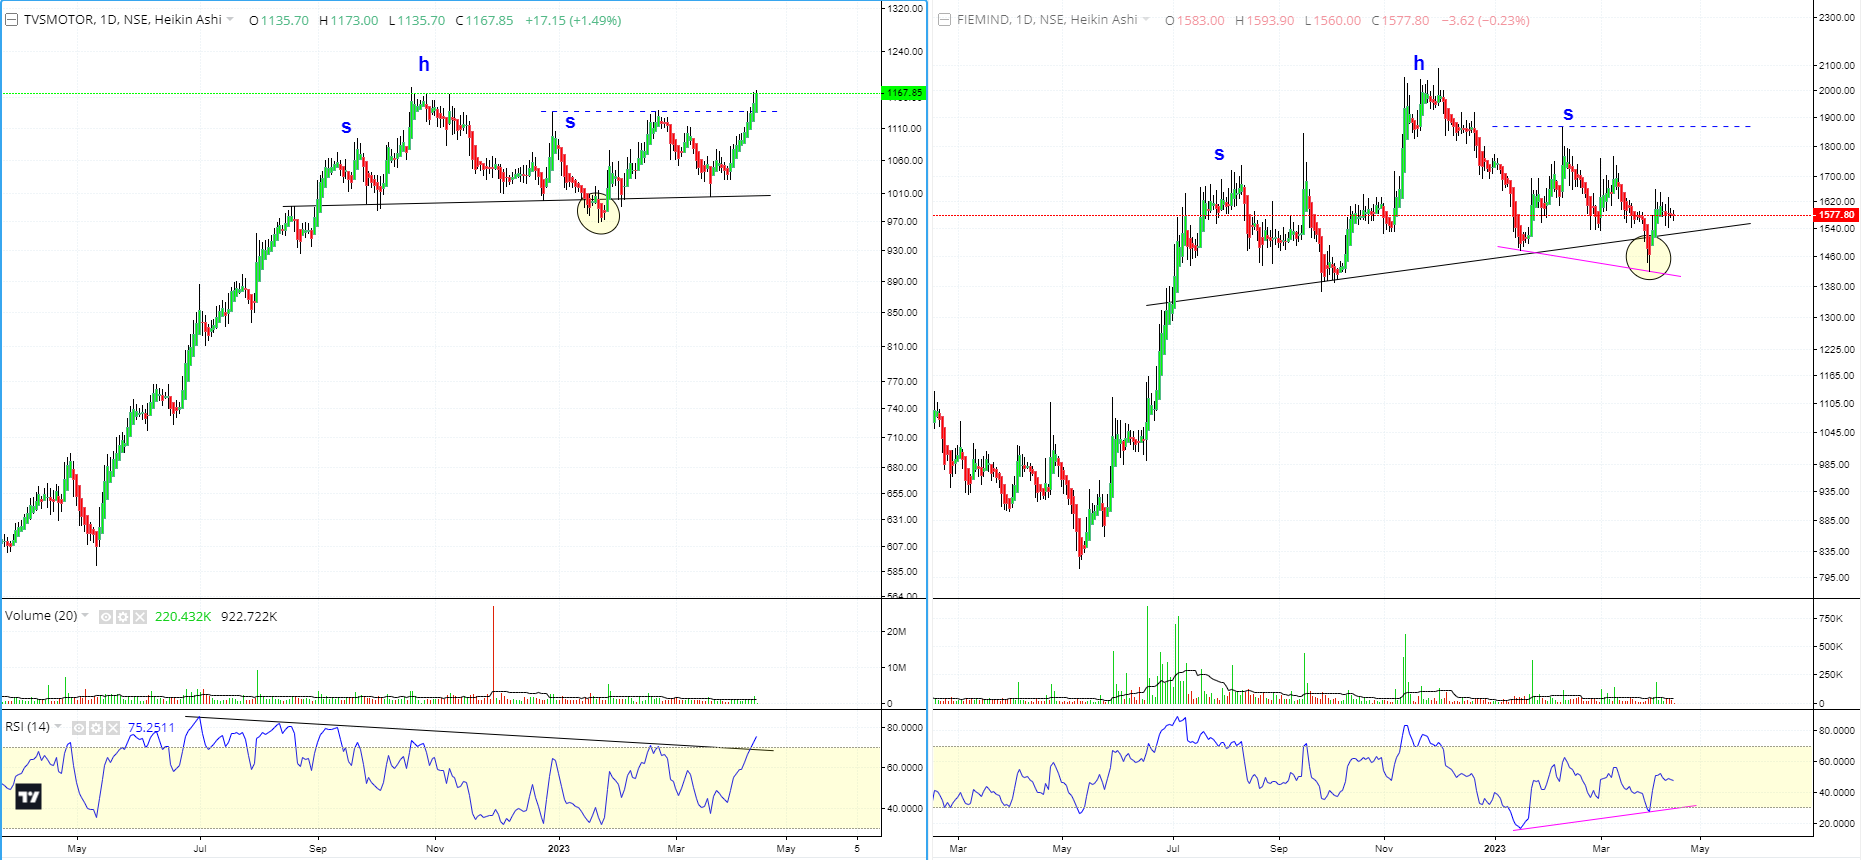
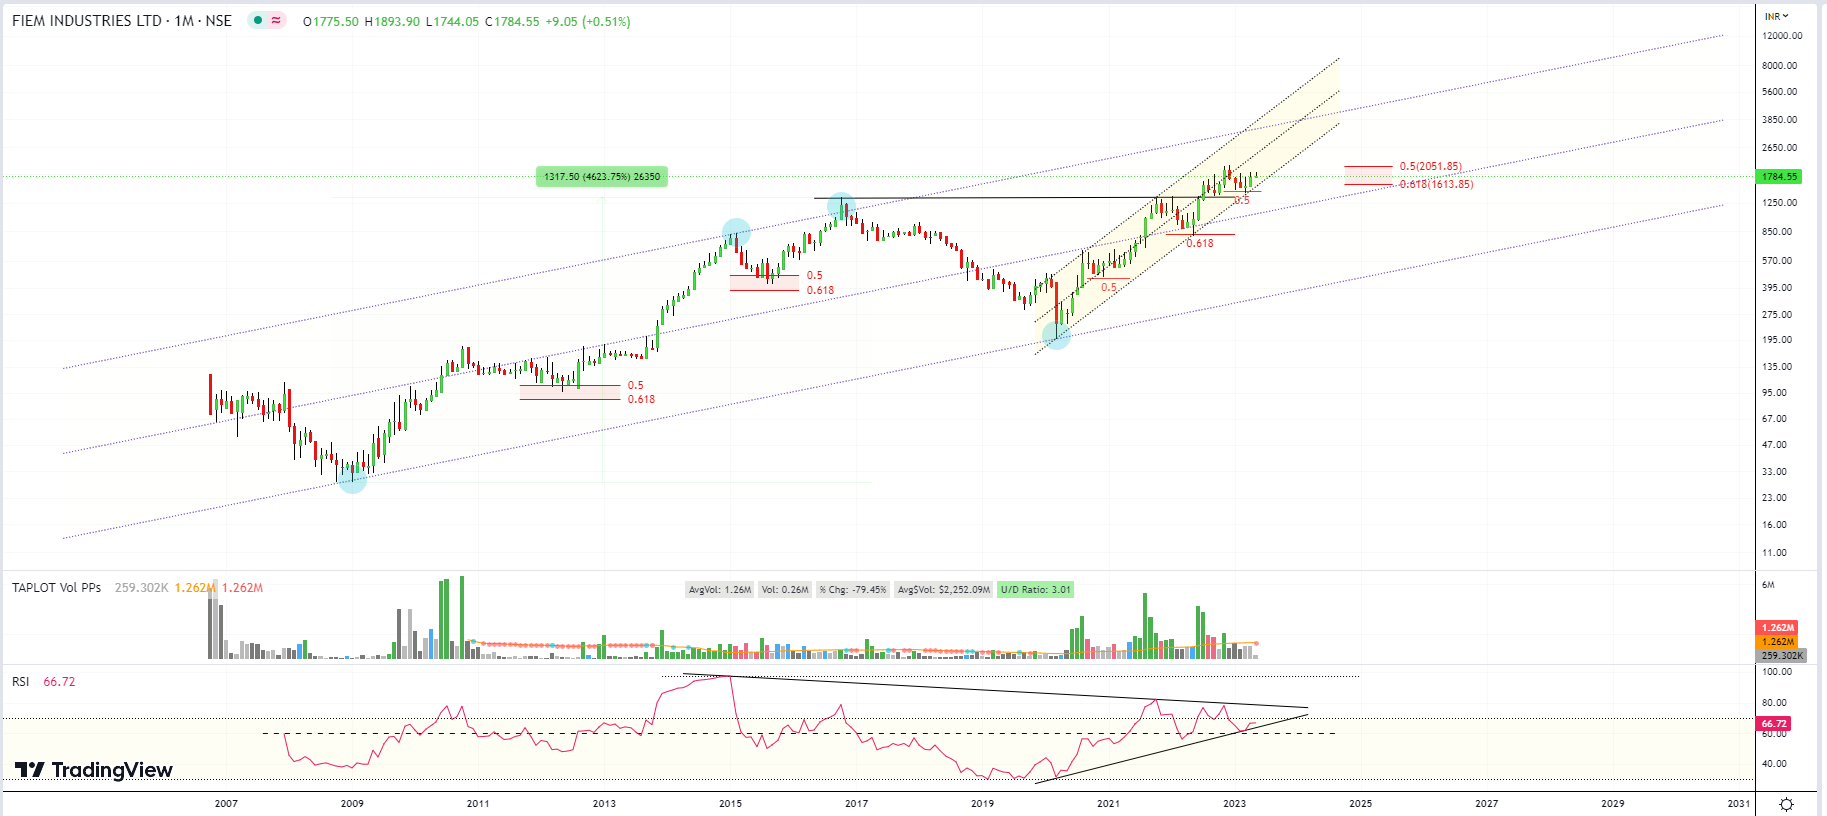
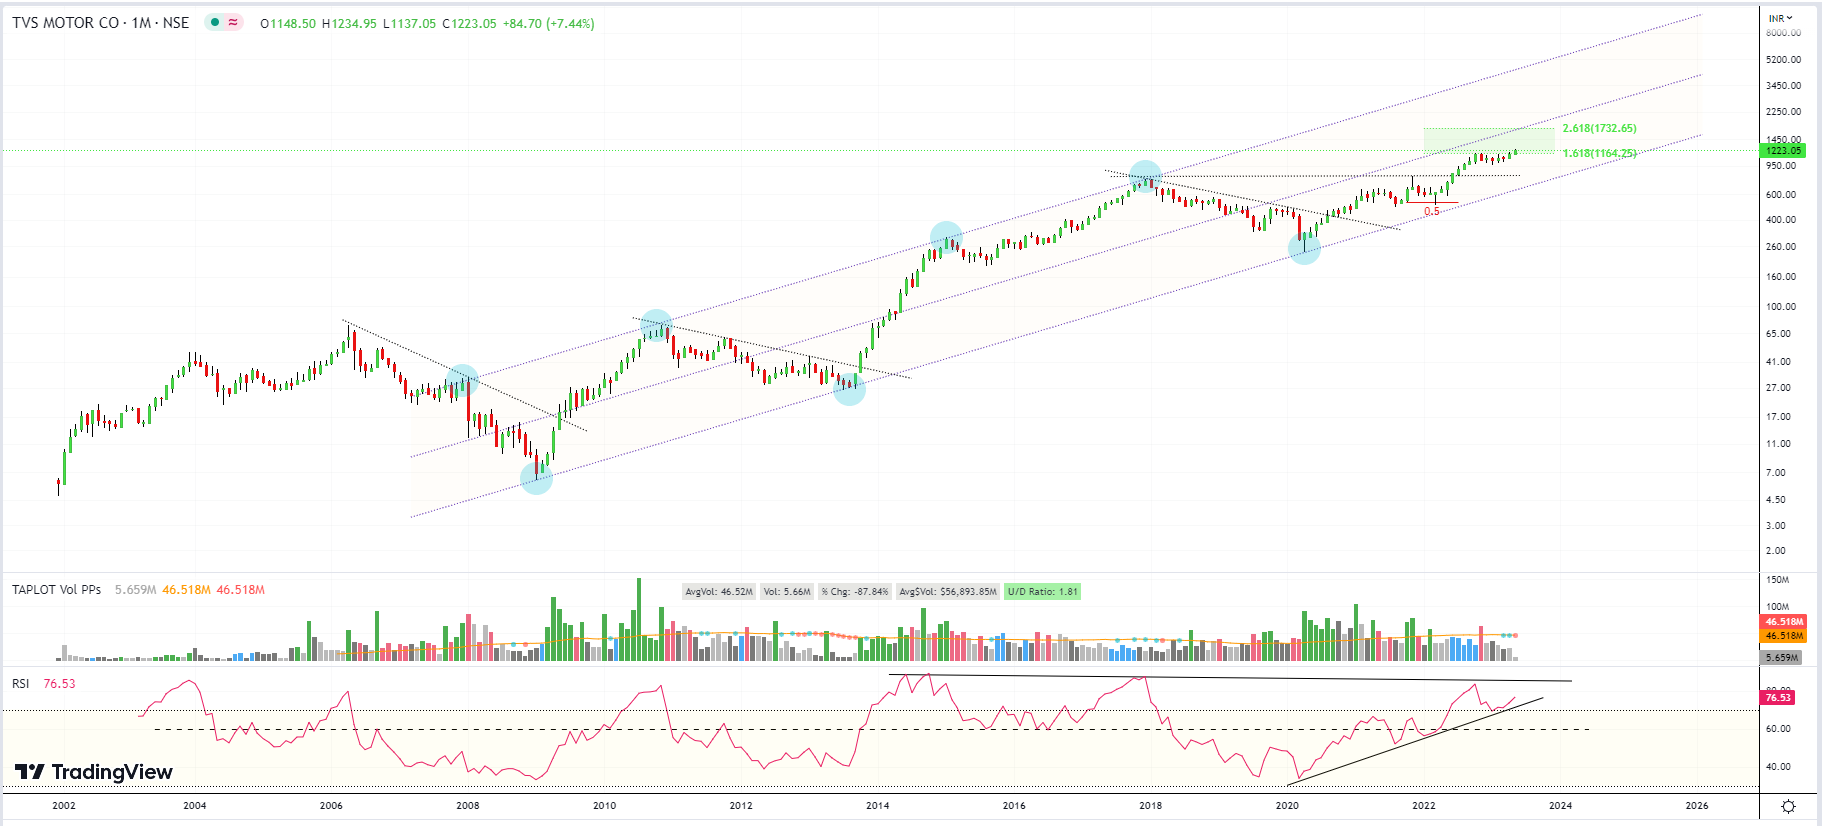
An interesting display on Daily timeframe charts of TVS Motors and FIEM Industries:
TVS Motors is one of Fiems top clients.
TVS has reversed from a H&S pattern and crossed the right shoulder, making it a very bullish pattern and primed for an upmove. As it can be seen (yellow circle), a shakeout also took place.
Similarly, Fiem has seems to be reversing from a H&S pattern while giving a similar shakeout (yellow circle).
Fiem has also formed a Positive RSI divergence (pink line).
When both the Monthly charts are put together, we can see a very high correlation between both TVS and Fiem. the correlation currently stands at 0.88, with Fiem generally lagging, but following TVS price action.
Just an Update on the H&S reversal patterns that Sanghvi Movers made and avioded.
Current Daily Chart, one can see a H&S pattern with a shakeout has led to an Inverse H&S bullish pattern with a breakout (Green markings) and has also crossed above the right shoulder of the H&S pattern.
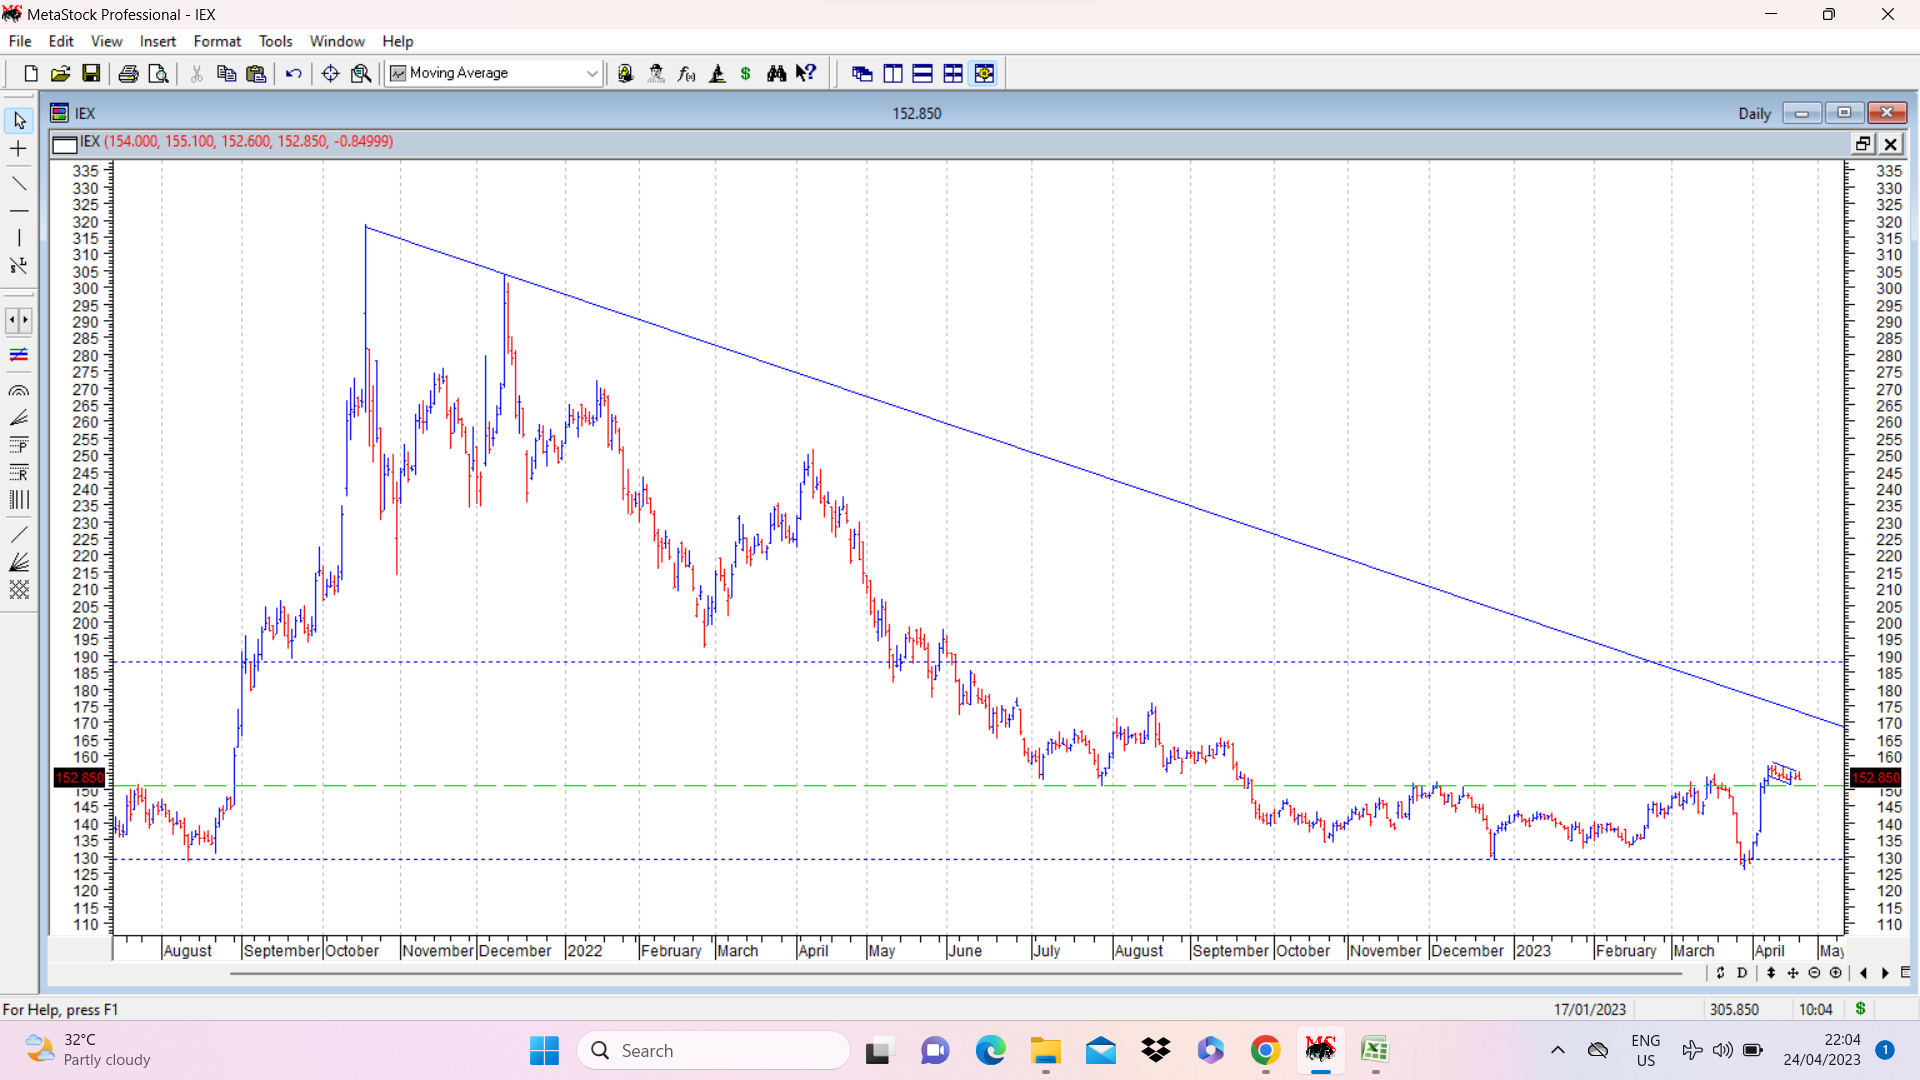
Update on IEX chart. After the weekly divergence discussed above, and a shakeout move which ended at around 126, (slightly below expected support of 129), stock price moved up quickly and went above its 200 dema and the previous strong resistance zone of 150-152 and is consolidating in a flag like pattern on daily bar chart. If this flag pattern plays out (may or may not play out) potential targets can be 186. If that happens, then stock price would cross and close above falling trendline and it would indicate a change in medium term trend. ( Usually this signifies that a buy on dips strategy should yield good results). Chart attached with small flag marked and falling trendline marked, and potential target marked in horizontal dotted line. disc: invested as a technical bet .
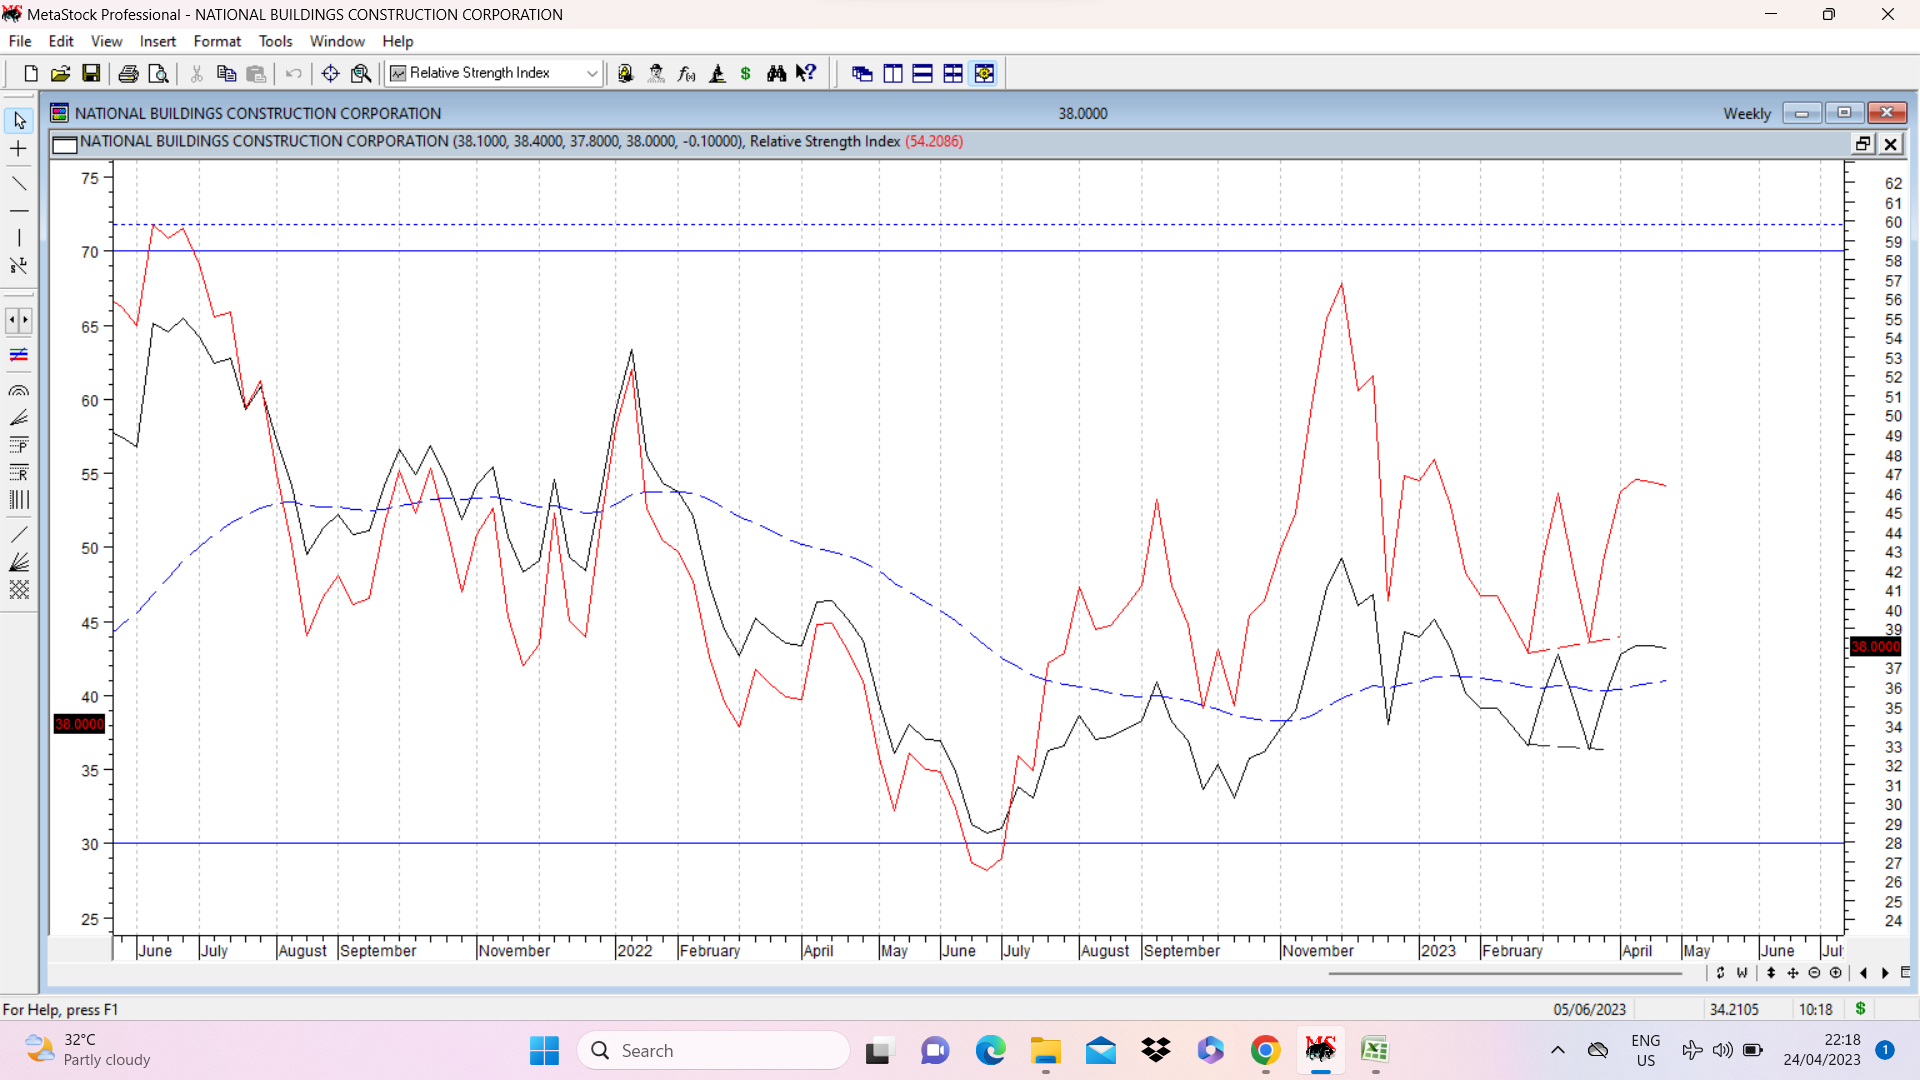
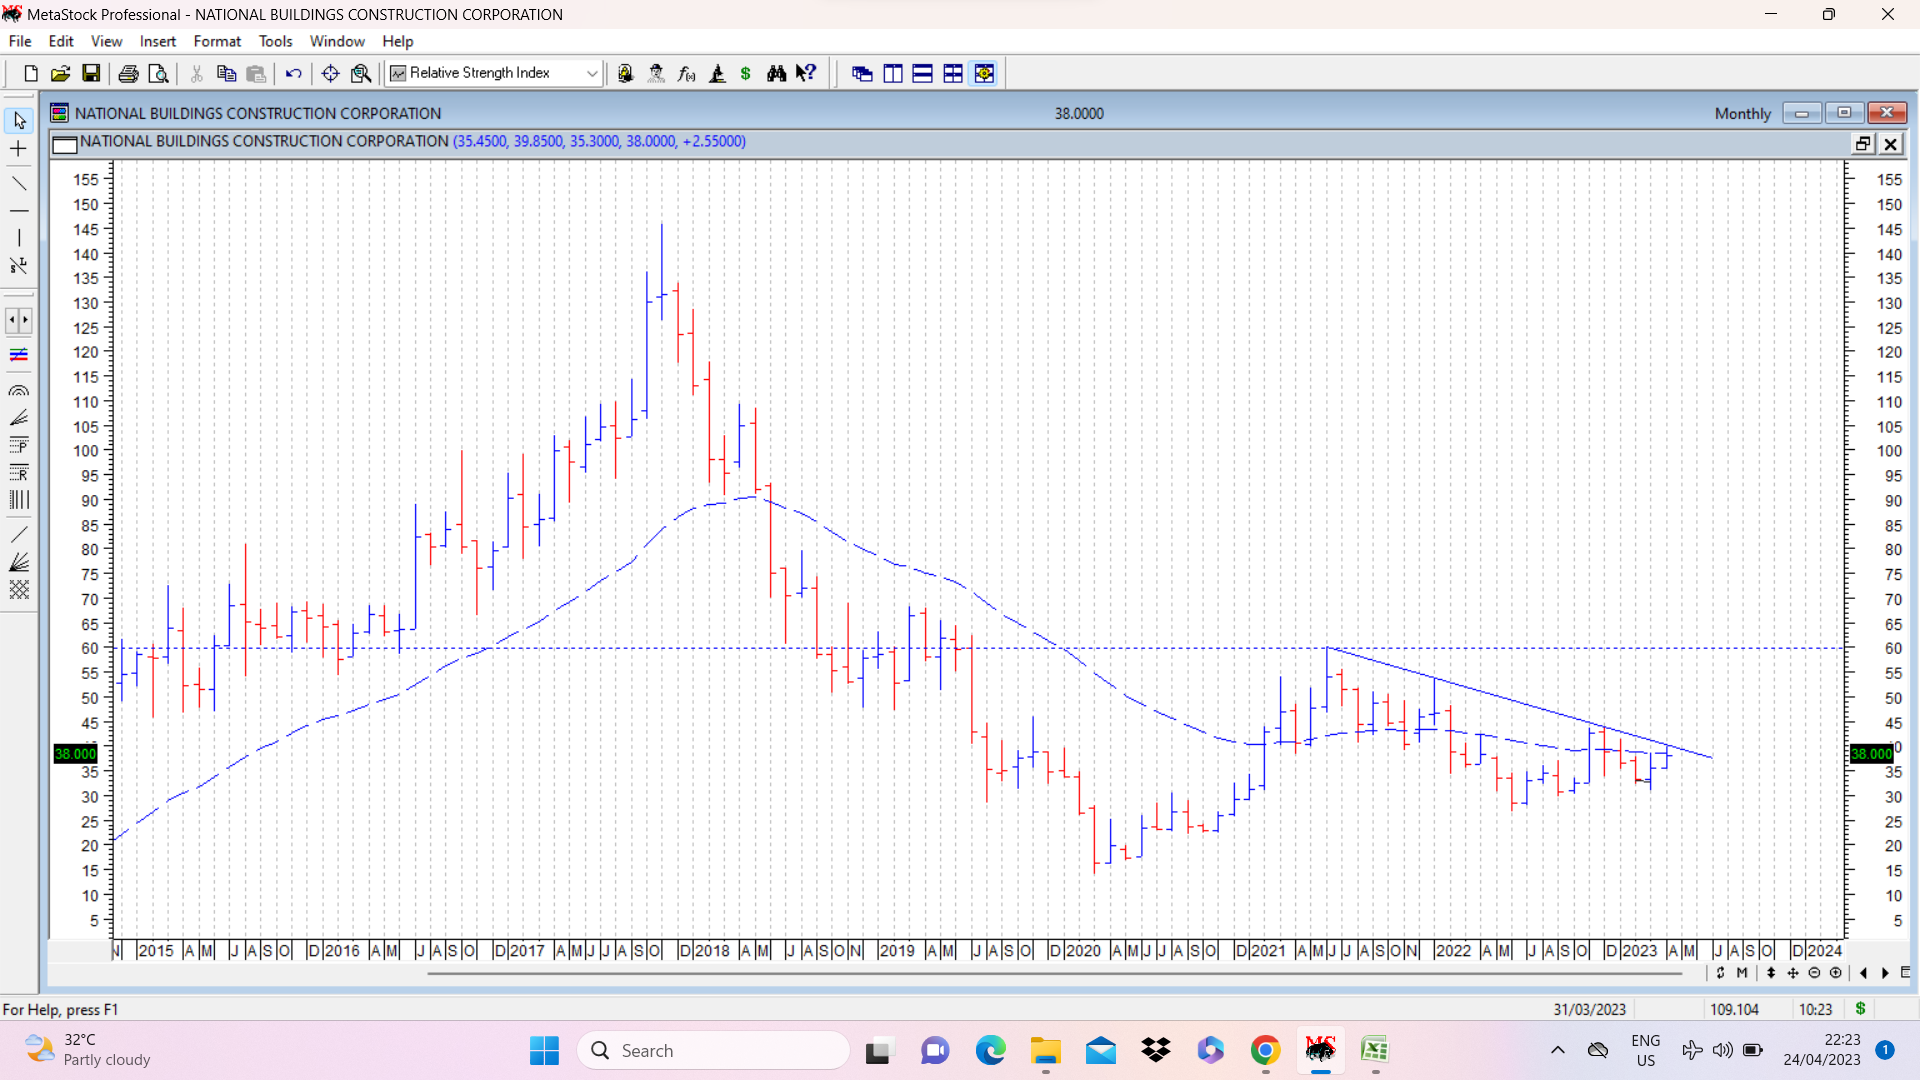
NBCC is another chart where positive divergence is visible on weekly chart. Stock price posted a lower low (shown in dotted black line joining weekly closing prices on the line chart) and RSI shows a higher low during corresponding period (marked in dotted red line) Dotted blue line shows all important 30 WEMA which after remaining flat has started moving slightly up and price continues to maintain above it.
A monthly bar chart also attached shows a falling trendline and a breakout past 40 would indicate bullish sentiments in medium term. Above that major breakout levels are around 60. disc: invested as a technical bet.
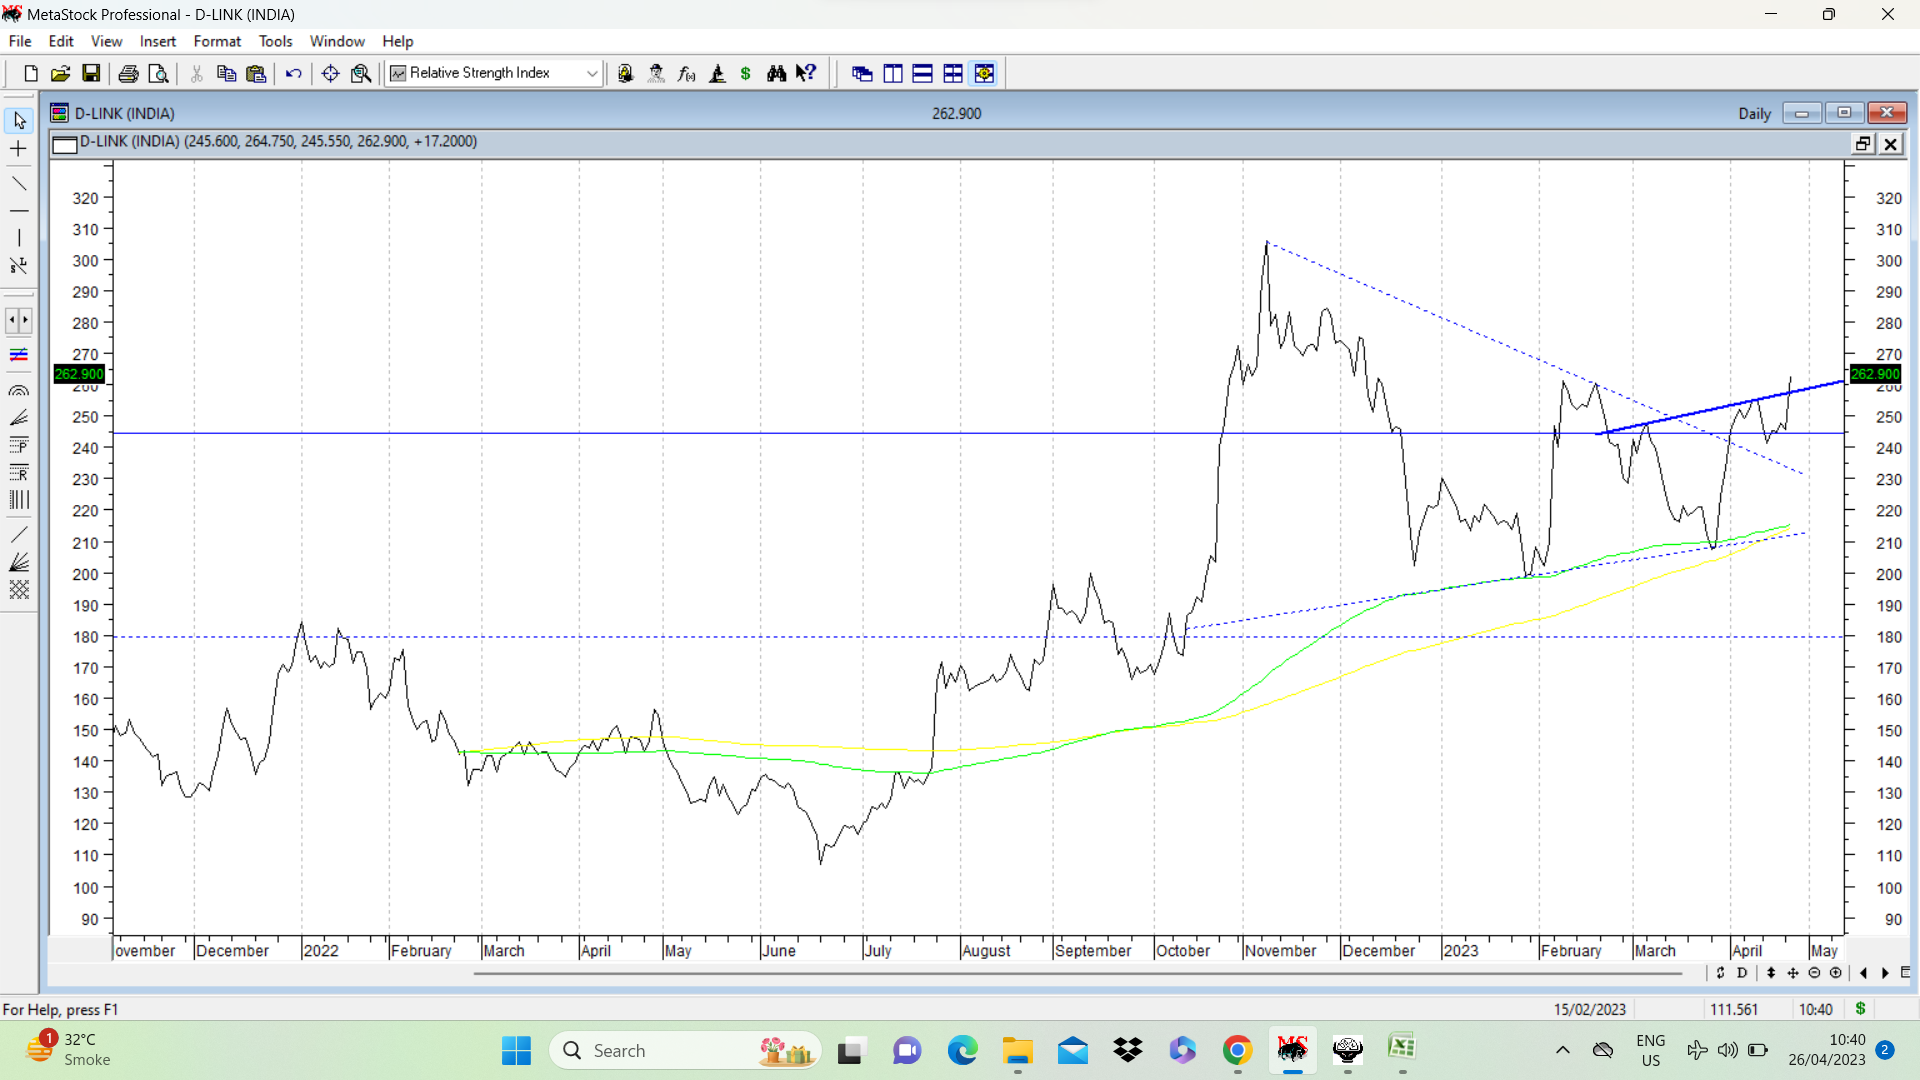
Dlink yesterday gave a strong upmove and on daily charts broke out of a small inverted head and shoulders pattern with potential targets of 305 (marked on chart with neckline in solid blue line)… The pattern targets of earlier symmetrical triangle are around 405. disc: invested.
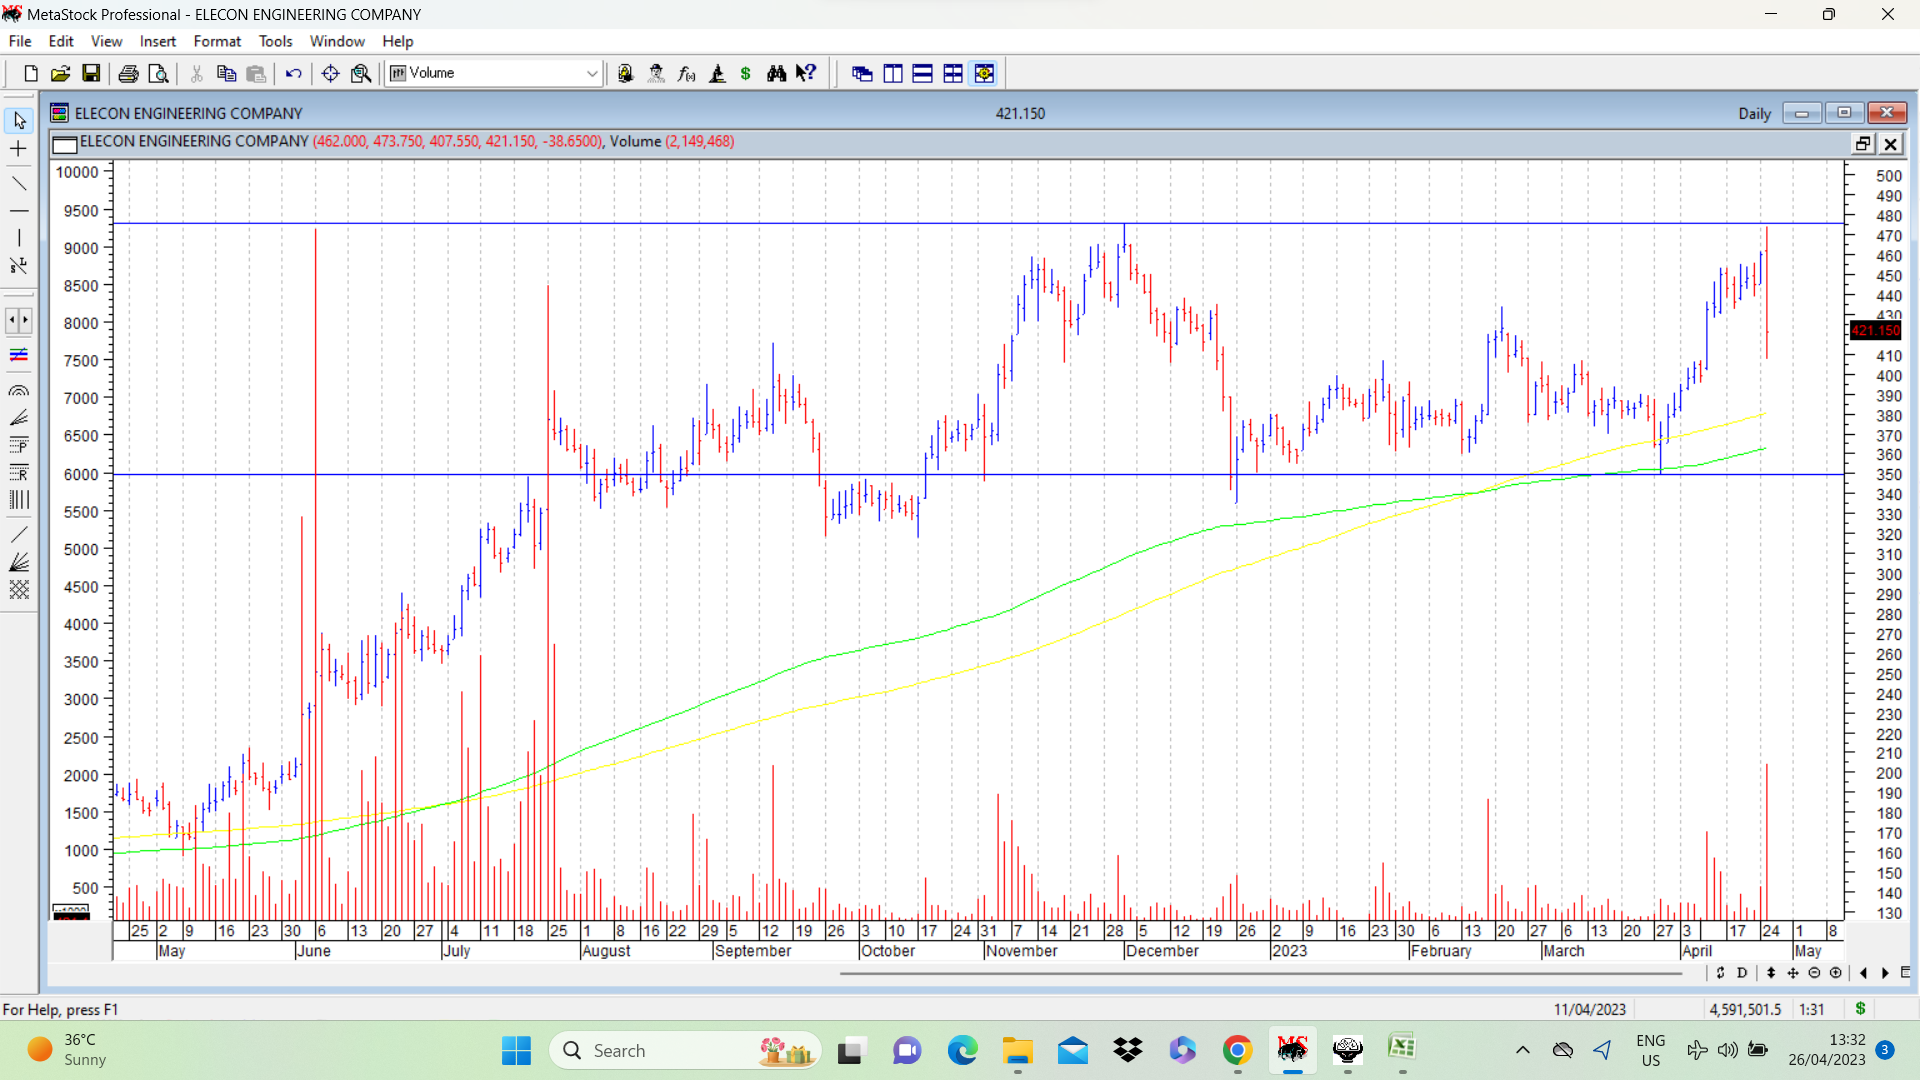
Elecon has been an outperformer over past few months… Yesterday it declared results which seemed to be reasonably decent, but was met with heavy selling and seems to have formed a double top at around 475. If stock price breaks below 350, then double top can get confirmed and things can get ugly. Till that time, its only in watchlist to see how things pan out. Disc: no position.
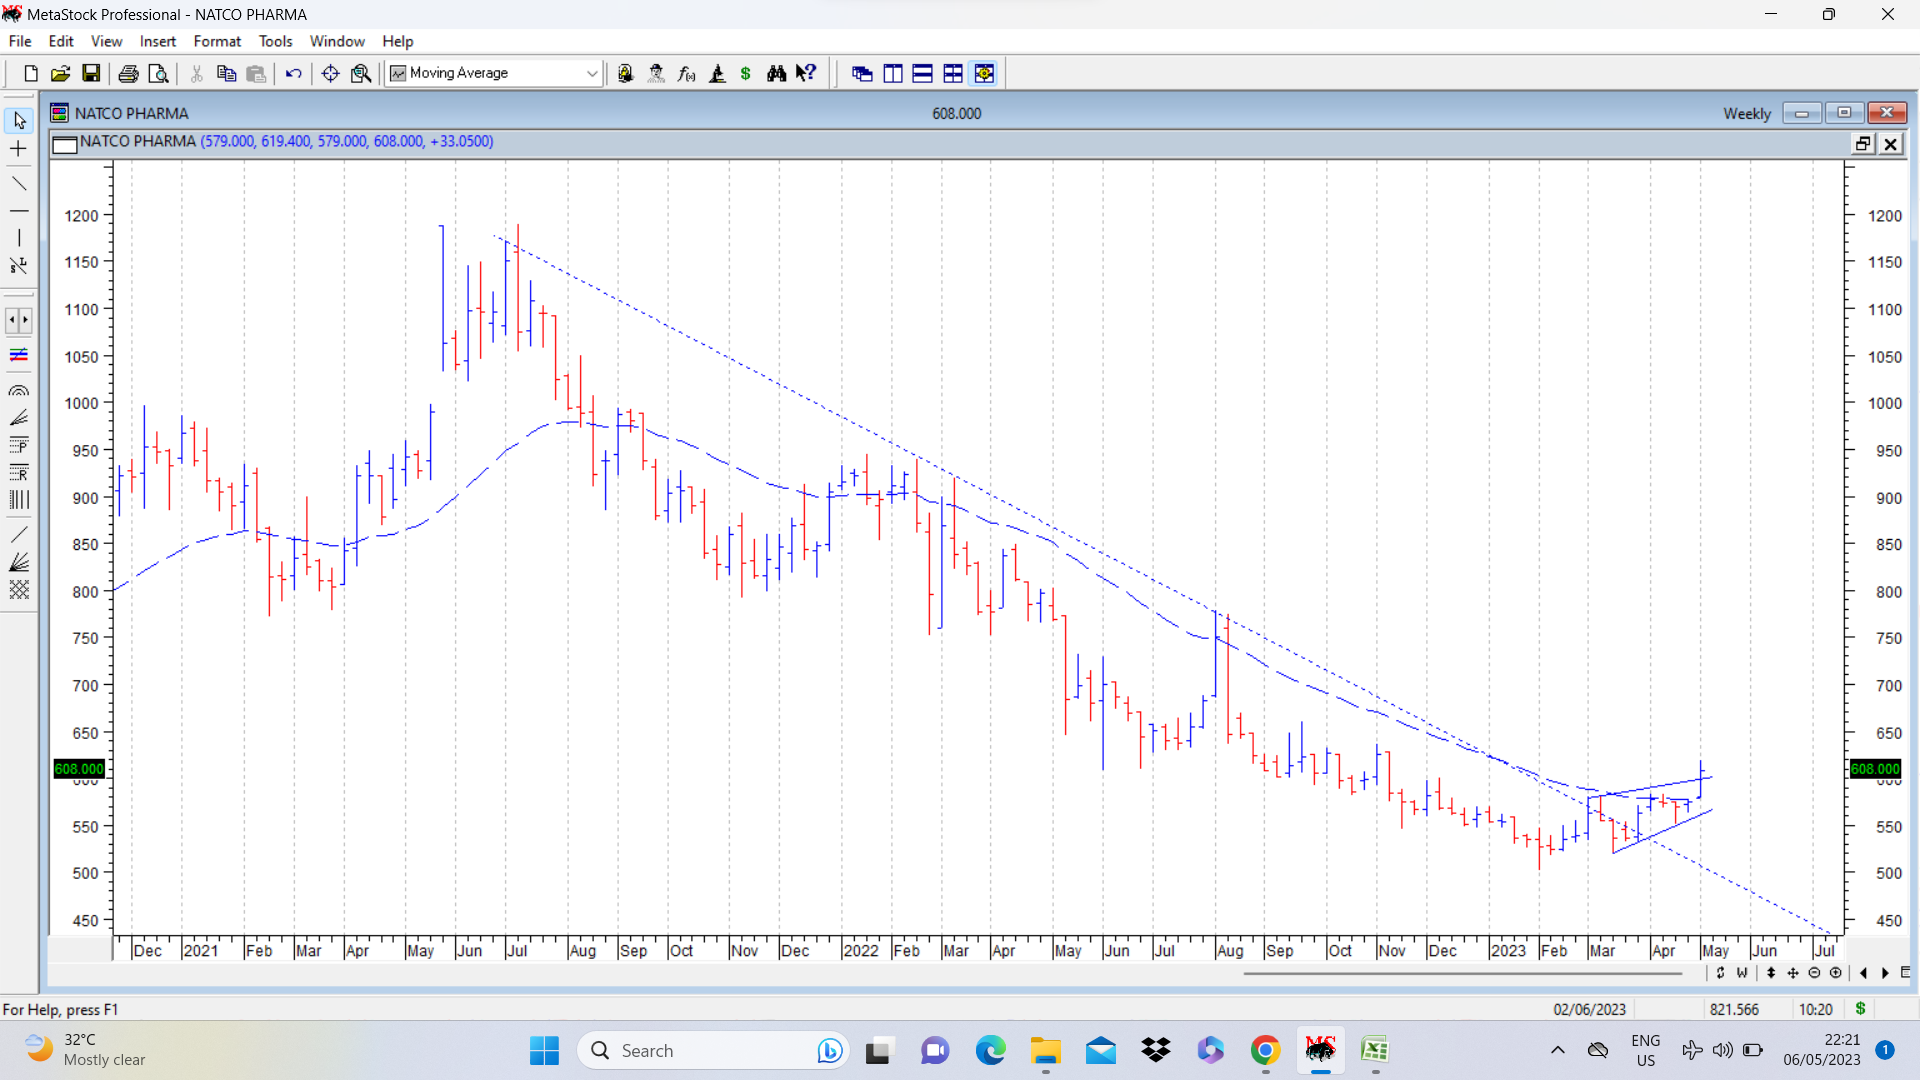
Natco pharma has been a big underperformer over the past many months. Attached chart shows GMMA… guppy multiple moving averages. Longer term moving avgs are marked in blue and shorter term moving avgs are marked in red.
Stock price seems took support at the historical support of 500-520 and is currently hovering and consolidating in the range of 550-580. On weekly chart, there has been positive divergence in past few weeks.
Fundamentally Revlimid windfall profits should start contributing to numbers over next few quarters, which could provide positive sentiments. Since it has been a big disappointment for investors, movement in stock price can be expected only once numbers are reported, or probably a few days before results…
On higher side, traditionally resistance has been in the range of 1000-1100.
disc: small token test position. Would add more if bullish formations occur.
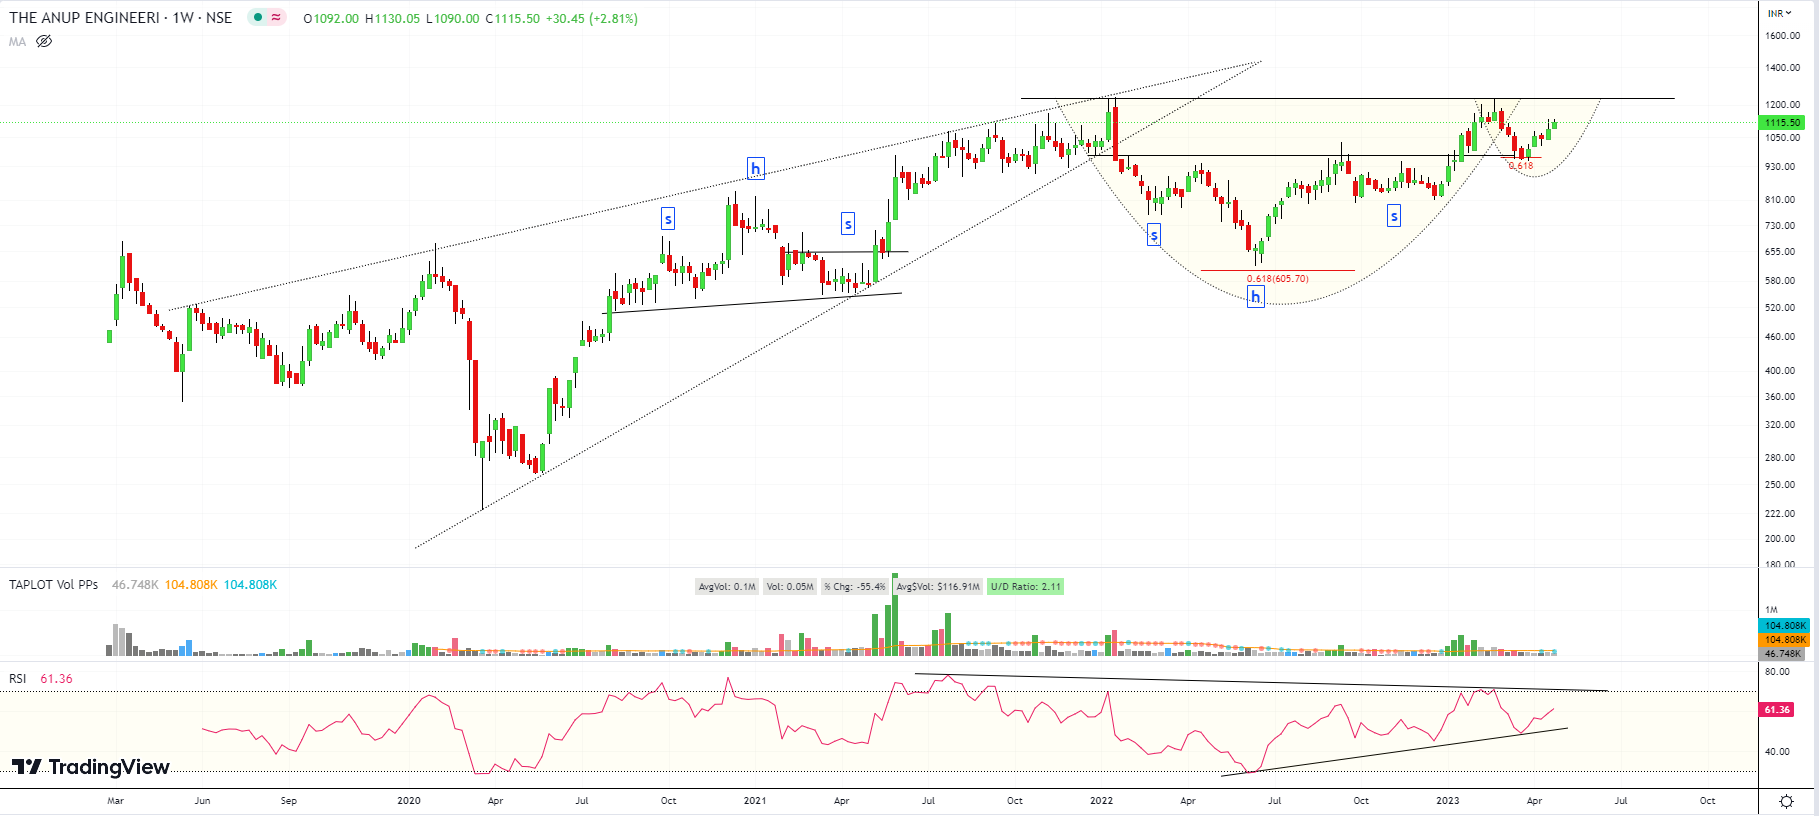
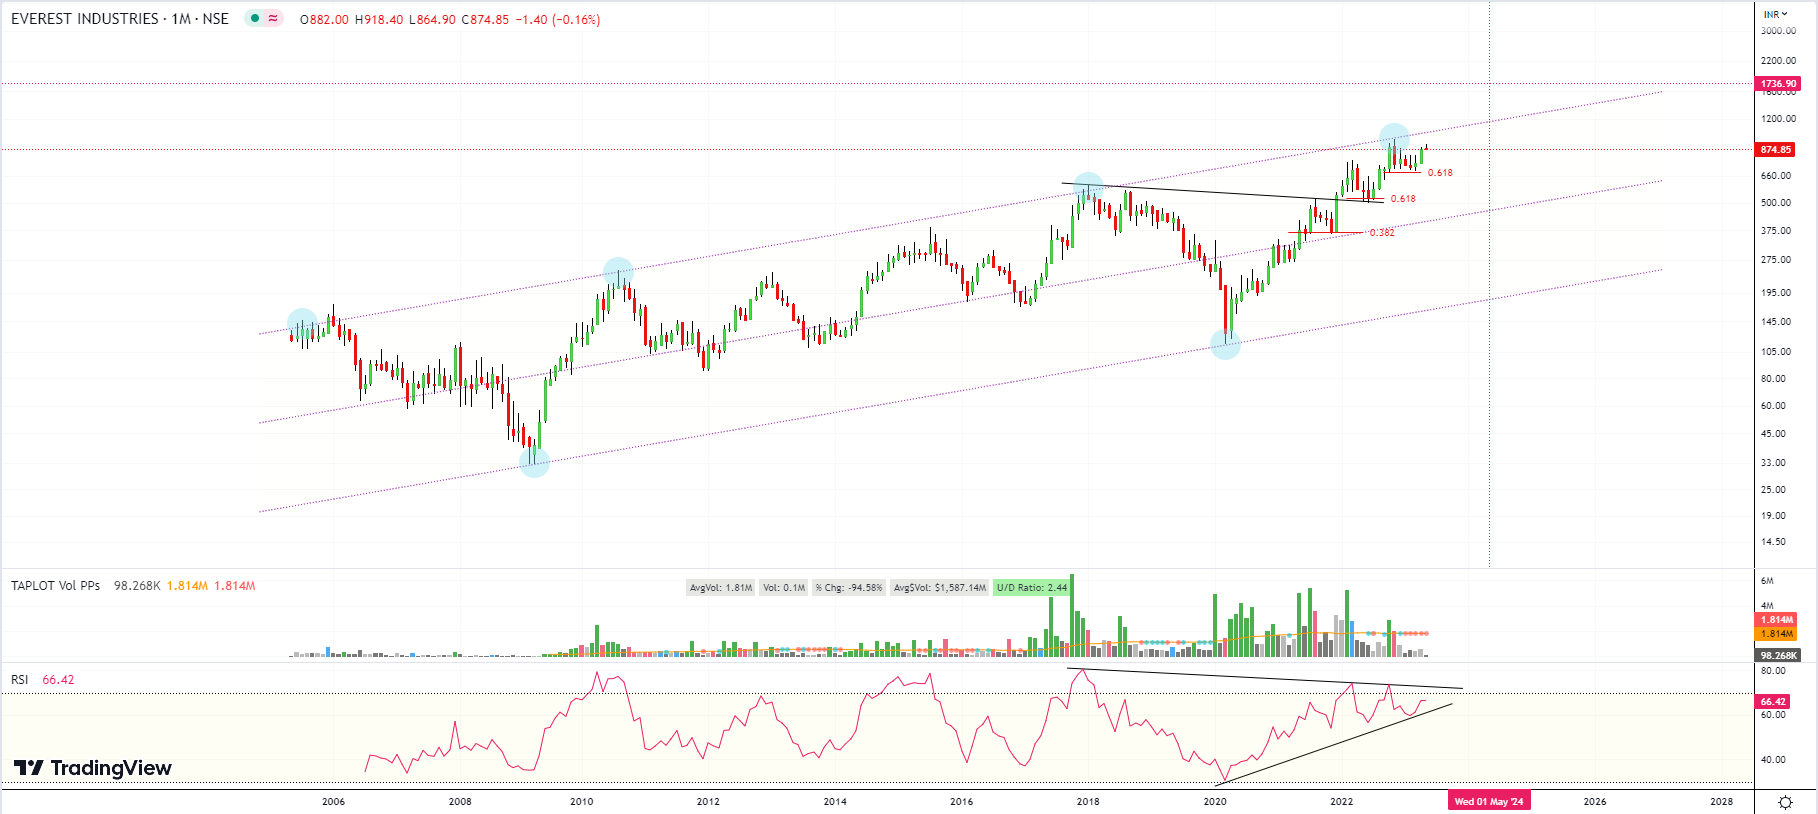
An Interesting Chart Pattern setting up is of ANUP ENGINEERING;
From 2020-21 we had a 1 year H&S formation which did not breakdown and became a bullish pattern above the right shoulder, giving a move of ~ 550 to 1230.
Post fall, the stock took support at 0.618 Fibo levels, retracing the upmove from 2020 lows.
The reversal base turned out to form an Inverse H&S Pattern breaking out and retesting.
A Cup and Handle seems to be in formation from Jan2022.
All in all, a very clean pattern based chart. Seems bullish given the current trend and chart pattern.
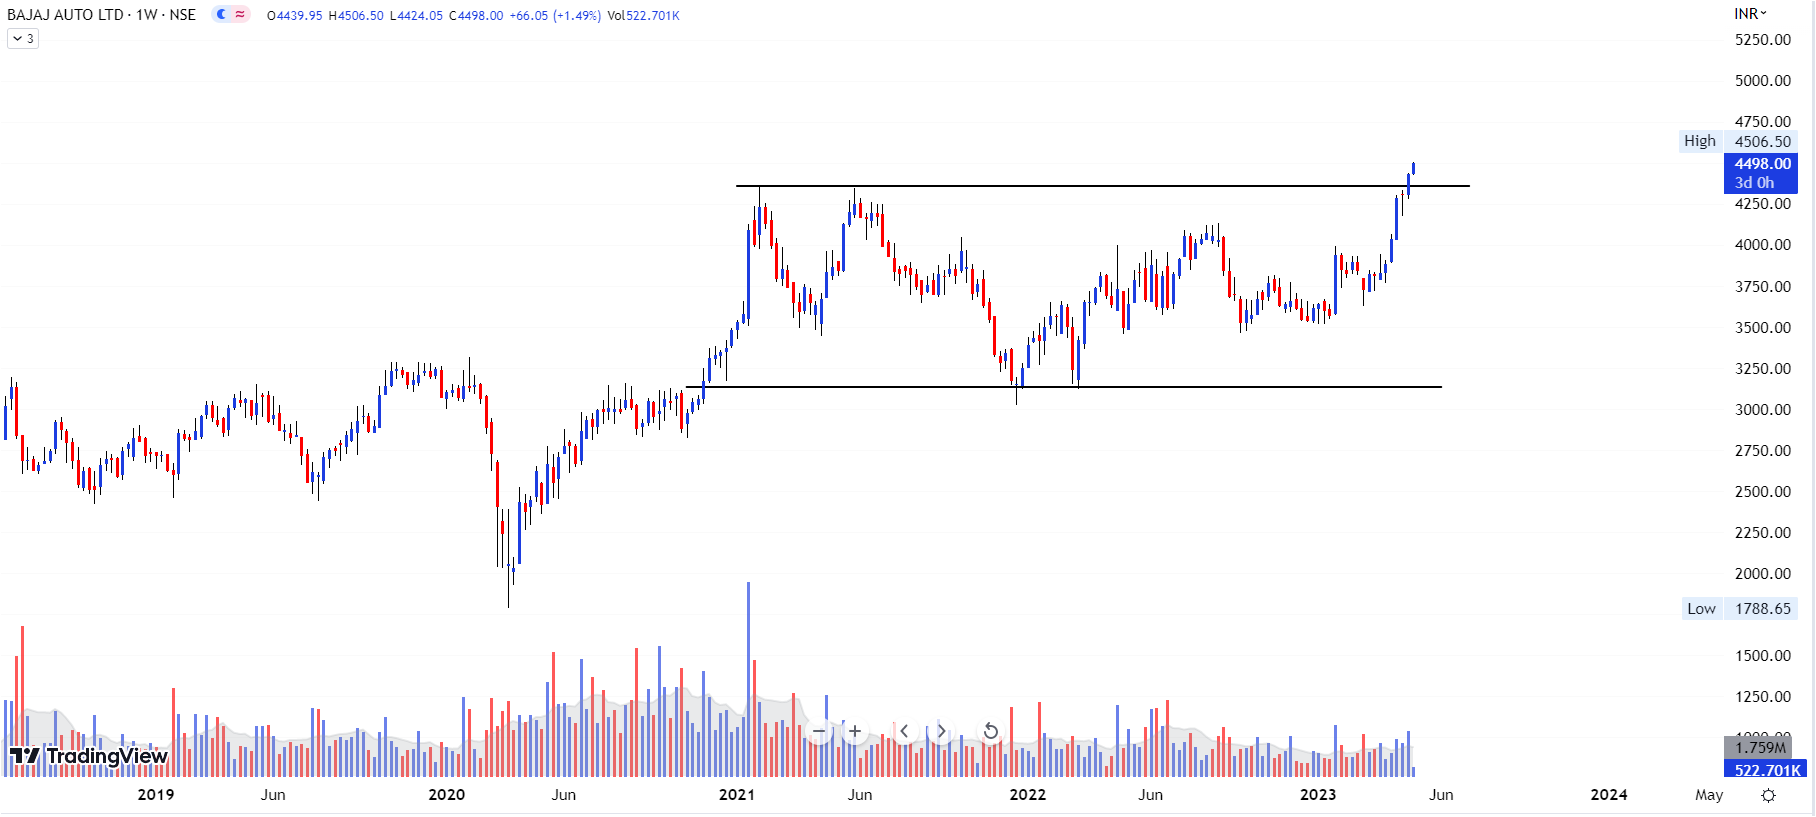
BAJAJAUTO chart break with 2 yr range… Strong volume activity form in last 1 month specially, also all auto sector in strong momentum This stock can do well in coming days If we see support at 4200 and if you find next level then based on rectangle pattern depth next level can see 5400 / 5500
Disclosure: No position as having already other auto stocks holding
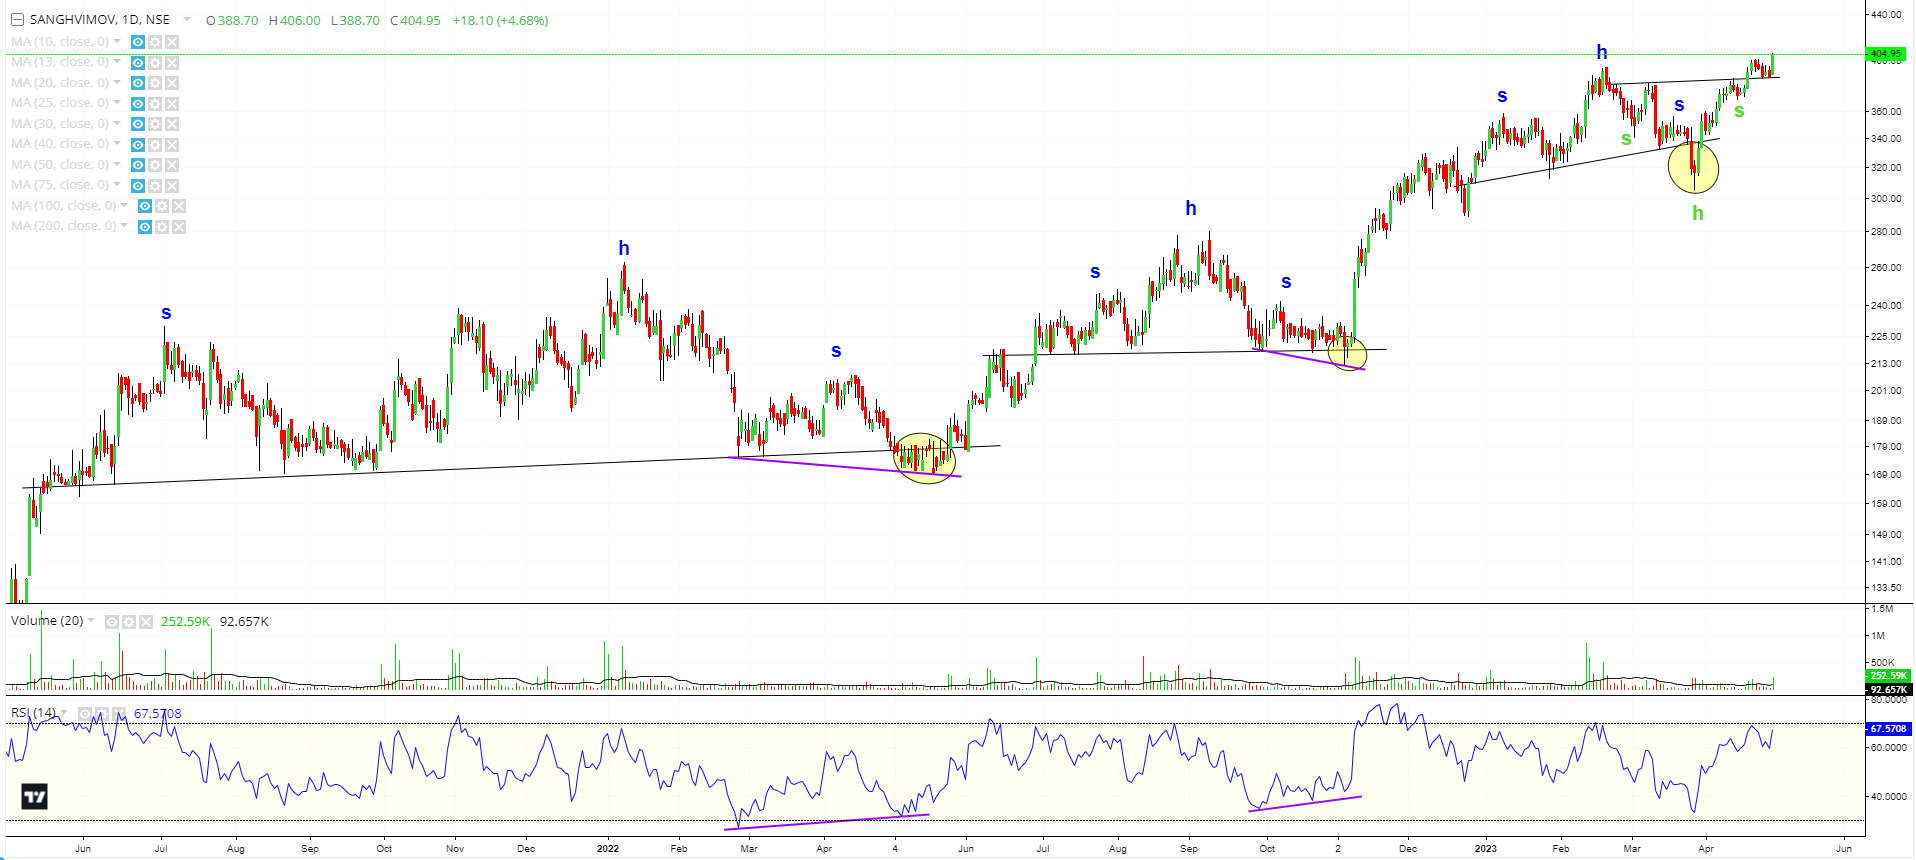
Update on the H&S reversal patterns that Sanghvi Movers made and avioded.
Current Daily Chart, one can see a H&S pattern with a shakeout has led to an Inverse H&S bullish pattern with a breakout (Green markings) and has also crossed above the right shoulder of the H&S pattern. This then led to a retest and now has given a good breakout with volumes.
Natco pharma update. In continuation of GMMA chart posted above, here is a weekly bar chart of Natco pharma. Some very very early bullish indications are:
Price move above 30 WEMA and 200 DEMA.
Breakout from a falling weekly trendline and consolidation within a triangle. And last week there was a breakout from the triangle with a bullish candlestick, with higher volumes.
As of now it seems early days for the trend in stock price and hence there can be to and fro movements before a major move comes around. (disc: invested as disclosed before. )
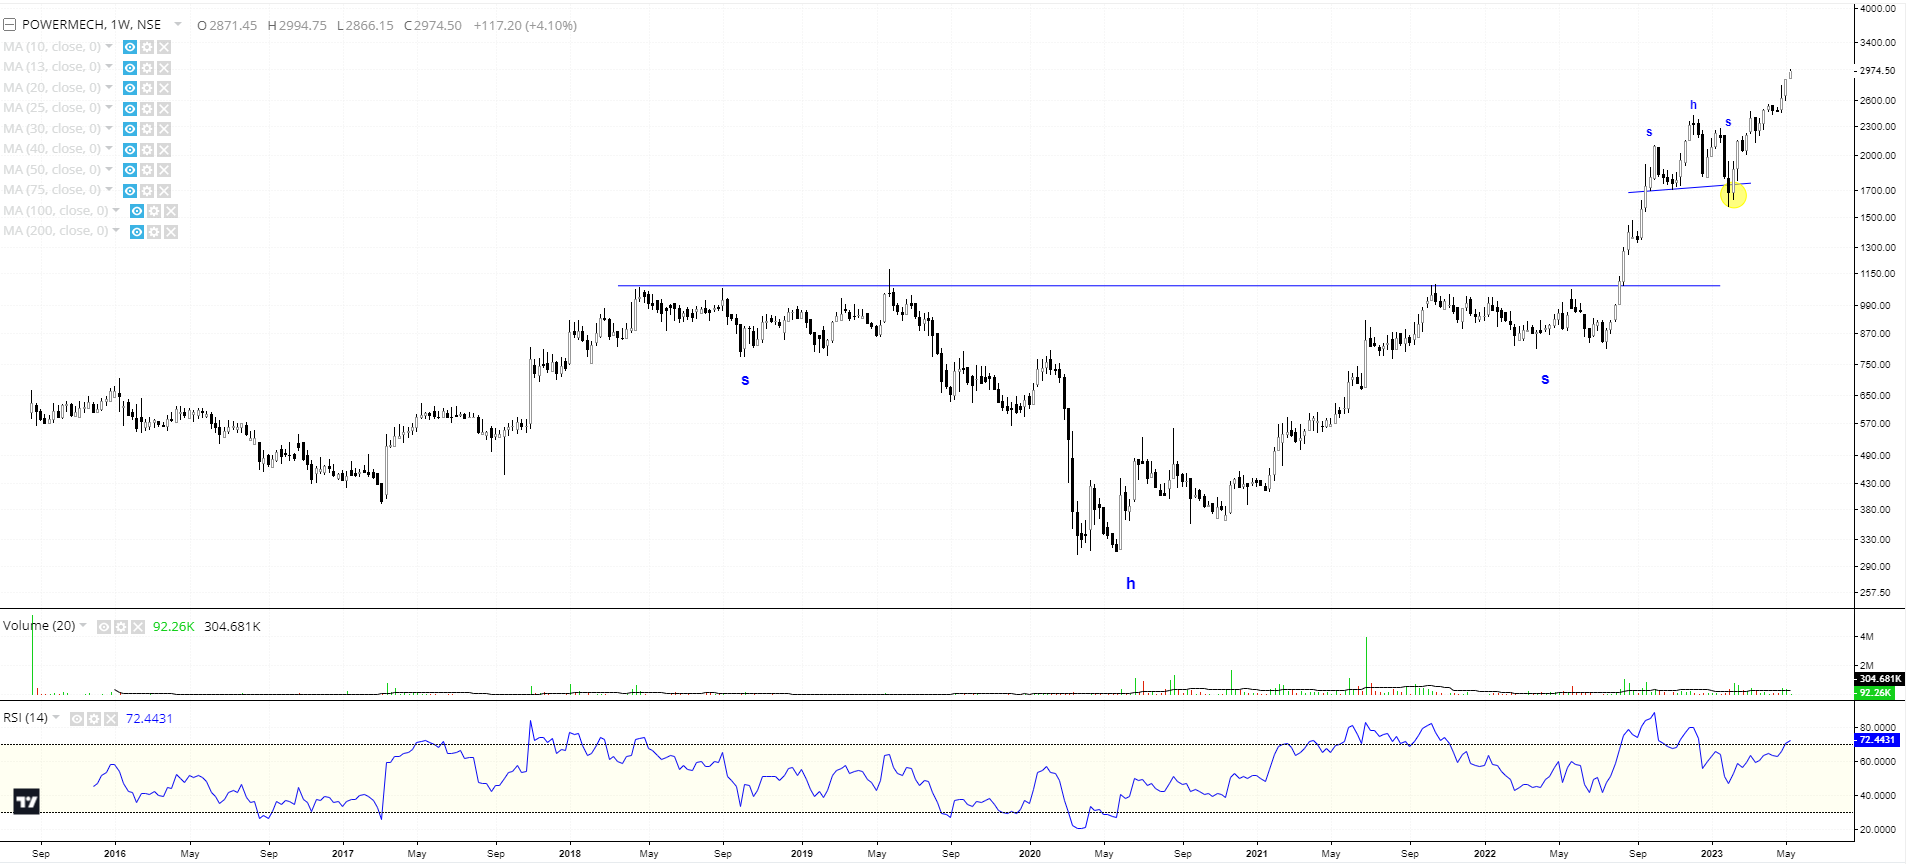
Another example how fractals work and the powerful pattern of Head and shoulder reversal pattern on display in Powermech Projects:
A multi year Inv H&S breakout, followed by a bearish H&S pattern, which gave a shakeout move and then reversed to become a bullish pattern above the right shoulder.
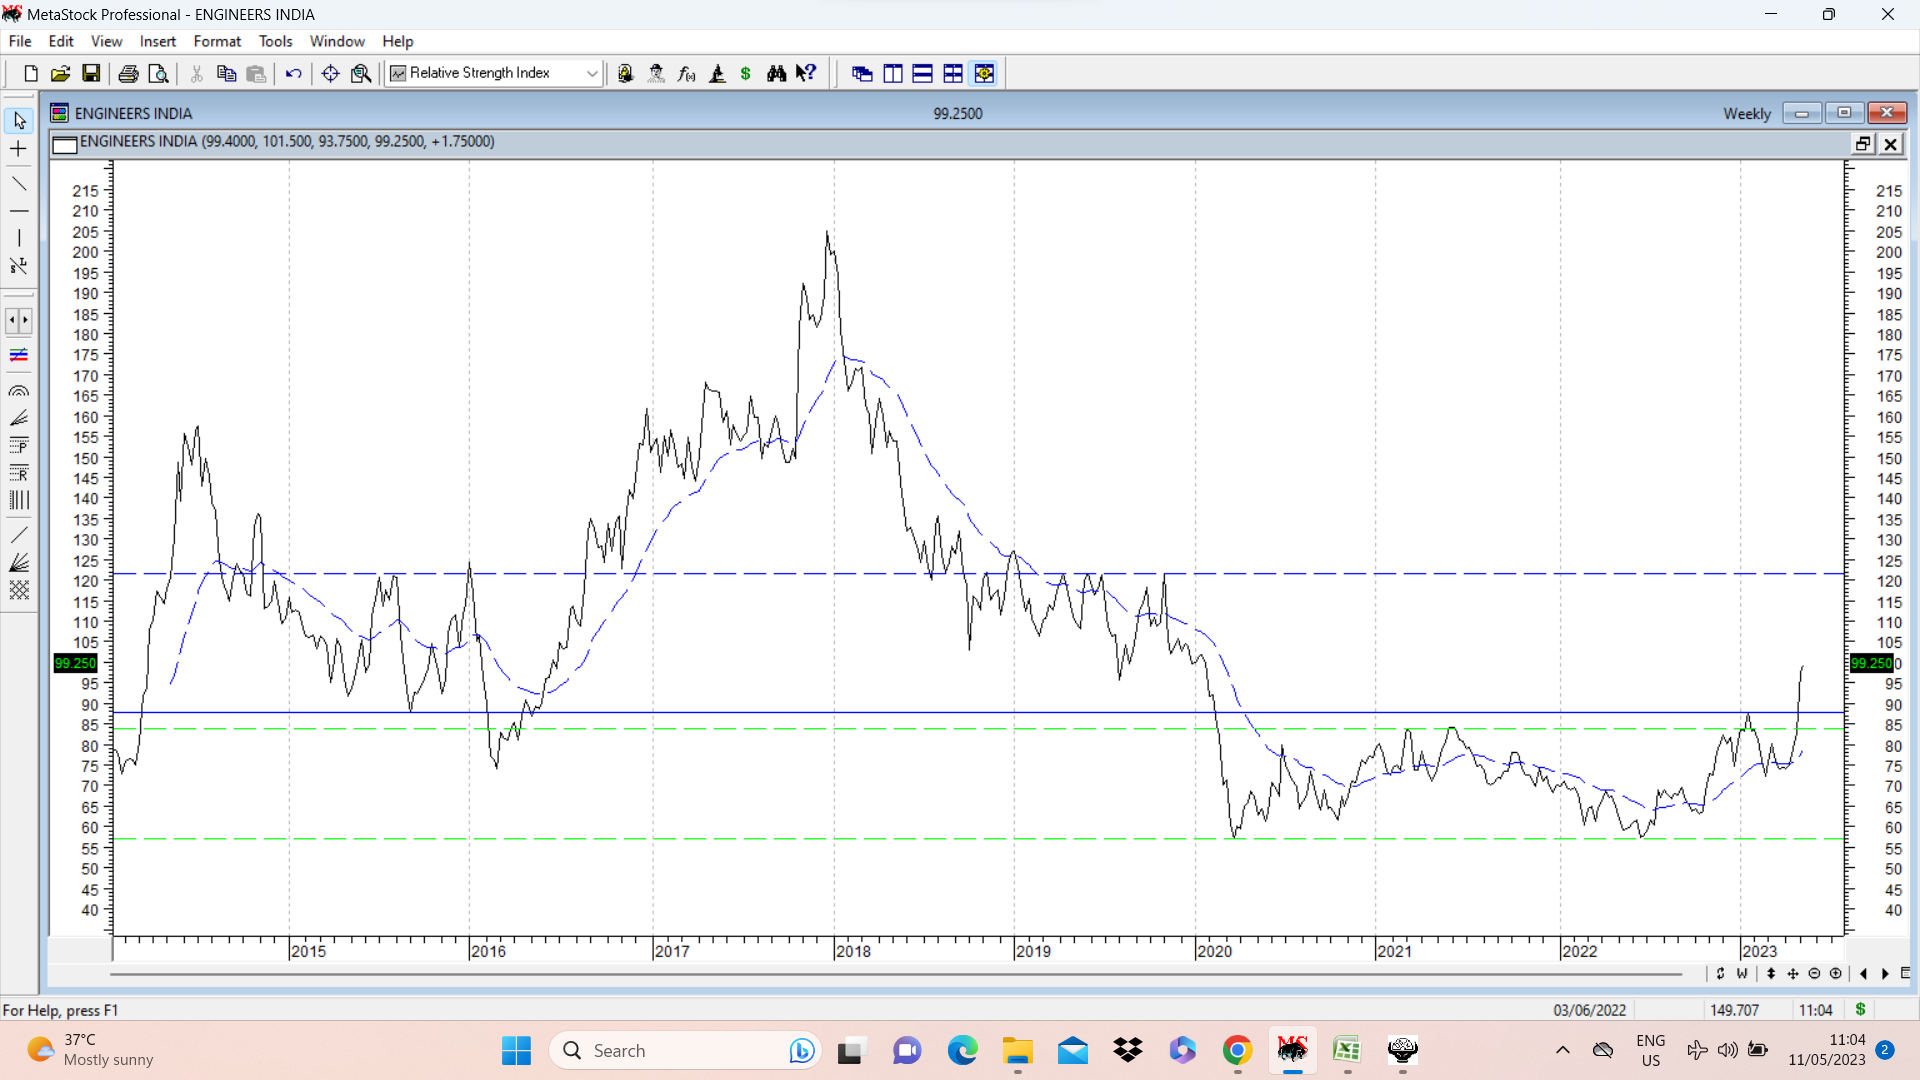
Engineers India Ltd. cmp 98-99. Recently stock price broke above a 3 year high by giving weekly close above 88. A small double bottom formation and breakout marked in dotted green lines which ranges between 57 and 84, with pattern target at 111. Next major resistance is in range of 120-125.
As a sector, PSE index seems to be showing good strength with a lot of stocks showing breakouts and retests and then again starting to move up again.
Sir,
Am trying hard to understand charts and have been following this company and this thread closely. I see the double top breakout at 475 levels. However in view of its performance over the last week and a 52 week high today, would it be reasonable to say that there was a double bottom breakout at around 350 levels in the time between the double tops?
Complete newbie to charts. Please excuse my ignorance
Continuing with the examples previously posted about Fractals,
This example is of Heritage Foods, seems to be forming a multi year fractal on (Monthly) charts.
2007-2012, one can see bottoming out at Channel Bottom, a slant breakout post reversal from Fib 0.618 levels, RSI formed a symmetrical triangle and broke out as well, which led to a multi year bull run to go ahead and touch the channel top.
2018-2023, current setup, similar bottoming out is seen at Channel Bottom, Fibo reversal from 0.618-0.786 and a minor slant trendline breakout. RSI also again seems to be on verge of a symmetrical triangle breakout, ( Bigger slant trendline still setting up).
Which the fractal move repeats, and trendline breaks, a bull run could follow in the stock, possibly touching channel top once again.
Fractals are not similar patterns playing out at different times. They are the same or similar patterns playing out at the same time over different timeframes.
For example, there may be a cup & handle pattern in daily as well as monthly charts.
Continuing with the examples given above of H&S reversal patterns, the one i want to highlight, that is setting up nicely is of EXIDE Industries: - Monthly Chart:
A Multi year H&S pattern has been forming since May-2014.
This 9 year pattern looks to be reversing, and would possibly turn very bullish once the reversal is confirmed, which is above the Right Shoulder high.