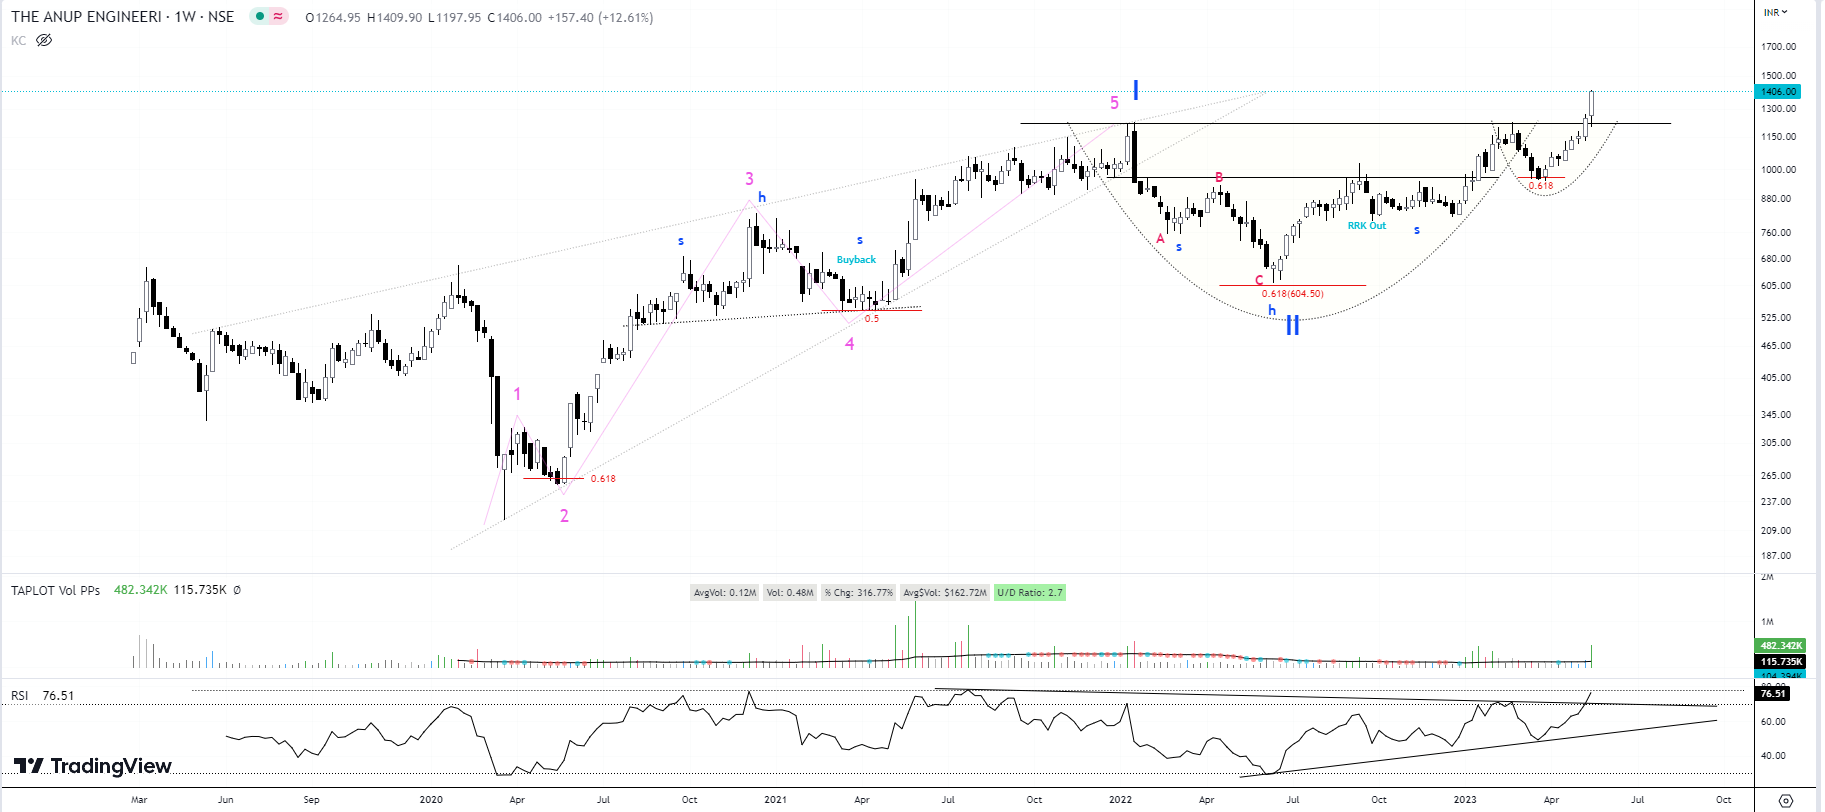
Continuing with the examples of multiple patterns in 1 timeframe, is of Anup Engineering:
The powerful H&S reversal pattern played out at around 600 levels in 2021-22. This was also formed at the back of a buyback happening. This led to a move from 600odd levels to new highs of 1236.
A nice Inverse H&S pattern formed post correction with the Head being held at Fibo levels of 0.618. again around 600 odd levels.
The Inverse H&S breaks out and retests. This retest forms a cup for a bigger Cup & Handle pattern.
Currently the stock has broken out of the Cup & Handle pattern and making new ATH around 1400.
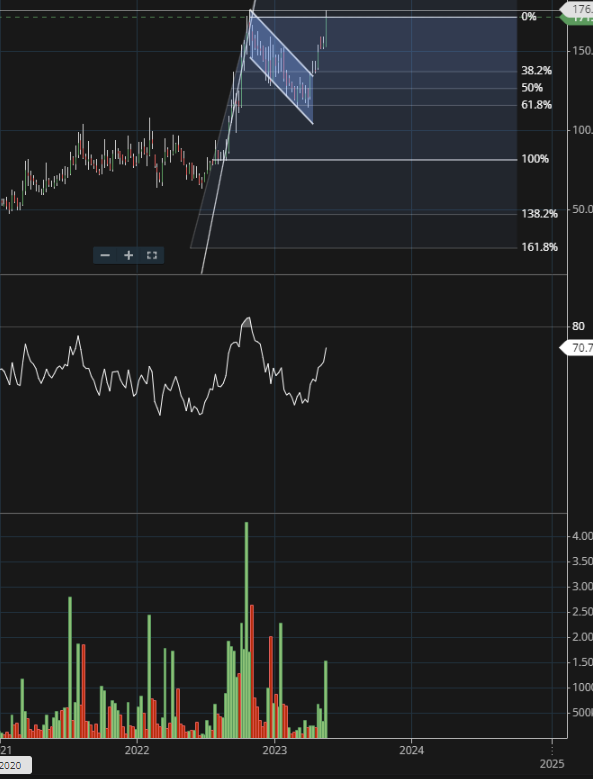
Chart attached for Kuantum papers. @hitesh2710 please suggest if my inference here is correct.
Chart shows pole and flag formation, flag dropping till 61.8% of last rally.
Stock price is near ATH levels with increasing volume and positive RSI.
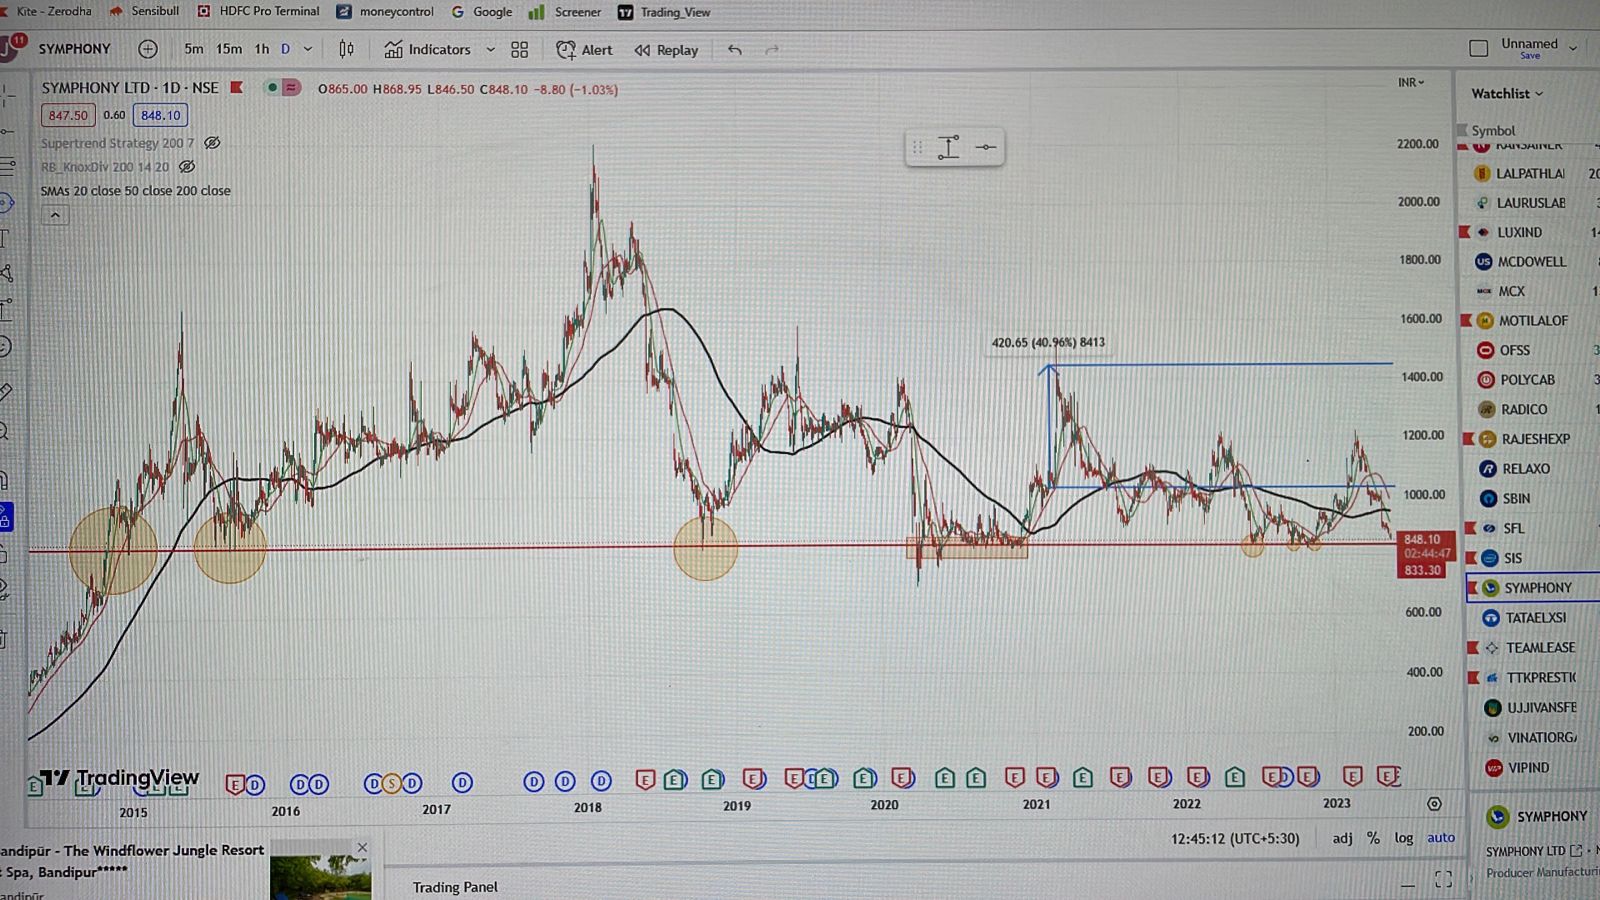
symphony stock is close to its 52W lows and has taken support at the levels of 830 multiple times since 2015. Assuming the fact that this quarter (Summer season) should do more sales than the previous quarter. would it be a good short term (3 months) trade?
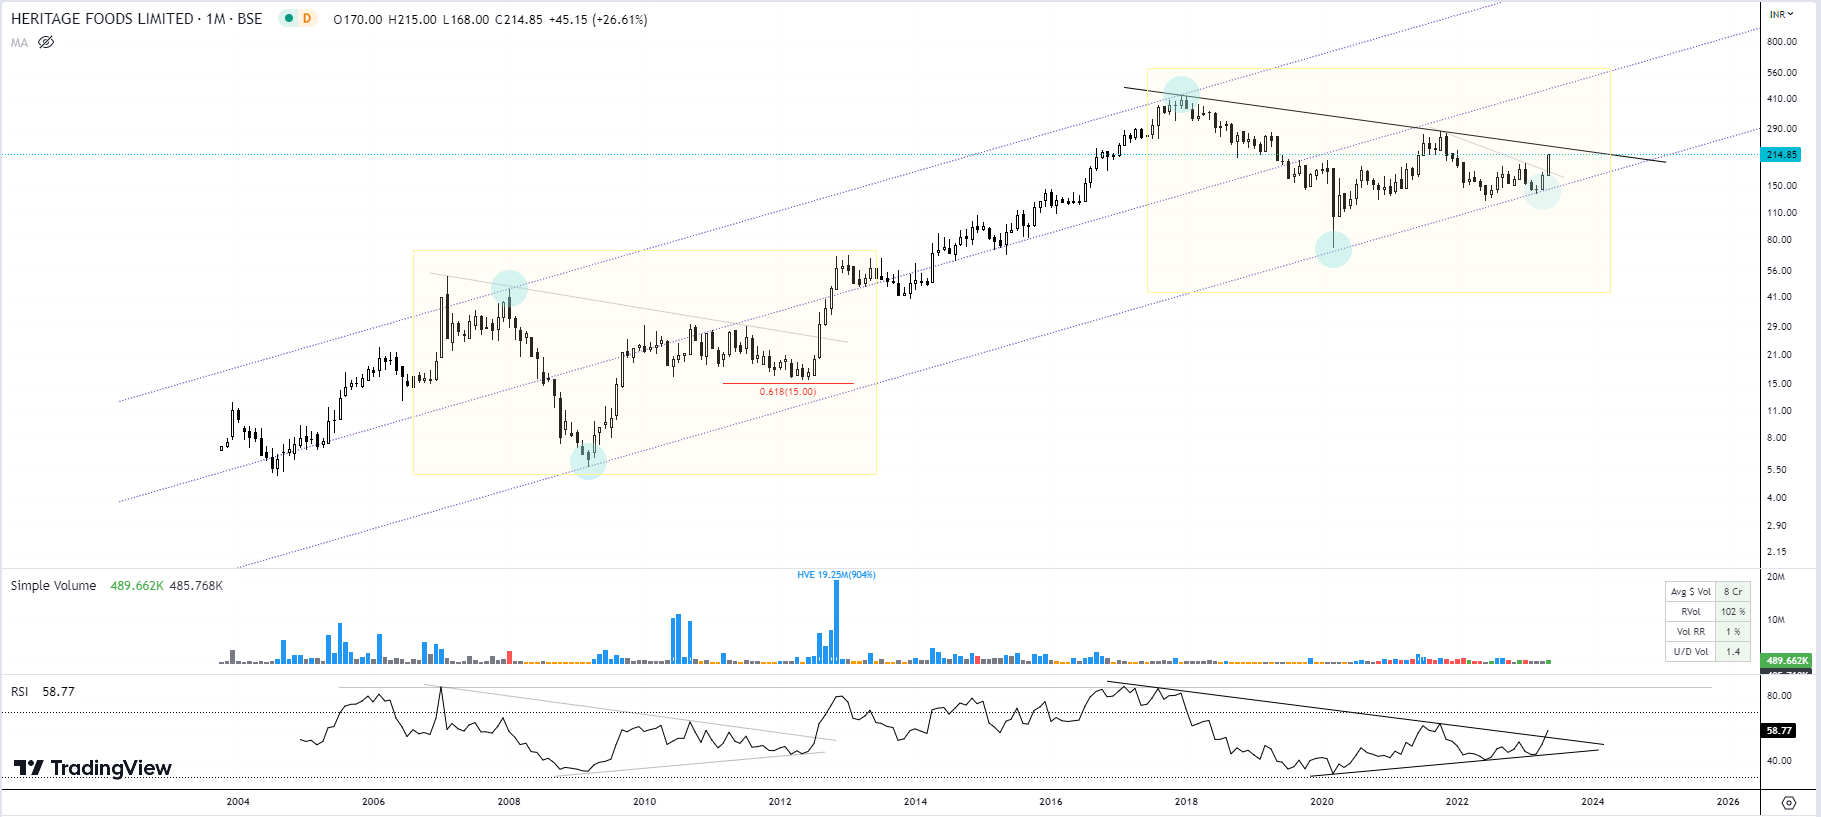
Continuing with the examples given of Channel movements, 1 of them, Heritage Foods, seems to be reversing from channel bottom and possibly forming a LT trend change. A quick move from 150 odd to 215…
RSI has broken out on monthly chart,
Channel bottom has been respected and upmove from there followed.
Patterns very similar to previous breakout from 2007-2012.
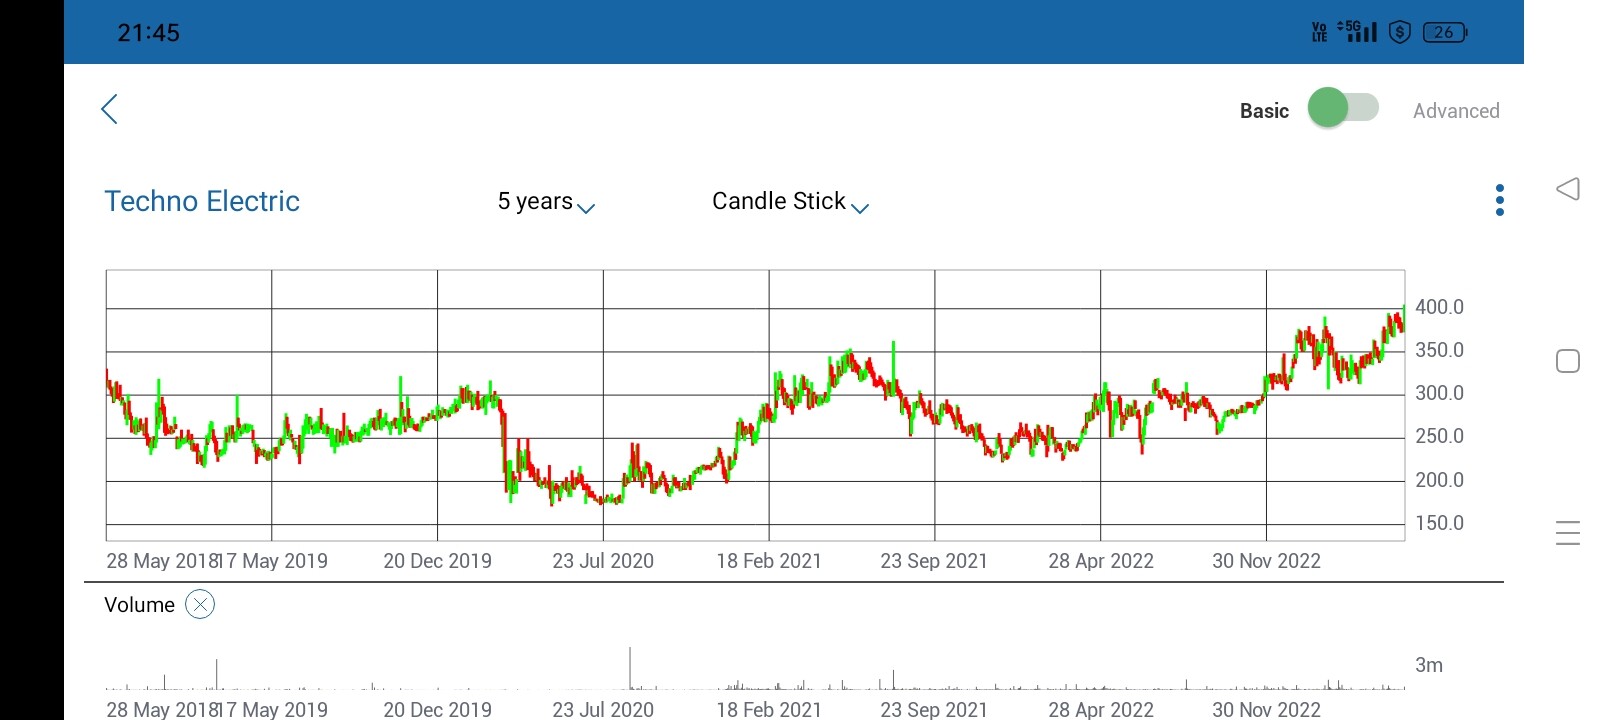
Techno electric has hit multi year high today. The chart shows upward slanting cup and handle pattern starting from jun 21. The target range would be 460-485
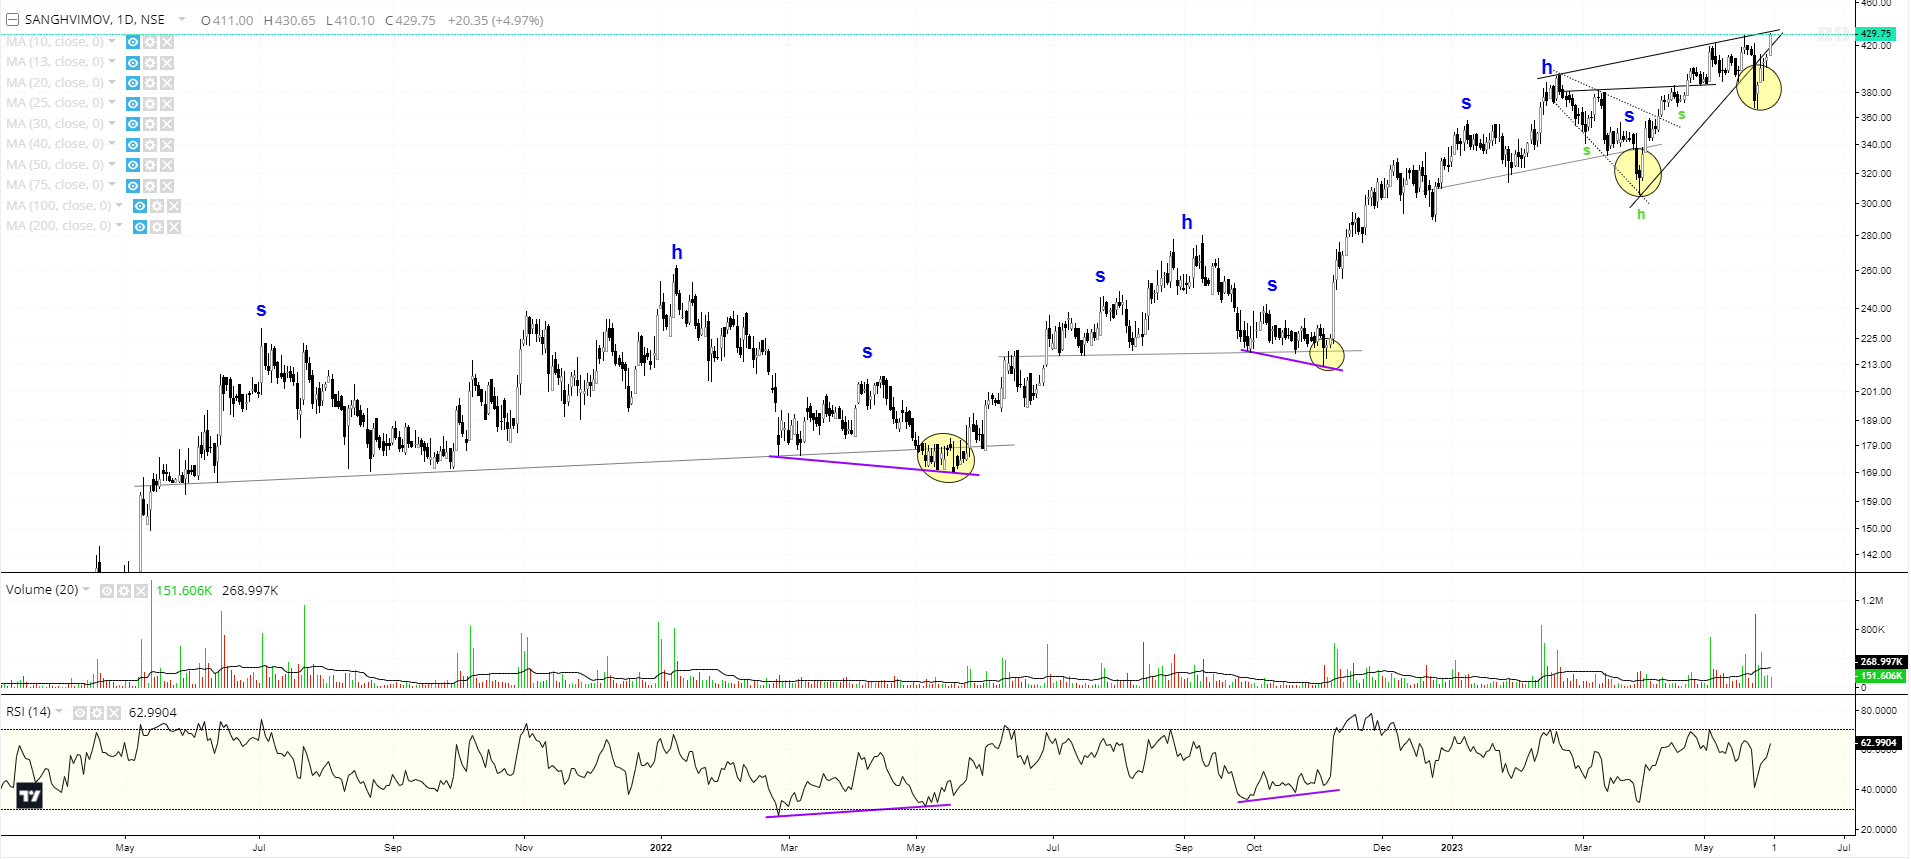
-Story of Shakeouts continue in Sanghvi Movers the current one being from a breakdown of the Ascending Wedge pattern (post result candle), and then subsequent recovery. (yellow regions marked as shakeout zones).
Previous 3 occasions have been shakeouts from H&S breakouts, which have led tp further up moves.
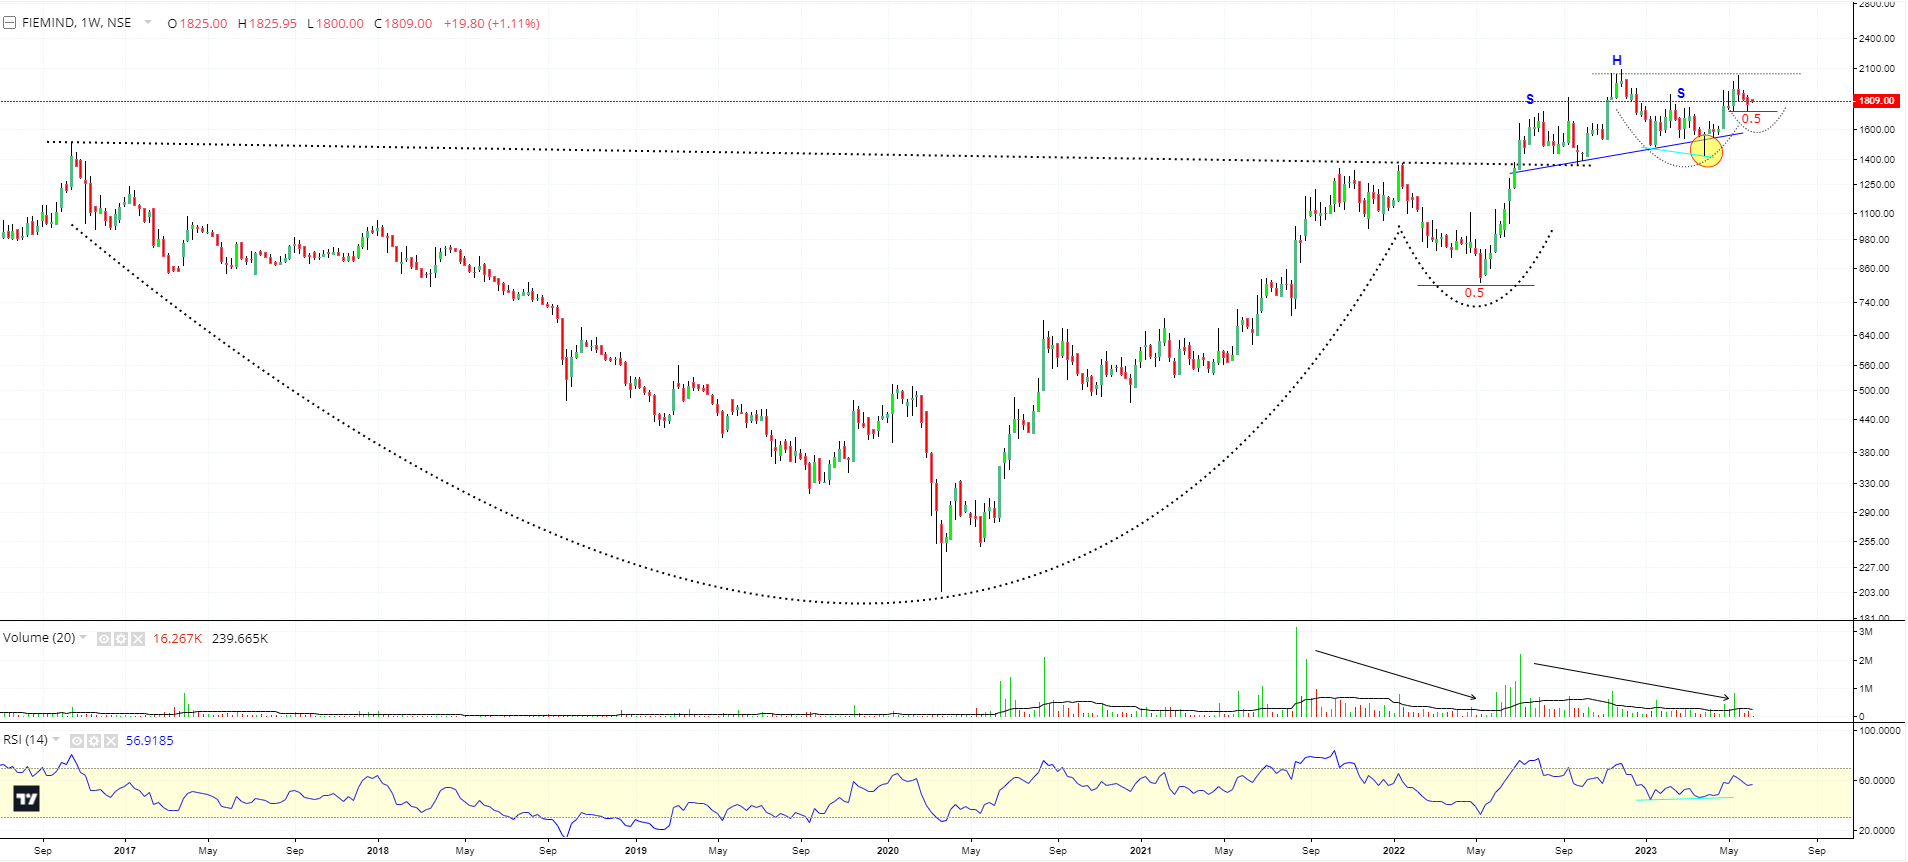
Identifying correlation between TVS Motors and Fiem Inds worked well, Fiem moving from 1570 odd to 1800+.
Wanted to highlight multiple patterns at play currently in Fiem Inds (Weekly Chart), which are helping it setup for a nice longer term upmove.
Fiem broke out of a Bullish Multi year Cup n Handle pattern (2016-2022) in July 2022. The Handle took support at 0.5 Fibo levels.
It then formed a Bearish Head & shoulder pattern. However it gave a Shakeout move (yellow circle) and reversed, turning into a Bullish setup above the Right Shoulder.
One can see a Positive RSI divergence as well (light blue trendline), mostly indicating a failure of the H&S pattern.
This reversal has led it to possibly form a Cup and Handle pattern from Nov 2022, with the Handle again taking support at 0.5 Fibo levels ( and retesting the Right shoulder).
One should also notice the drop in volumes when the stock has retraced while forming both Handles.
Good times possibly lie ahead for the stock, assuming its factoring in all the bad news around the 2W industry.
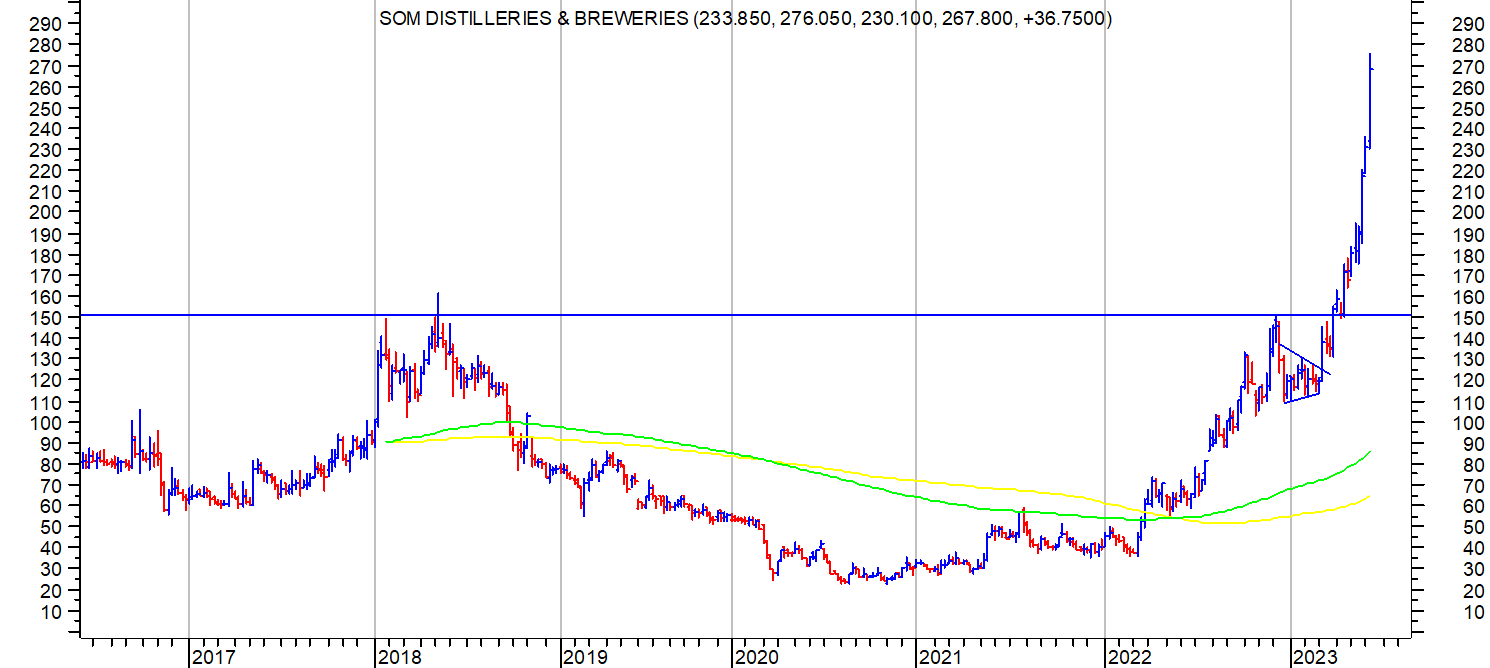
Som distilleries achieved its technical target of 270 this week. Stock price has had a strong upmove since its breakout above 150 and has moved nearly 80% within a period of 2 months. Currently hovering around 260-270 region. I have trimmed down some position in view of the near parabolic move. In this kind of moves its difficult to predict exact top, so the approach remains to combine technicals with fundamentals. In fundamentals I try to put up best case numbers for next year or two and see if material upsides are still left in the stock, otherwise I trim or exit the position.
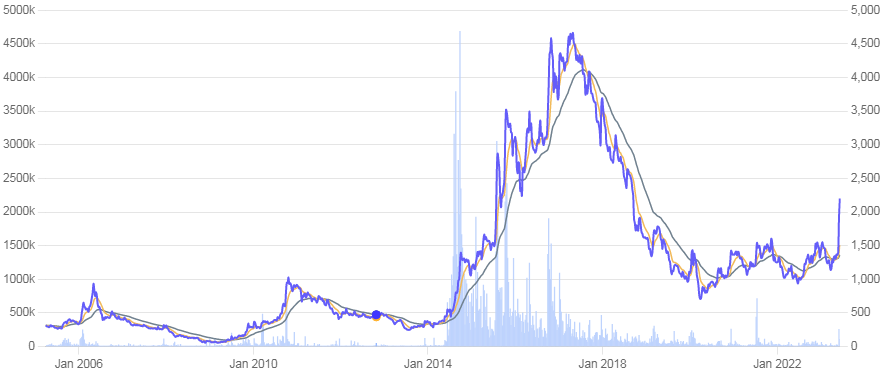
@hitesh2710 Sir, Your view on Force Motors, the stock has broken out from multi year resitence level and still 50% away from all time high. Fundamentally also there is turn around in Quarterly performance and consistently improvent on Month on Month basis in production & sales data for both domestic as well as Export.
Force motors has broken out of important resistance zone around 1400-1500 and raced straight to levels of 2200. Usually once a stock breaks out past important resistance, after the initial sharp run up, it often takes a pause and retraces some of its gains. These pauses are good places to get into the stock if you are convinced about the fundamentals of the company. I don’t track it too closely now, but overall it looks like a good risk reward opportunity if accumulated at opportune times.
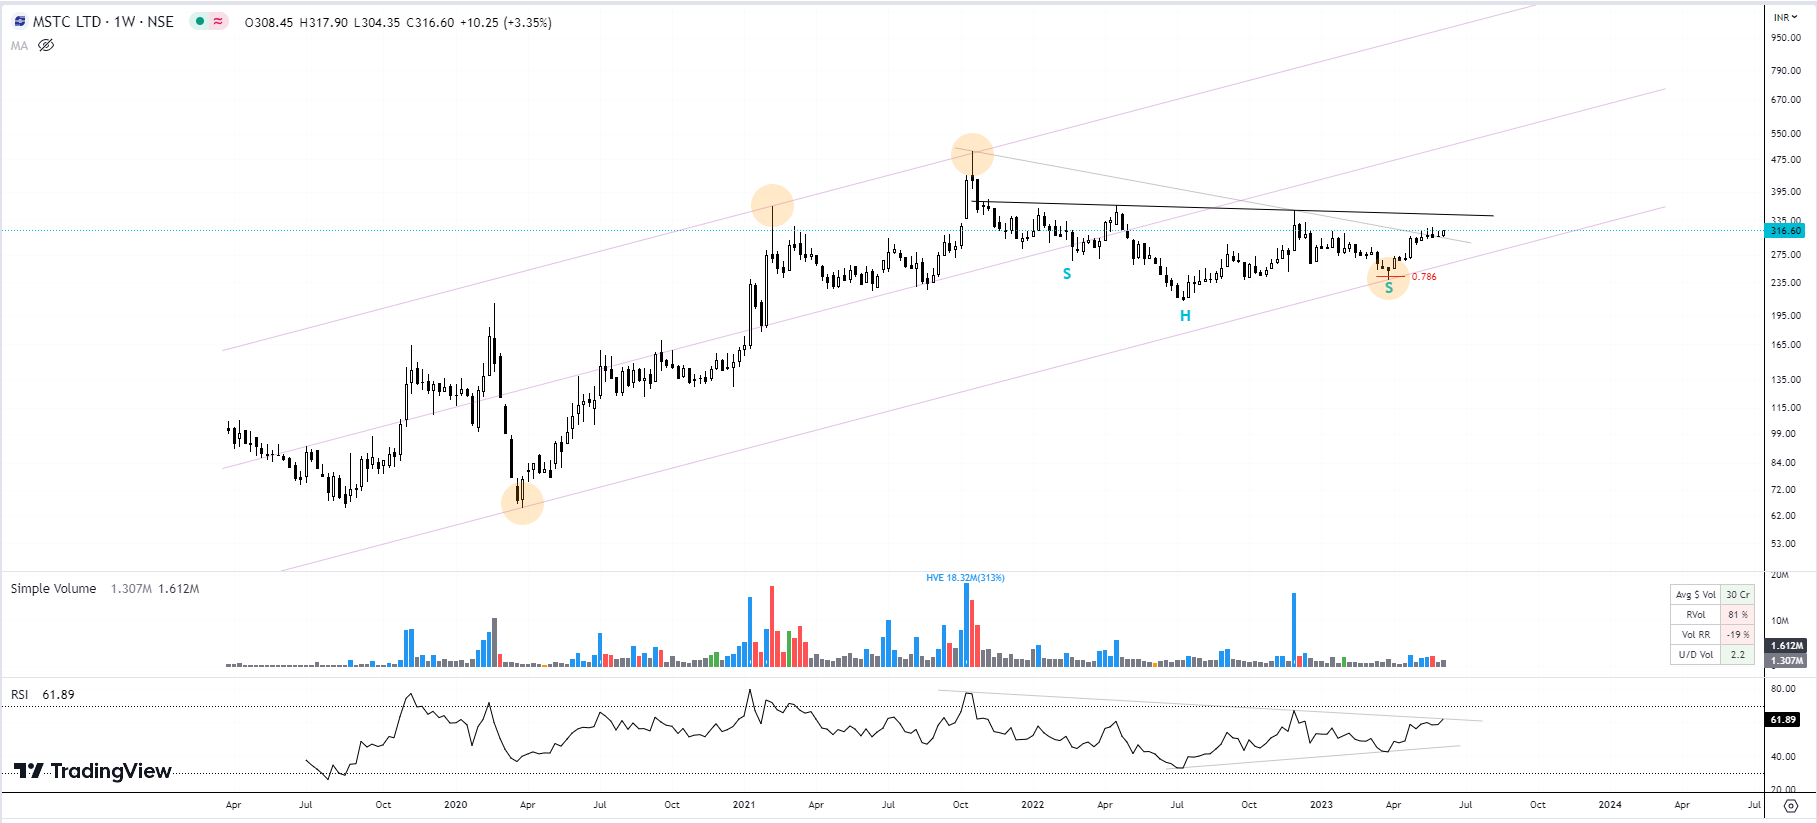
A Setup that i am finding with a possible Bullish bias is that of MSTC:
The stock made an ATH in Oct-2021 of 499 post which a retracement followed over 8-10 months to 210 levels.
Currently it seems to be forming a Inverse H&S pattern, a classic bullish reversal pattern. This pattern has been forming since Nov 2021.
The stock has given a slant break, and looks likely to complete the right shoulder which is in process.
It also seems to be respecting a Channel, which multiple touches at channel tops and bottoms (orange circles).
How i personally view the accuracy of the channel drawn is by seeing the middle channel line and the touches to that (bounces of the middle channel line).
the RSI also seems on the verge of a breakout.
If the Inverse H&S pattern does complete and break, we could have a reversal in trend and decent upside in the future possibly touching the channel top.
EIL chart is playing out according to expectations till now. So there is still the possibility of it crossing the resistances drawn in charts. Even after run up, consolidation in a narrow range is encouraging. A stock after its upmove is expected to go sideways for some time. But if it does not correct too much, it is an encouraging sign.
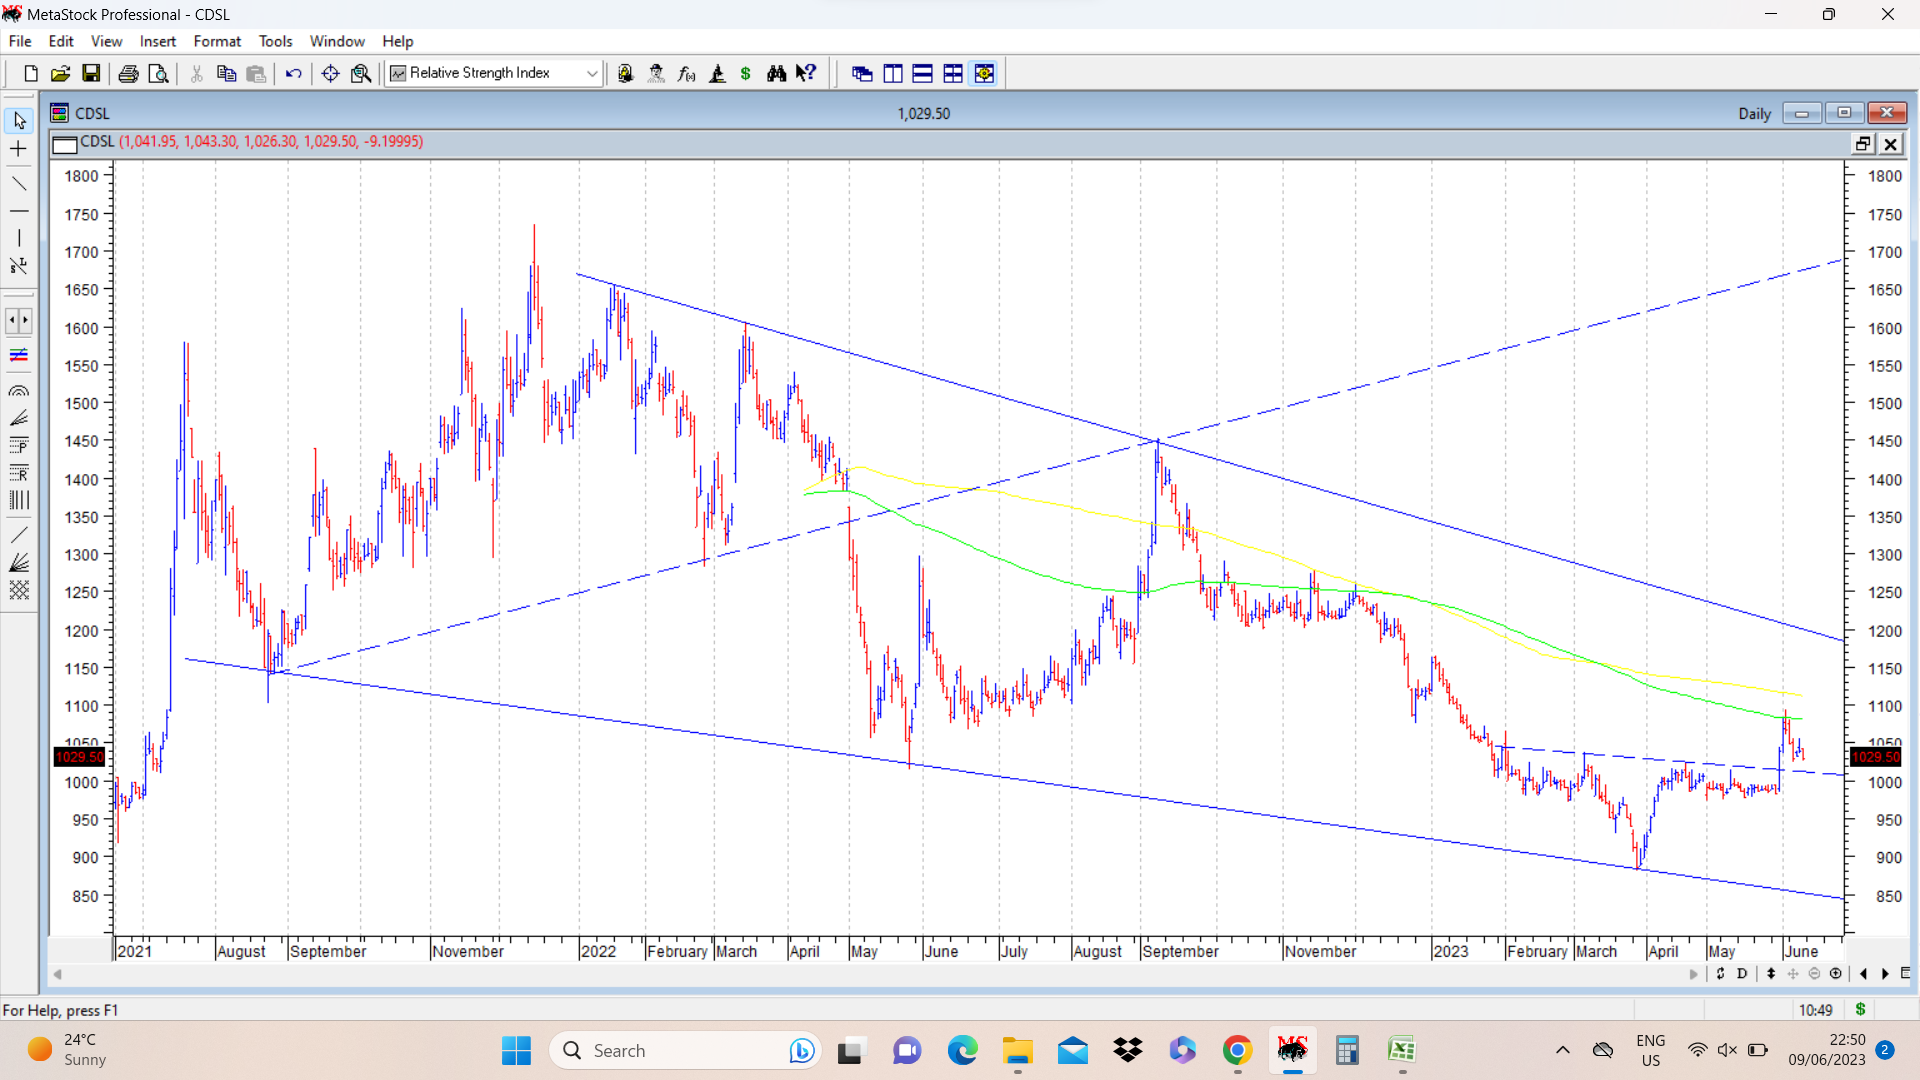
CDSL was a much touted “platform” stock in the past and the stock price had rallied from 200 in March 2020 to a high of 1700 in Dec 2021, nearly 8.5 bagger in a short period of 15 months. After that it went into a triangular corrective mode and made a low of 880 and moved up and has now broken out of a small head and shoulders pattern (neckline drawn in dotted blue lines. After breaking out from this inverted h & s pattern, it went up to touch its falling 200 dema at 1093 and started correcting (as is usually expected. In early phase of an upmove there is a definite correction from expected resistances unless the primary trend is very very strong. )
On daily charts when bottom was formed, there were positive divergences. The daily chart also displays a Wolfe Wave pattern for a potential target of 1700. Breakout from triangle would happen once it crosses levels of 1200 in near term.
disc: invested at around current prices. More as a techno funda bet, with small allocation , to be scaled up if pattern plays out as expected. ( This chart is put up only for academic purpose, and anyone buying should do their own diligence. ) Chart is very interesting because of confluence of different patterns.
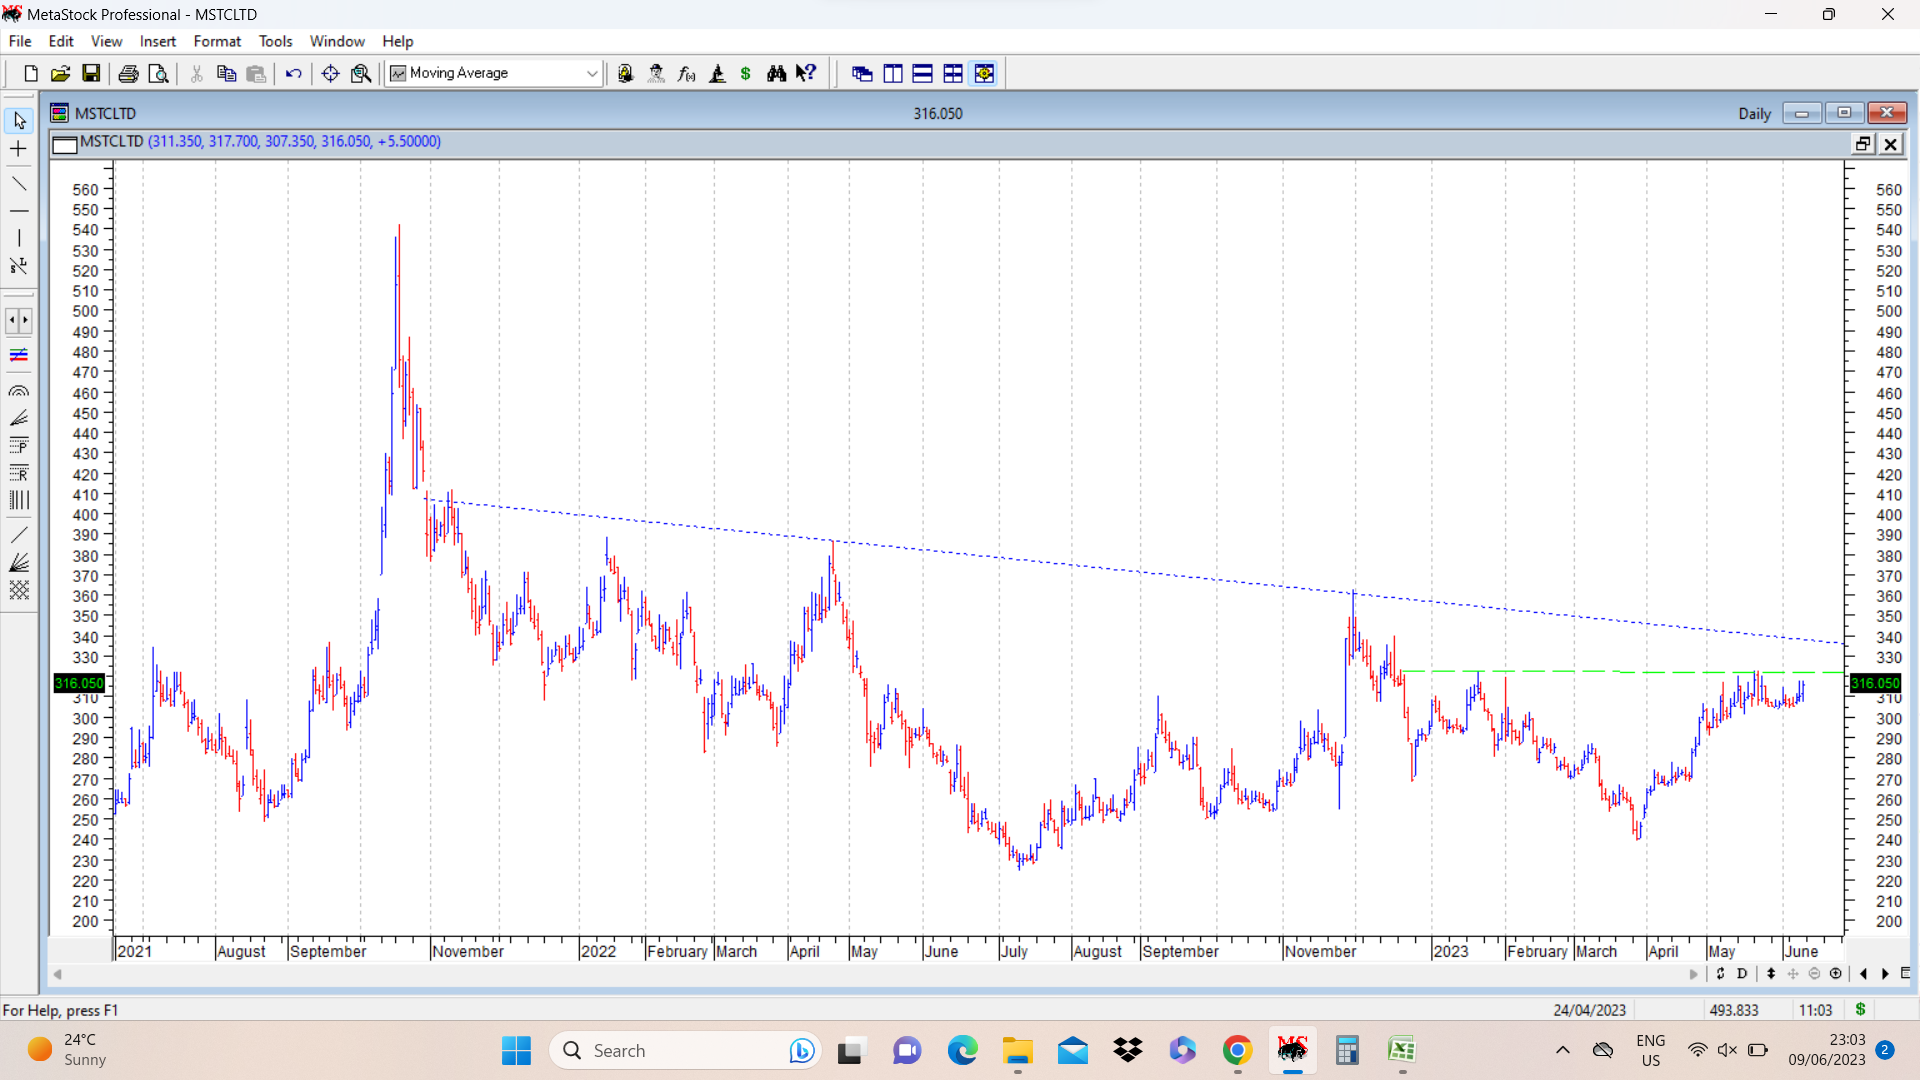
MSTC is a good example of confluence of many technical patterns in same chart. Putting up my own interpretation of daily charts. I can see two potential inverted head and shoulders pattern breakout possibilities. Slightly longer term is what you put up and I have marked that pattern neckline in dotted blue lines. There is another shorter inv head and shoulders pattern breakout possibility and here I have marked neckline in dotted green lines…
All these kind of confluent technical patterns make for interesting learnings and thanks for bringing these up on this forum.
Current price is 316. Breakout from both inverted head and shoulders pattern would be confirmed on move above 340, which is another 10% up from current levels. I would keep this in my watchlist and try to buy once it clears 340 (if I can manage to free up some funds)
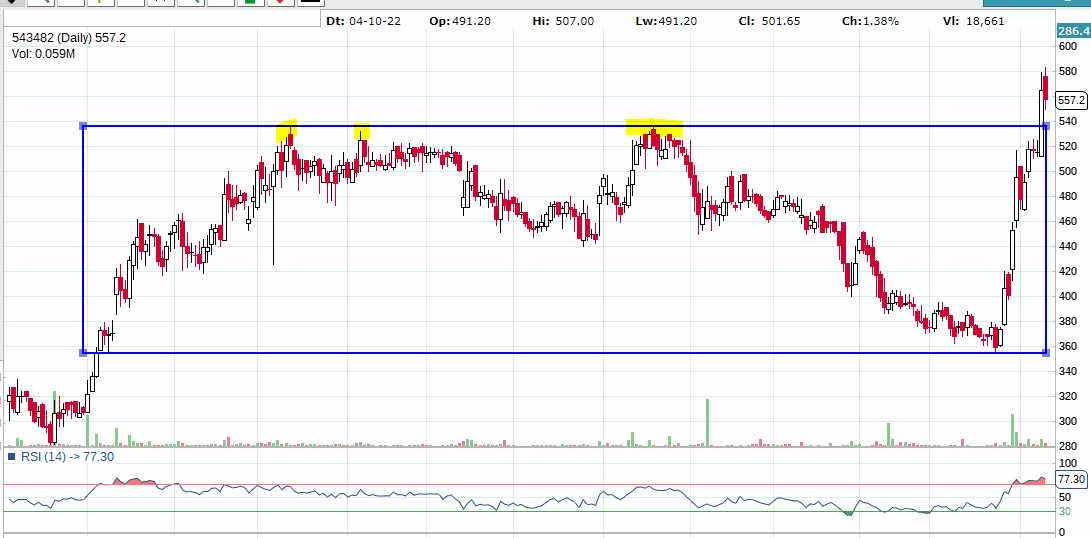
Eureka Fobes had a resistance at 540 and stock failed to clear that multiple imes. Infact the breakdown from double top took it down all the way to 355 which was an earlier support.
Stock has now crossed this resistance backed by good results and extremely positive management commentary on first concall
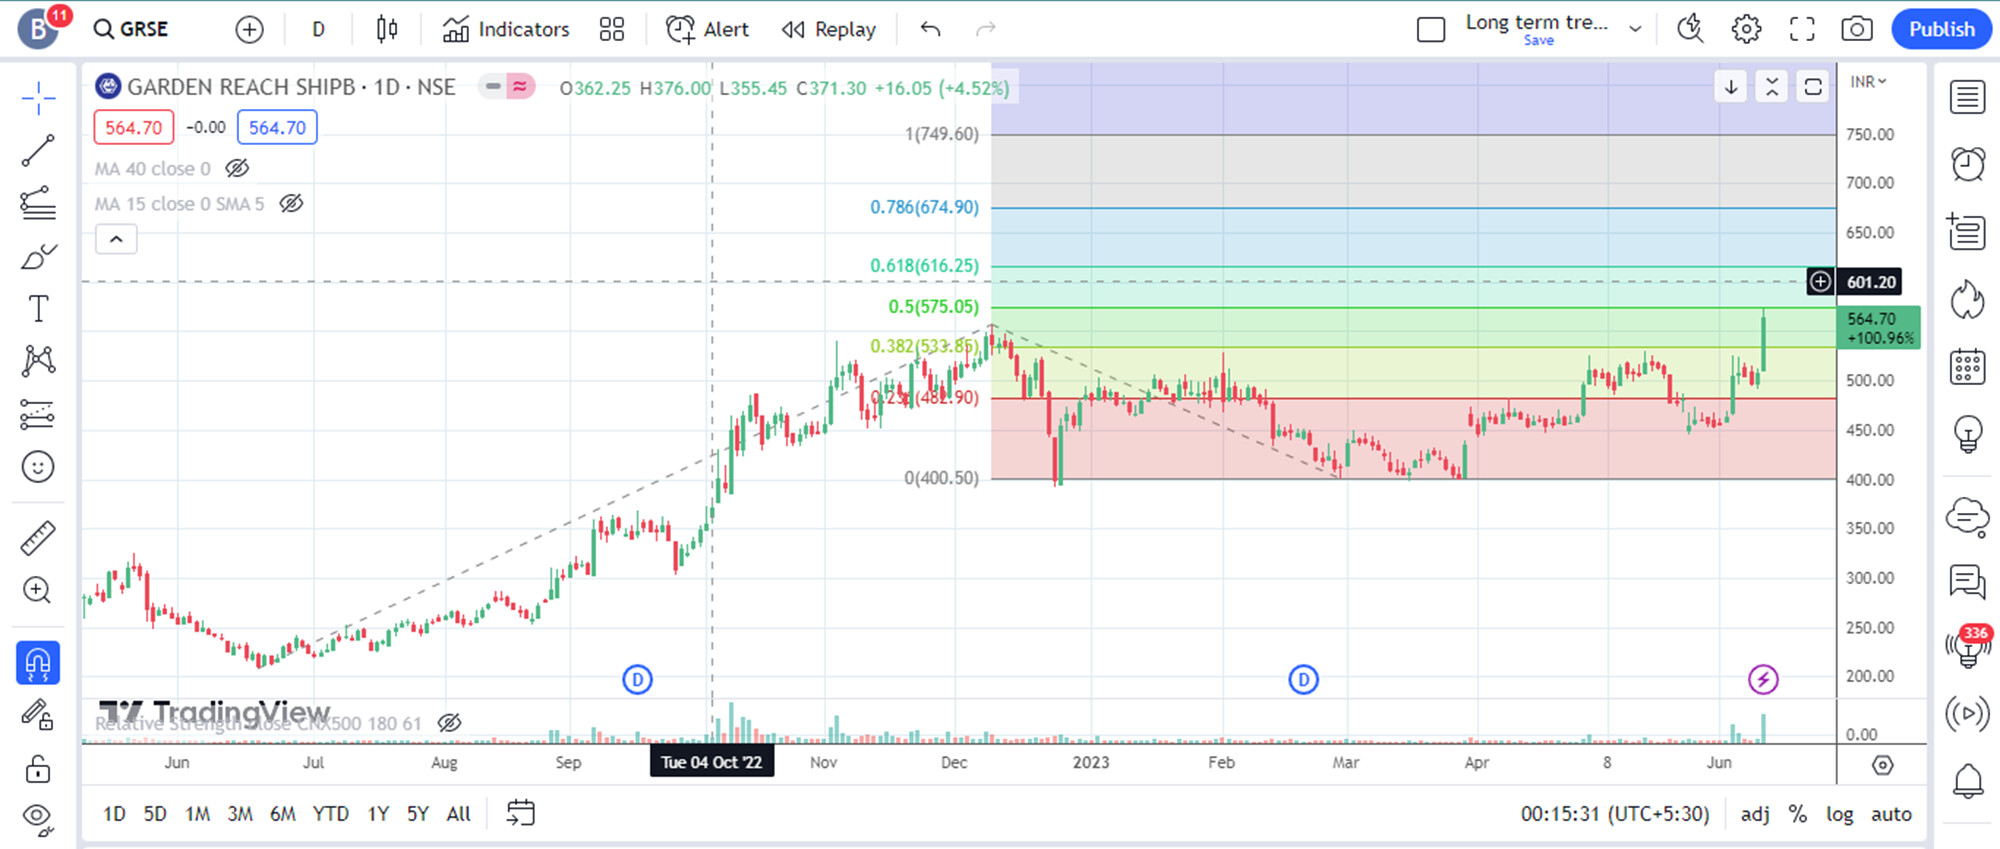
GRSE like all other shipbuilders has been posting excellent results and has guided for even better for the next 3 years. A classical cup’n’handle break with heavy volumes can be seen on the chart breaking into a new all time high. With a mammoth order book of over 24,000 crores - GRSE is on a strong footing in terms of revenue & earnings visibility. Possible target is about 750 using fib projections although with that kind if order book and a market cap of 6500 crores there seems to be ample scope of a further re-rating in my view. Disc - invested