
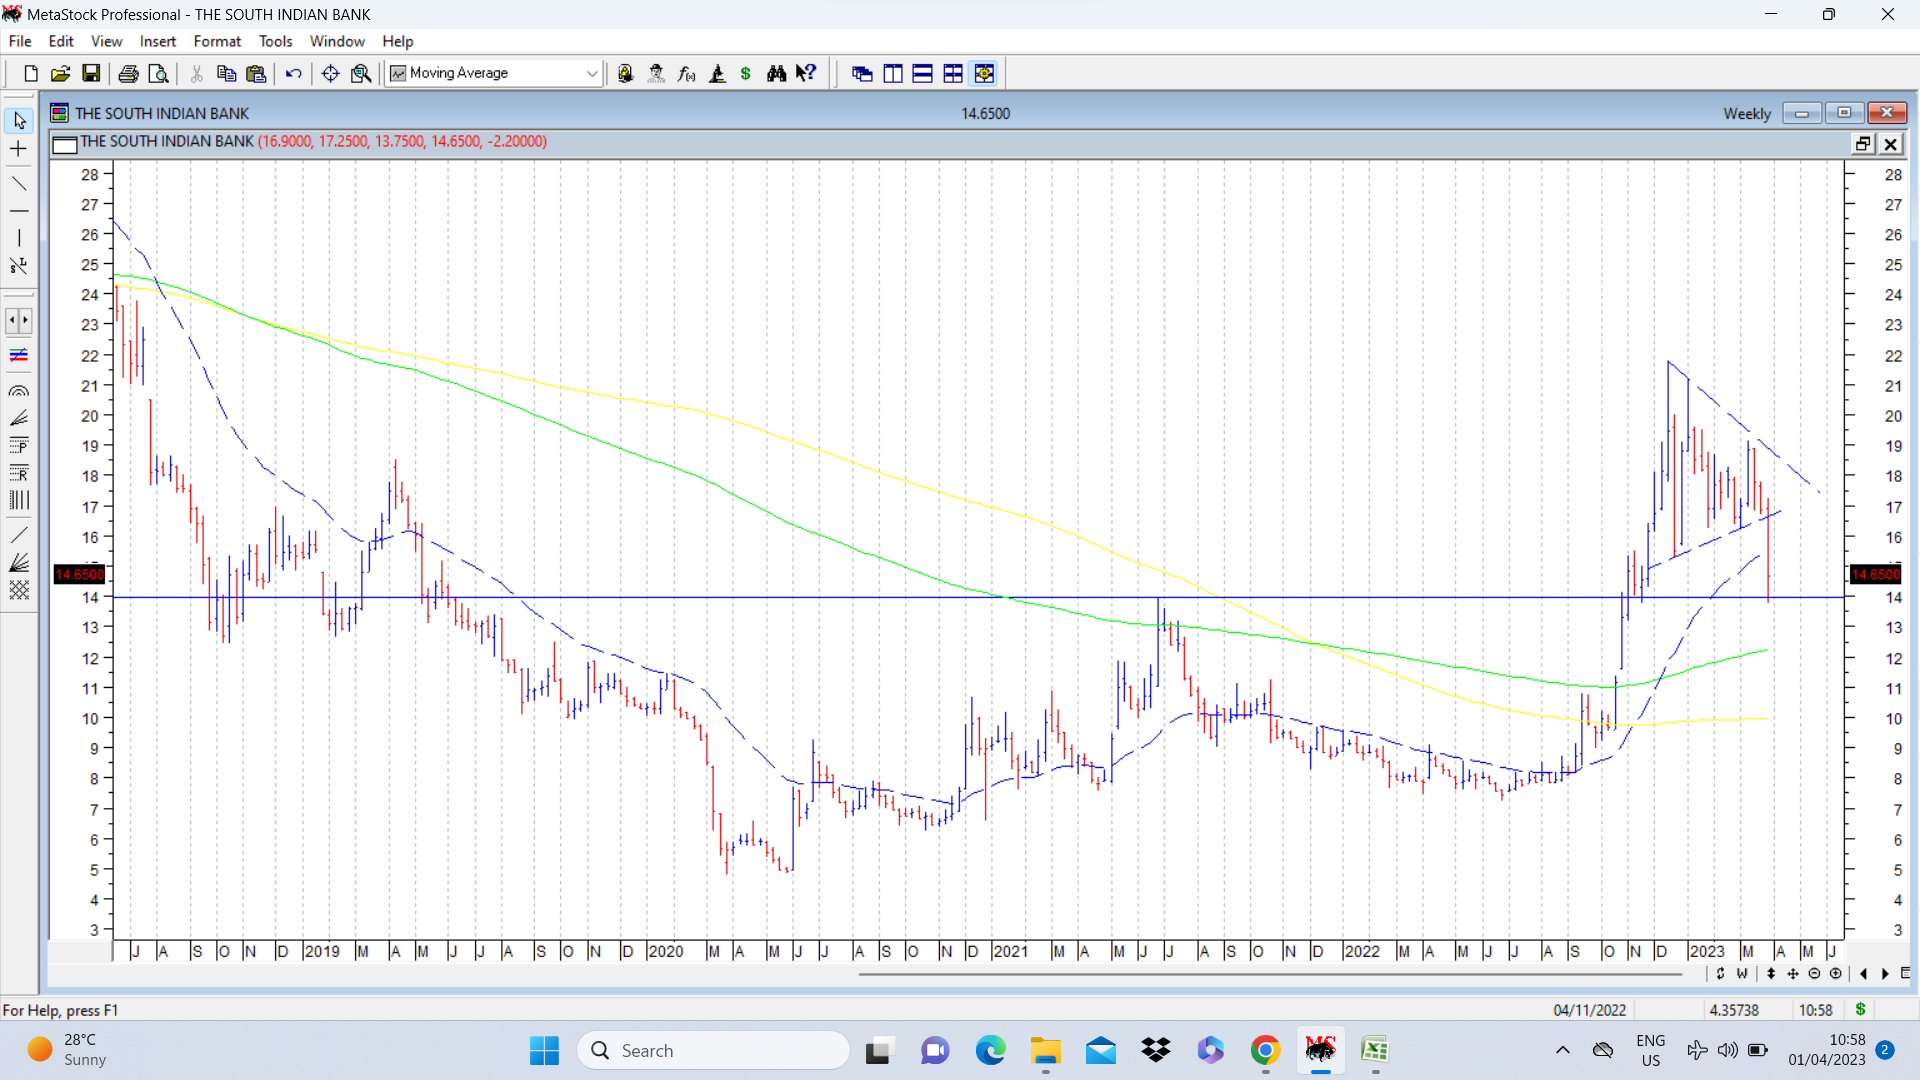
Above was the response to a query related to a symmetrical triangle formation I had posted on South Indian bank. And with the imminent departure of its CEO, the stock price tanked, breaking down below the above mentioned triangle and stock price took support at exactly the previous breakout level of 14. Goes to show its better to be patient and wait for a successful breakout from a triangle and then only contemplate an entry and that too with proper stop losses in place.
14 Likes
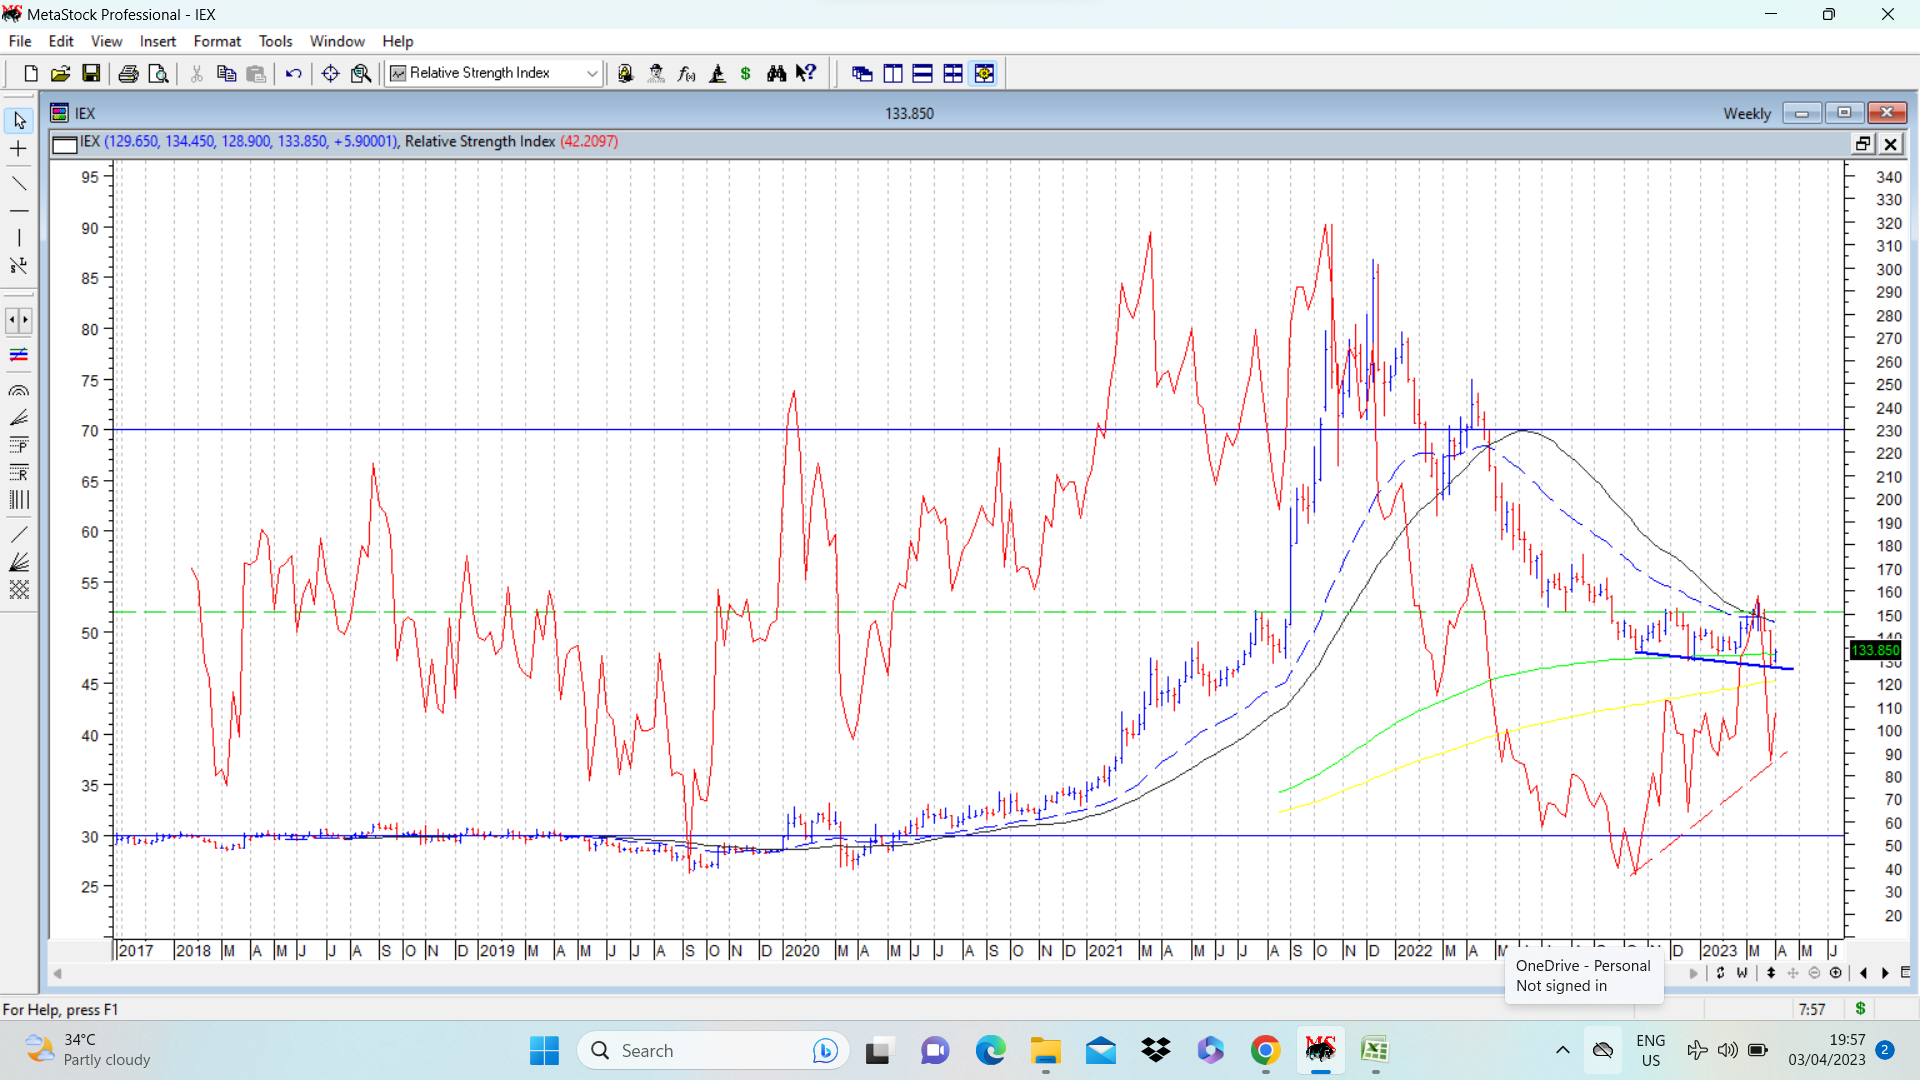
POSITIVE DIVERGENCE ON RSI.
Here typically after a prolonged fall (usually in weekly charts, where it has more significance), stock price keeps making slightly lower lows (not drastically big cuts) successively for a few weeks… And all throughout this process, the RSI keeps posting higher lows…
In the attached chart of IEX, (much talked about recently due to stake sale by Dalmia group) , weekly chart shows lower lows as marked by bold blue lines and during that process, RSI shows higher lows (marked in red dotted lines)…
In situations like this, it makes sense to look out for signs of bottoming out and keep this company on the watchlist.
Important resistance to keep a note of is levels of around 151, crossing which enhances bullish undertone. Marked in dotted green lines… disc: no position, but in watchlist.
15 Likes
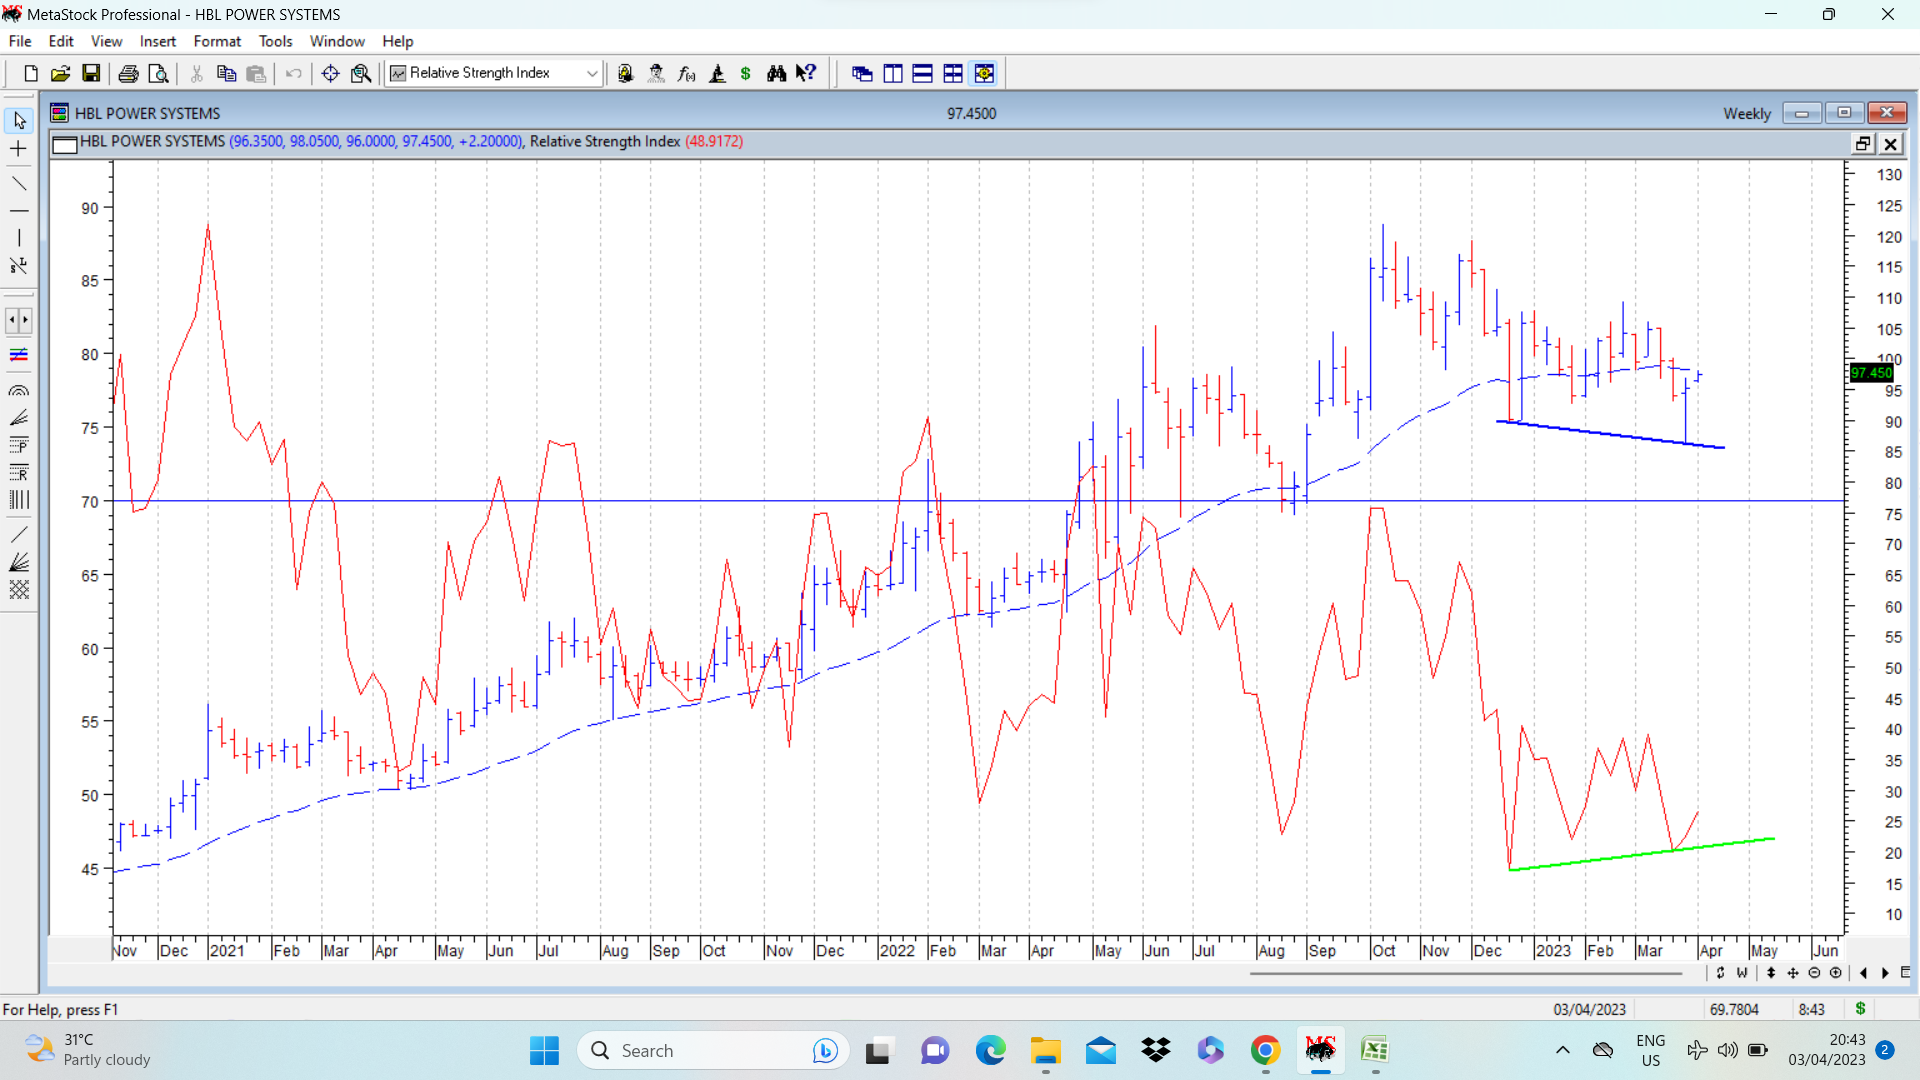
HBL weekly chart also showing positive divergence on weekly chart. Lower successive bottoms marked in bold blue and higher lows in RSI marked in bold green. Here the example is not as classical as in IEX, but present all the same.
12 Likes
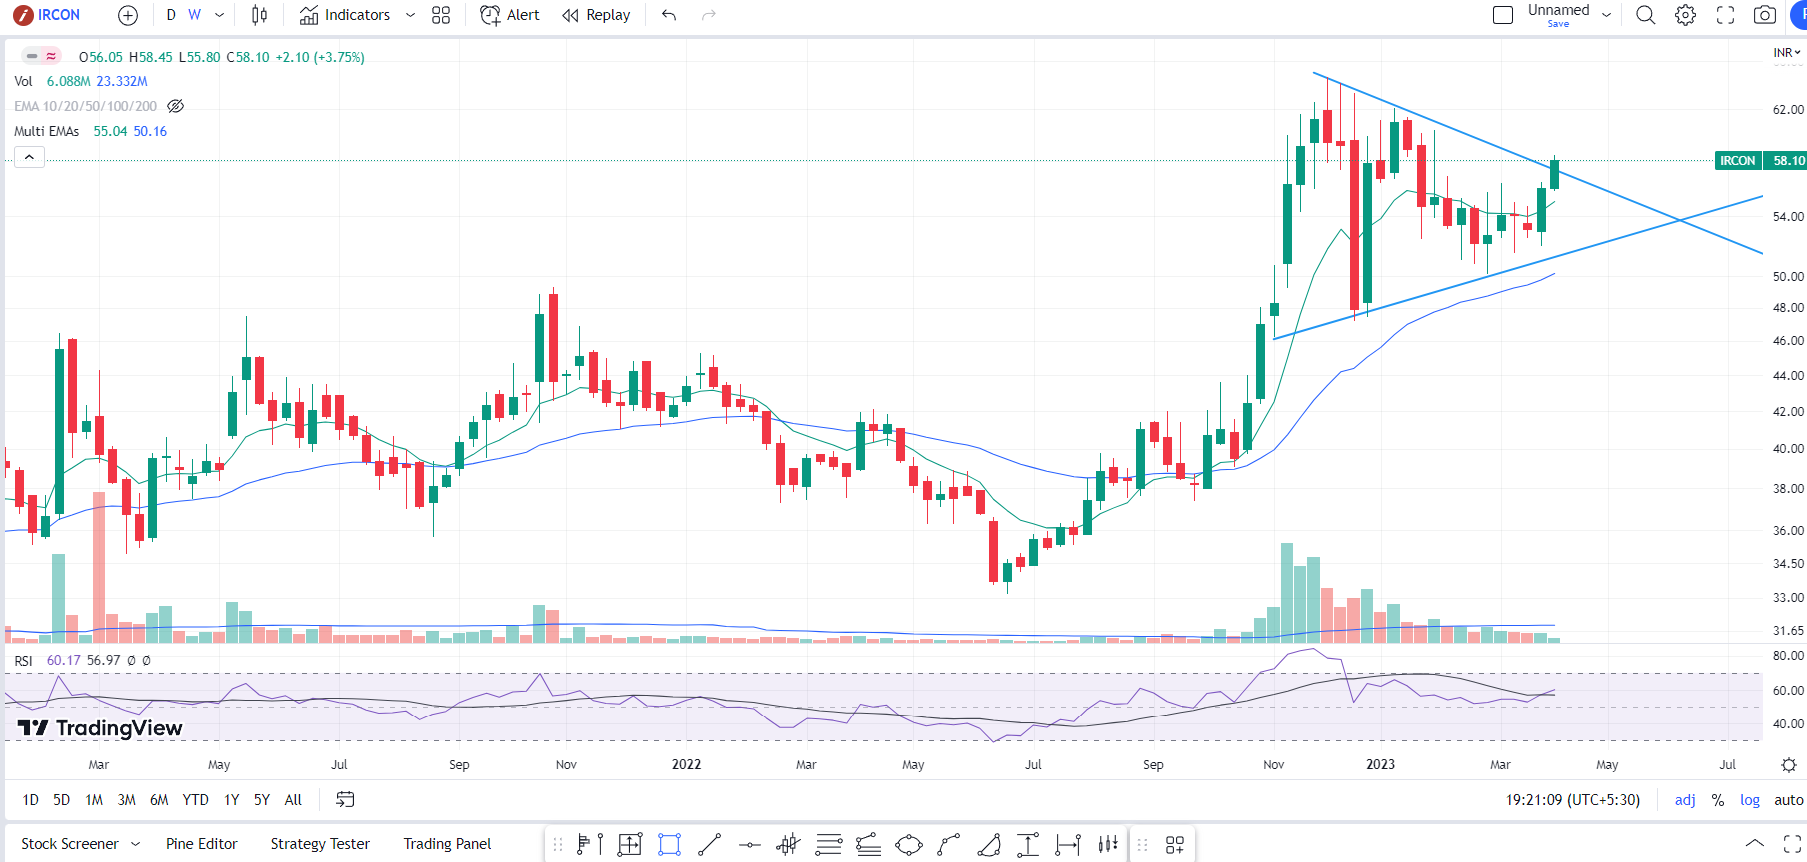
Ircon symmetrical triangle BO. above weekly 10ema & 40ema.
Strong orderbook of 45000cr & yearly sales less than 10000 cr.
Market cap 5000 cr; P/E ~ 7; Dividend yield 4%
Cash holdings > Market cap
Disc: Invested
7 Likes
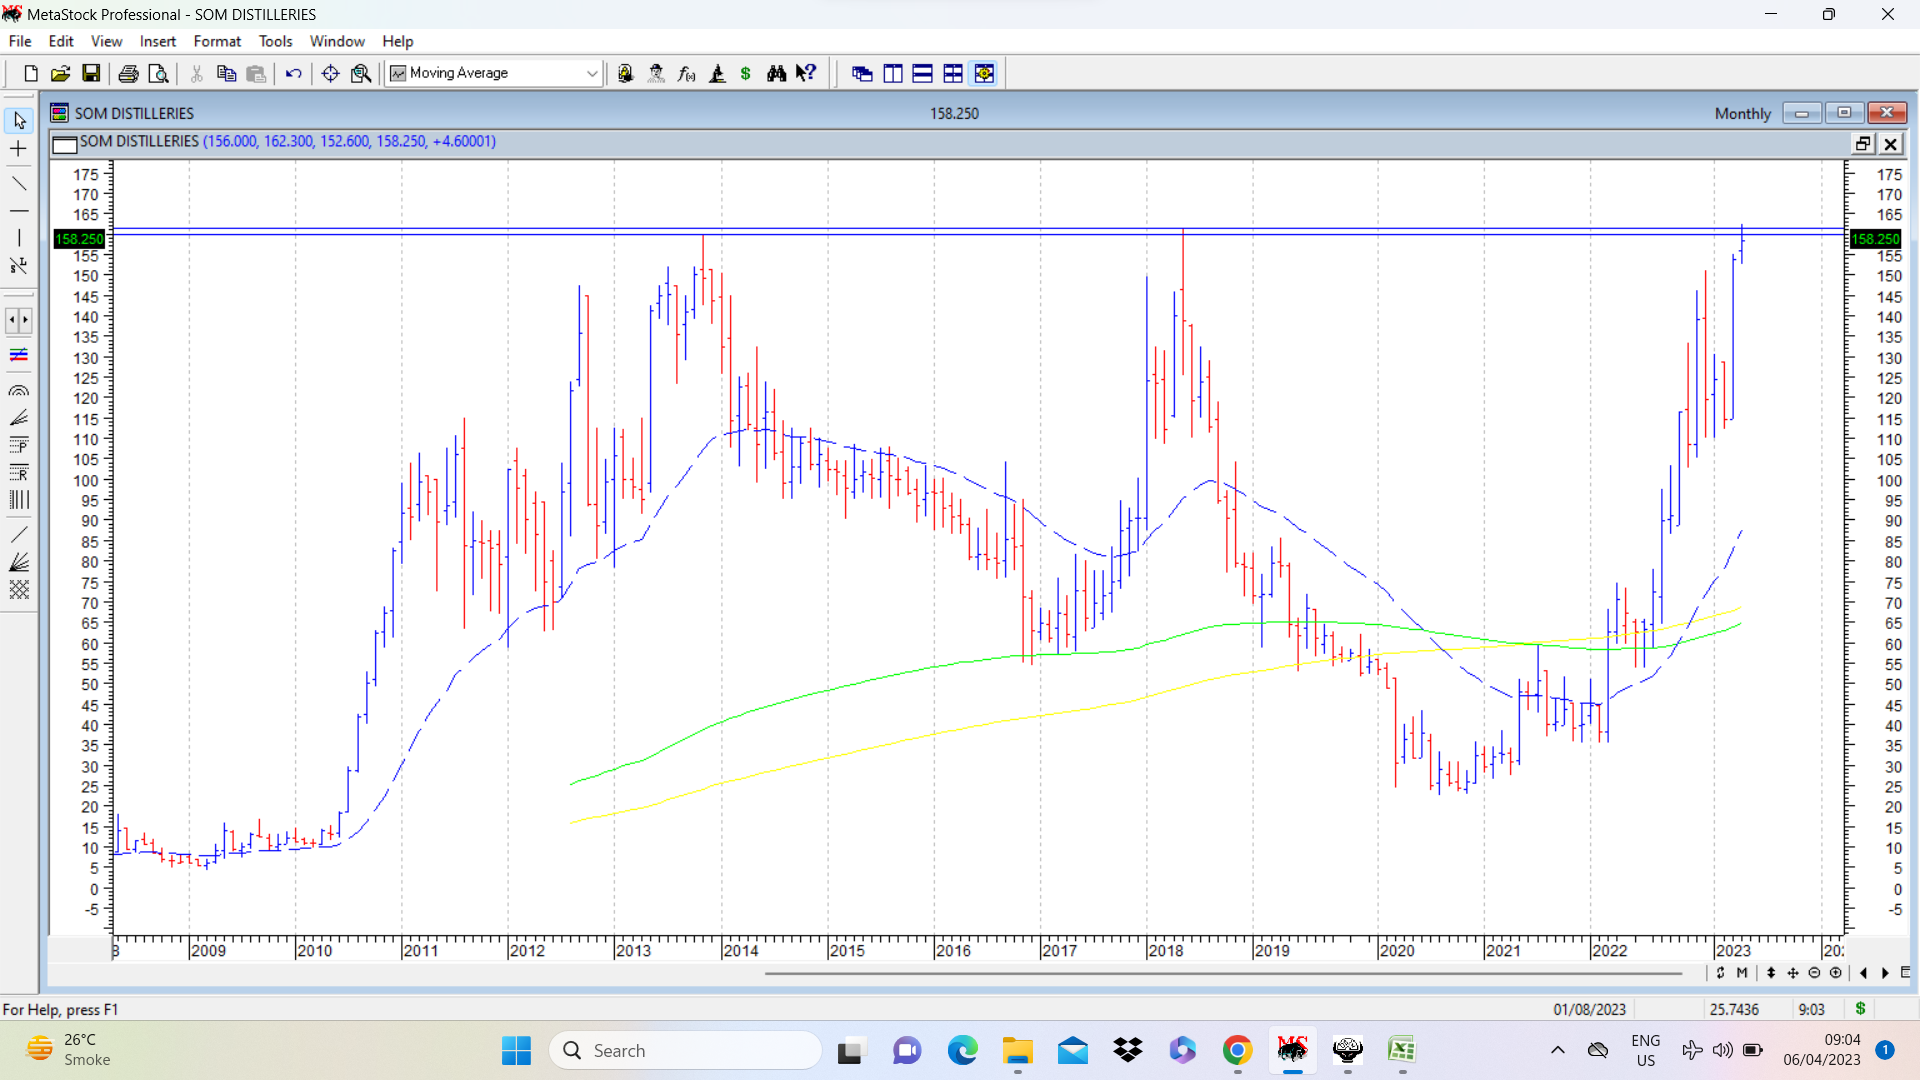
Som distilleries. cmp 156. Stock price broke out of a cup and handle pattern above 150 recently, (3 year highs ) after having shown higher strength in a weaker market in the past few weeks. Pattern target if pattern plays out can be 270. Previous all time highs at 160-161. PS: CHART REVISED ADJUSTING FOR STOCK SPLIT FROM RS 10 TO RS 5 WHICH HAPPENED IN OCT 2020. Thanks @vishal_lehar and @sharemarketgen_ for pointing out the anomaly.
Fundamentally, company is on track to post good growth in next few quarters if one were to go by management commentary in recent concall. New products, new geographies and enhanced capacities all coming together. disc: techno funda based position.
28 Likes
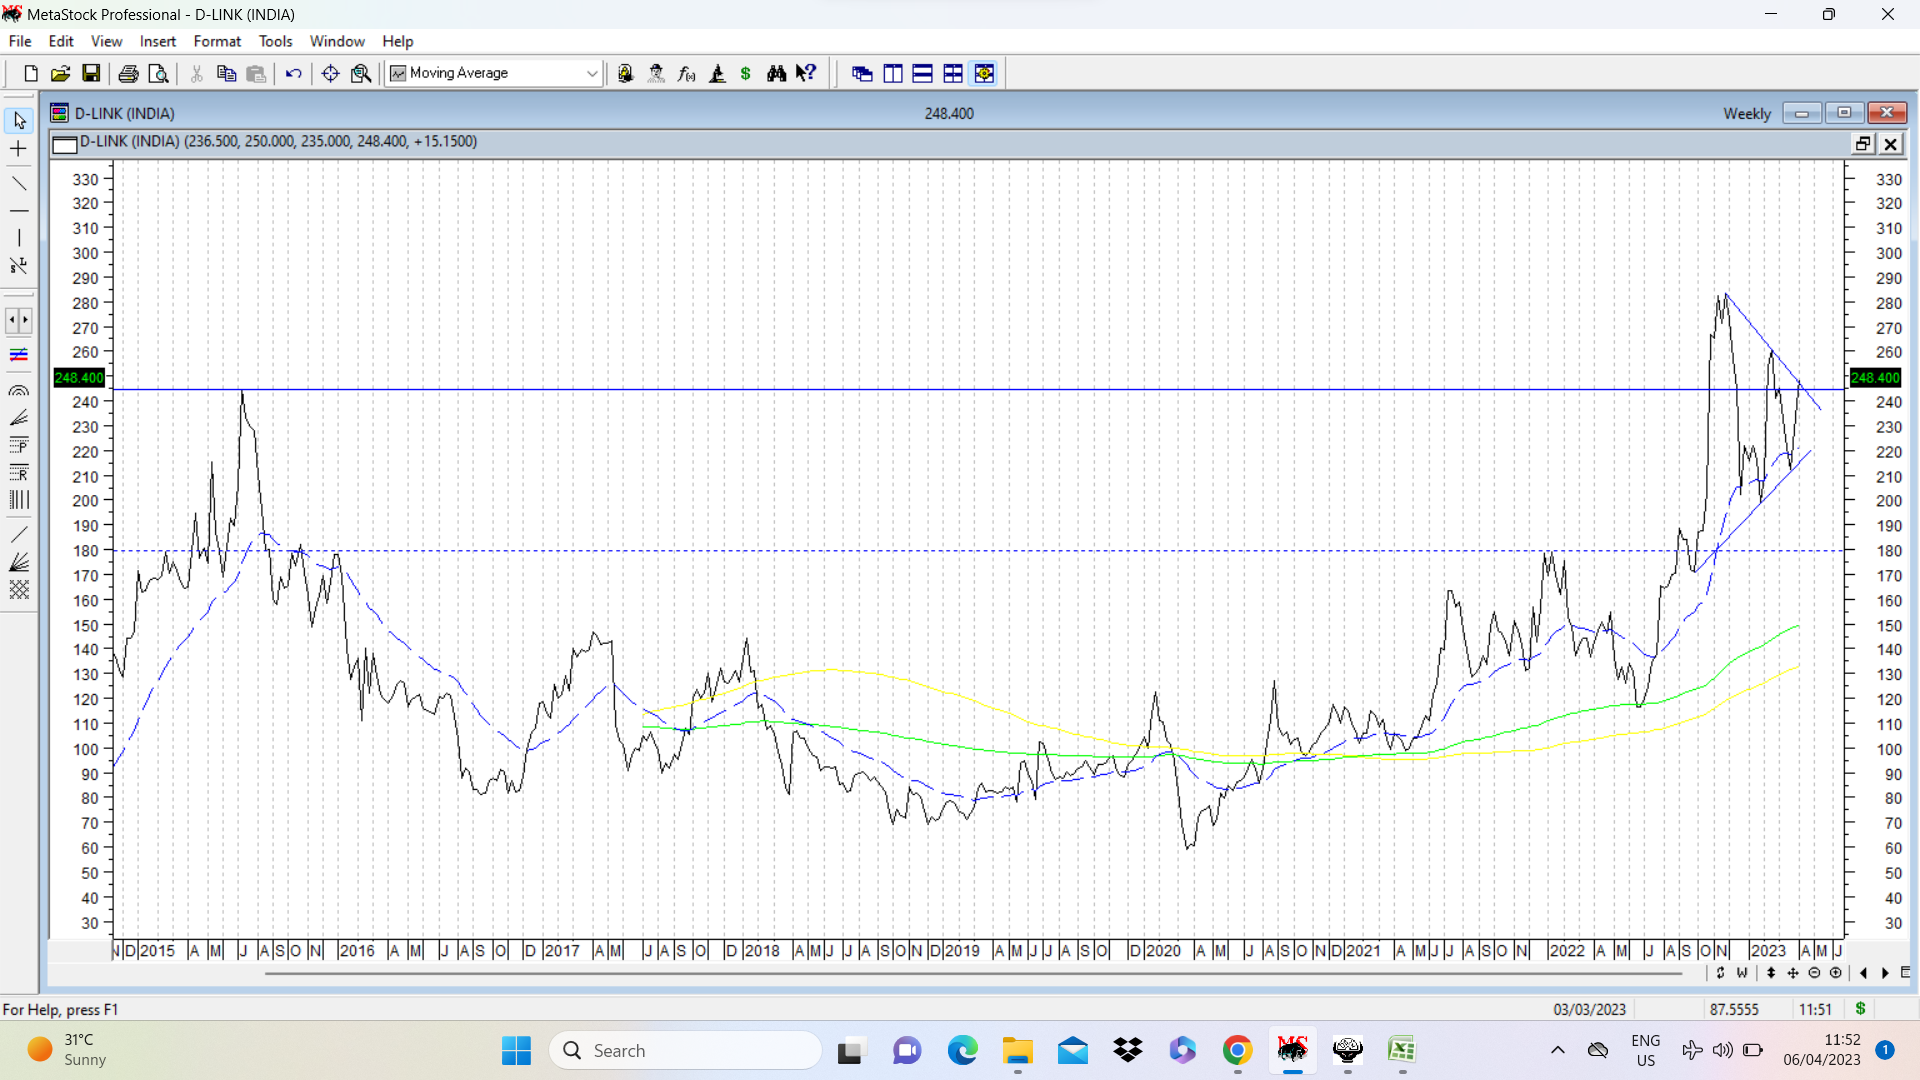
Dlink India has been a dominant player in networking products… Fundamentally it was a sleepy company not going anywhere. But it has been consistent in terms of growth, though growth can be termed as sedate. Since last two quarters things have improved a lot on profitability front and margins which were normally 6-7% jumped to 10% in Sep 22 qtr and further up to 13% in Dec 22 quarter. Part of the reason for this margin improvement has been discussed on VP thread on the company, where one can browse for fundamental inputs.
Technically the stock price broke out (during Oct 2022) above previous ATH of 252 posted in July 2015 and went on to post fresh ATH of 311 before weak markets took its toll on its stock price. Since then it has been consolidating above and below the previous ATH in a triangular consolidation pattern. A strong move above 250 will confirm this triangular breakout.
Also worth noting is the lovely rounding bottom formation seen in weekly charts with breakout above 244.5 (closing weekly high) . Since this breakout, above mentioned triangular consolidation is marked on right side of chart. disc: invested.
21 Likes
Promoters buying regularly. Over the past one month at least, Som is one of the companies REPEATEDLY figuring in the list of Promoter buying. Thanks Hitesh Ji, for who you are and what you have been doing for the investor community. Immense Gratitude and Respect.
9 Likes
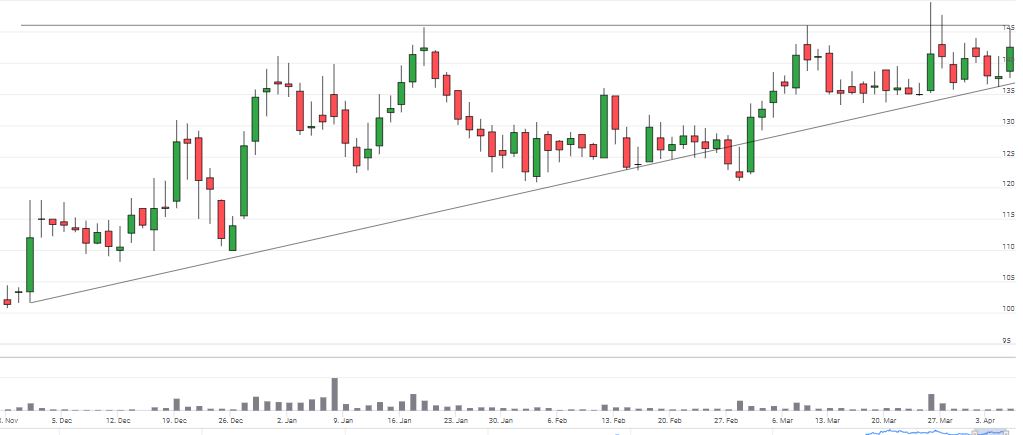
Mukand Ltd, a debt laden company mostly working capital debt of around 2100 cr is pushing the price higher for the past 4 months. It seems to be looking to breakout of an ascending triangle with the lows getting pushed higher in this period.
Stock has moved from 100 to 145 respecting the ascending triangle. The volume in this period more visible on the 1 year graph better clearly shows extremely high volumes are trying to push the price higher. A break above 145 can give a target of 190.
Reasons why this stock can breakout:
- Mukand Ltd has received 800 cr from land sale this quarter which will be utilized mostly to reduce debt.
- Sale of 5.51% shares of Mukand sumi speciality steel will fetch another 150cr approximately.
- A recent letter from Mr. Niraj Bajaj attached here - Link.
Mr Bajaj talks about improving efficiencies, reducing cost, decreasing debt and improving supply chain which seems to be the crux of the company’s problem. - Also Mr Bajaj has given a hint of hitting 6000 cr for FY 22-23. So it seems we can have a 1750 cr+ March end quarter which is a 32% growth YoY.
- Buying of about 0.55 percent equity from the open market by the promoter from 21/02/23 to 23/03/23.
4 Likes
Hi Hitesh,
Thanks for putting these out… It’s fantastic…
Curious to know what would get you to exit out of such bets. These are “techno-funda”, i.e. there are fundamentals backing the story, so how would stop-loss levels work? One would have to give a much higher latitude than a pure technical bet, I assume.
If we take D-link example, say would a price drop below 30 day moving average get you to exit, where would you draw a line or sorts?
Supplementary to the above question:
Inverting this a bit - What if the price action were to take it higher, then what would get you to sell out. Would the decision then hinge on valuations - say 20x p/e or 10x p/b or something along those lines?
1 Like
I usually keep the recent swing low in stocks where I have a techno funda position. In case of Dlink it would be around 205 which was the swing low. Once the stock price starts moving up, the stop losses would also move up at appropriate support levels . There are no rules etched in stone here. We have to formulate our own strategy for putting up stop losses. Another way would be to monitor fundamentals and exit if the story or results weaken.
9 Likes
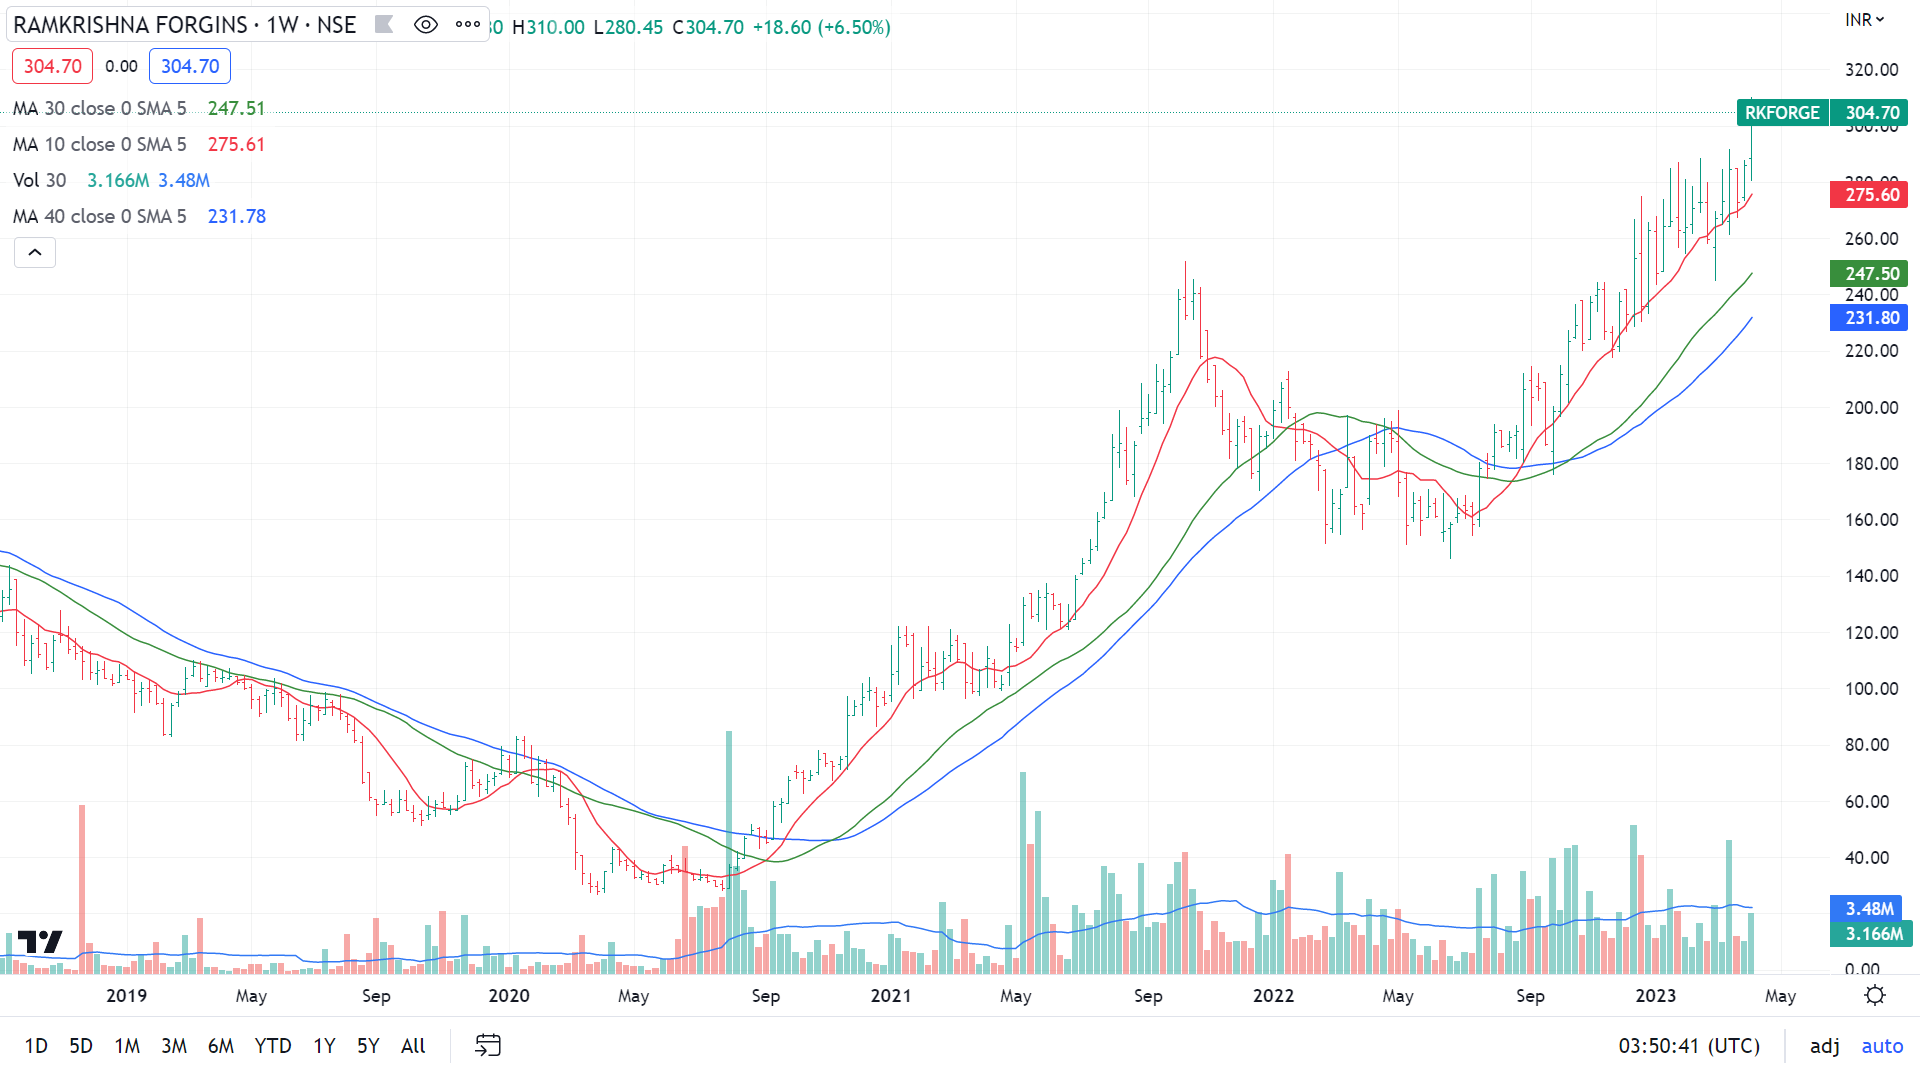
Ram Krishna Forging has been one of the few stocks that has done well since the last market correction that started in Oct-22. It has moved up by more then 20% since Oct-22 and just hit ATH of 310, while closing the week at 304 with heavy vol last Thursday.
On weekly charts, 10wma>30wma>40wma. The consolidation happened between Oct-21 and Jul-22 when the price moved from 252 to low of 146 and then broke out on heavy vol.
Fundamentally speaking, company is the L1 bidder for supply 1.6million wheels to Indian Railways in a consortium with Titagarh wagons over a period of 20 years. (80K wheels per annum).
Disc.: Invested as technical funda bet.
5 Likes
Hello Hitesh sir,
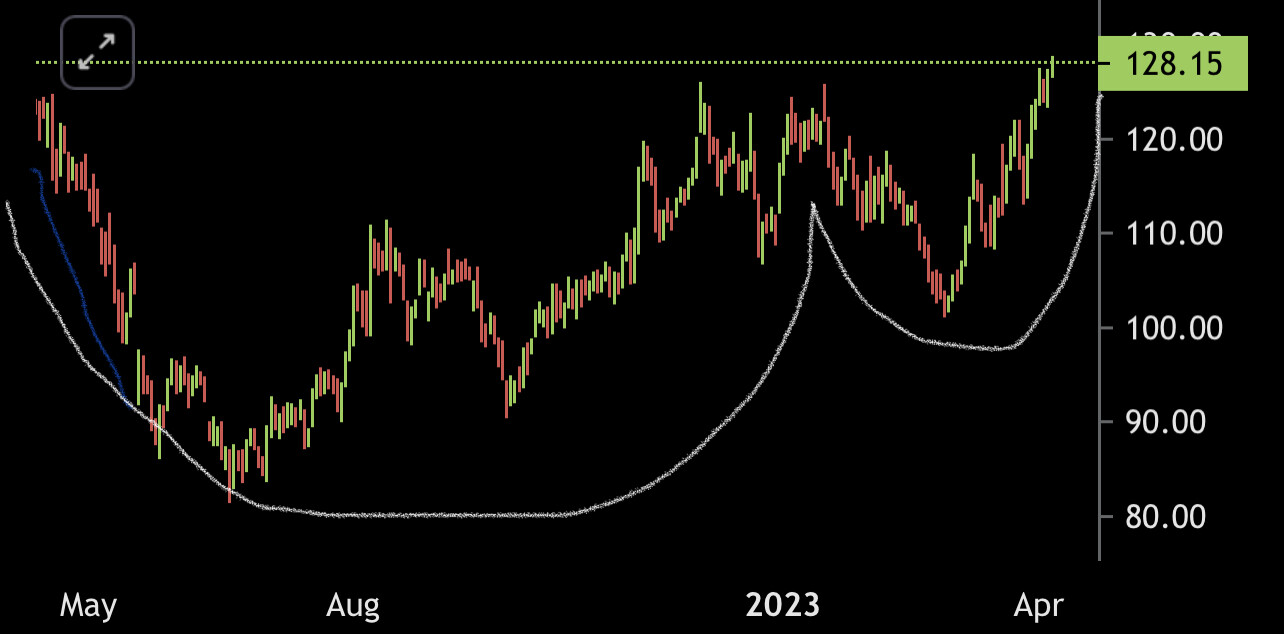
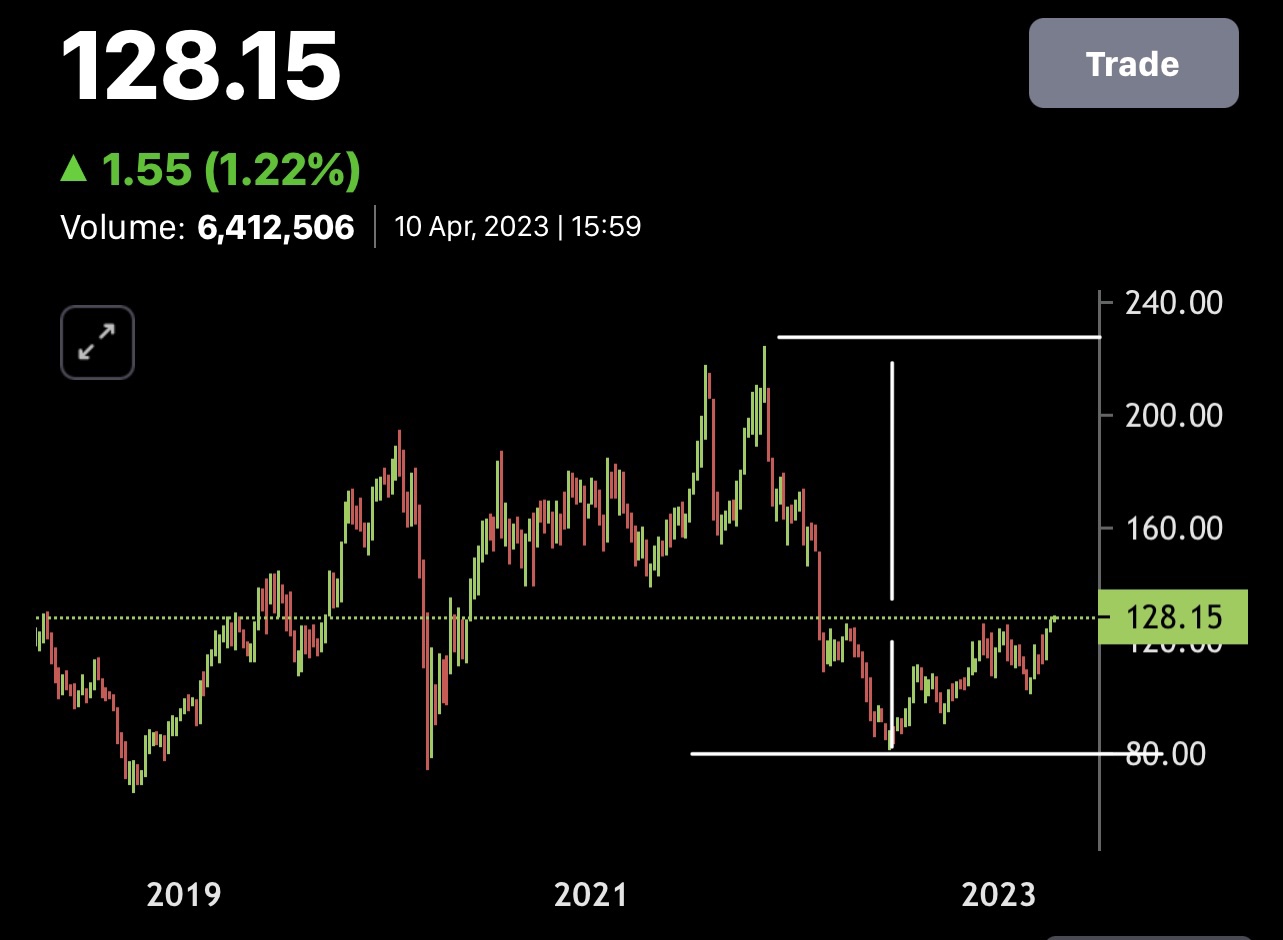
I have a question regarding a cup handle breakout. As it has crossed the 52 week high and broken the 126 resistance, can it technically reach its previous all-time high of 225 rs?
The technical points I noted are as follows:
- There is an extended base formation
- There has been a long consolidation period
- There has been a breakout
*Also cup handle over 1 year
The underlying theme is that we are moving from a gold NBFC to a well-diversified NBFC, and there is momentum in gold in the background of economic uncertainty and questions regarding the US dollar’s status as a universal currency with some people diversifying in alternate things like gold and cryptos
And cheap valuation of Manappuram as just available at its book value and at single digit PE
Thank you very much for guidance
Mahesh
4 Likes
I assume you are talking about Manappuram chart. In future please mention the name of the company while discussing the charts so that folks get an idea about which company we are talking about.
All the technical points you mention are valid. But we have to account for the kind of general market set up we have. A lot of patterns fail or take a long time to play out and hence we need to be aware of that fact.
We have discussed the charts of Manappuram on another thread Hitesh portfolio - #7040 by hitesh2710
Please go through it.
12 Likes
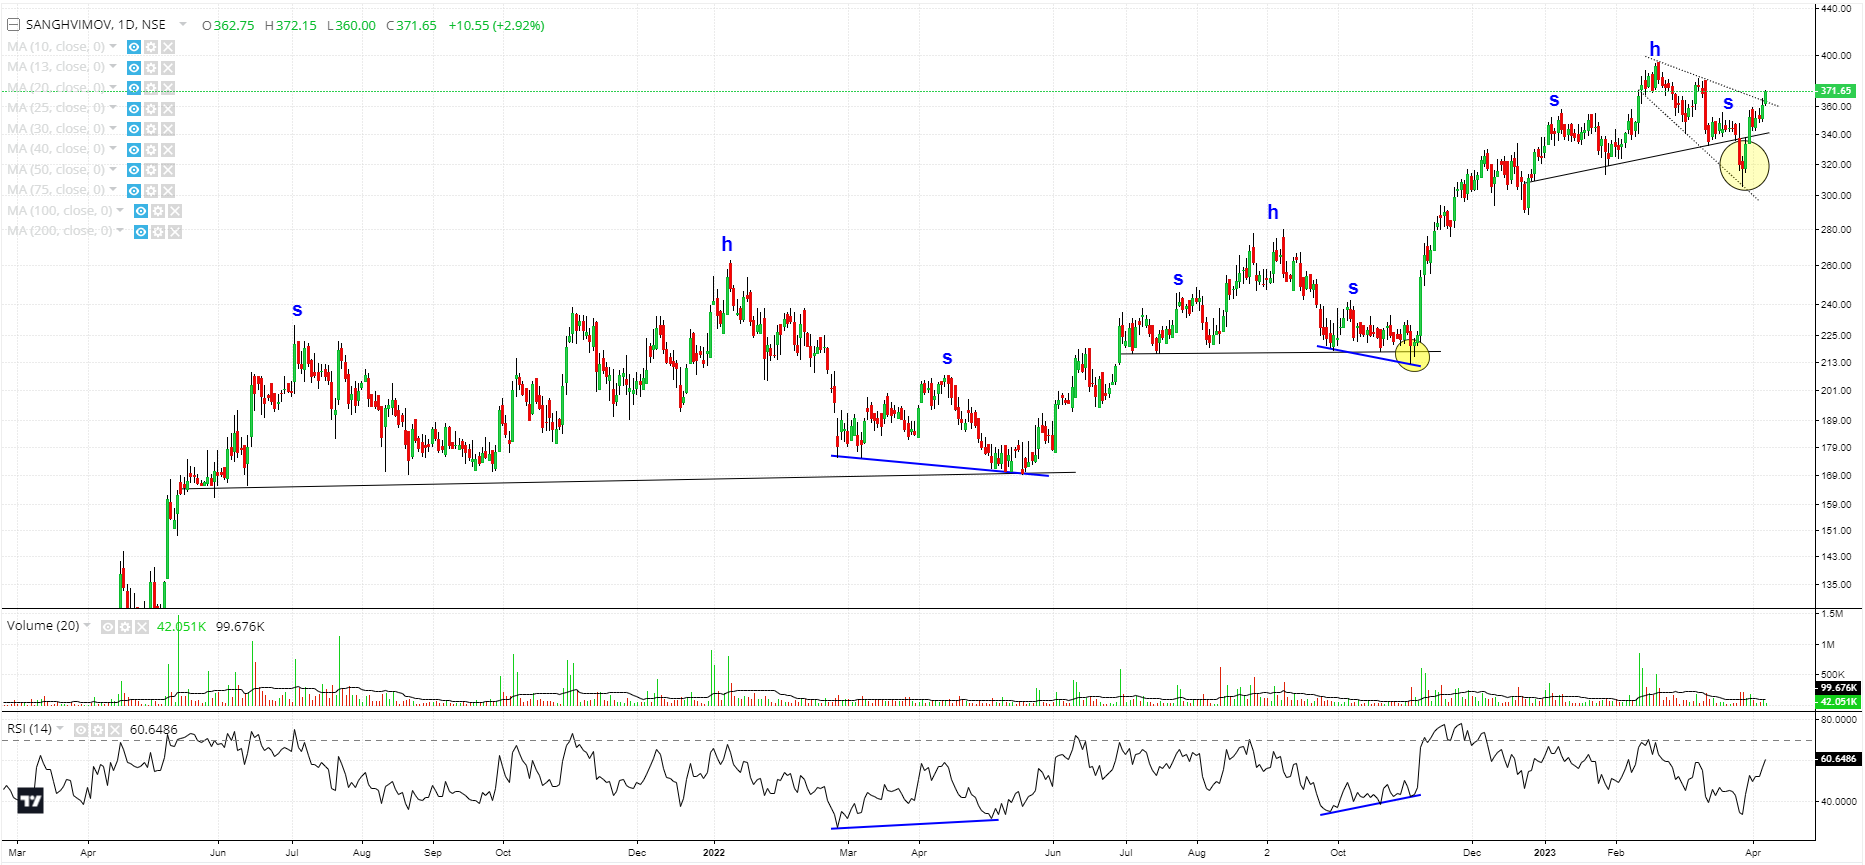
Wanted to highlight a chart pattern for learning purposes: the Reversal of a Head and Shoulder Pattern, which ends up becoming quite a bullish pattern once it crosses above the right shoulder.
Chart for example is of Sanghvi Movers:
Daily Time Frame: 3 Head & Shoulder patterns formed and rejected. Twice a shakeout played out (yellow circles). Twice the right shoulder formed with a Positive RSI divergence (blue trendline).
Currently breaking out of a downward wedge.
The Monthly chart forming a multi year downward broadening wedge giving its bullish upmove.
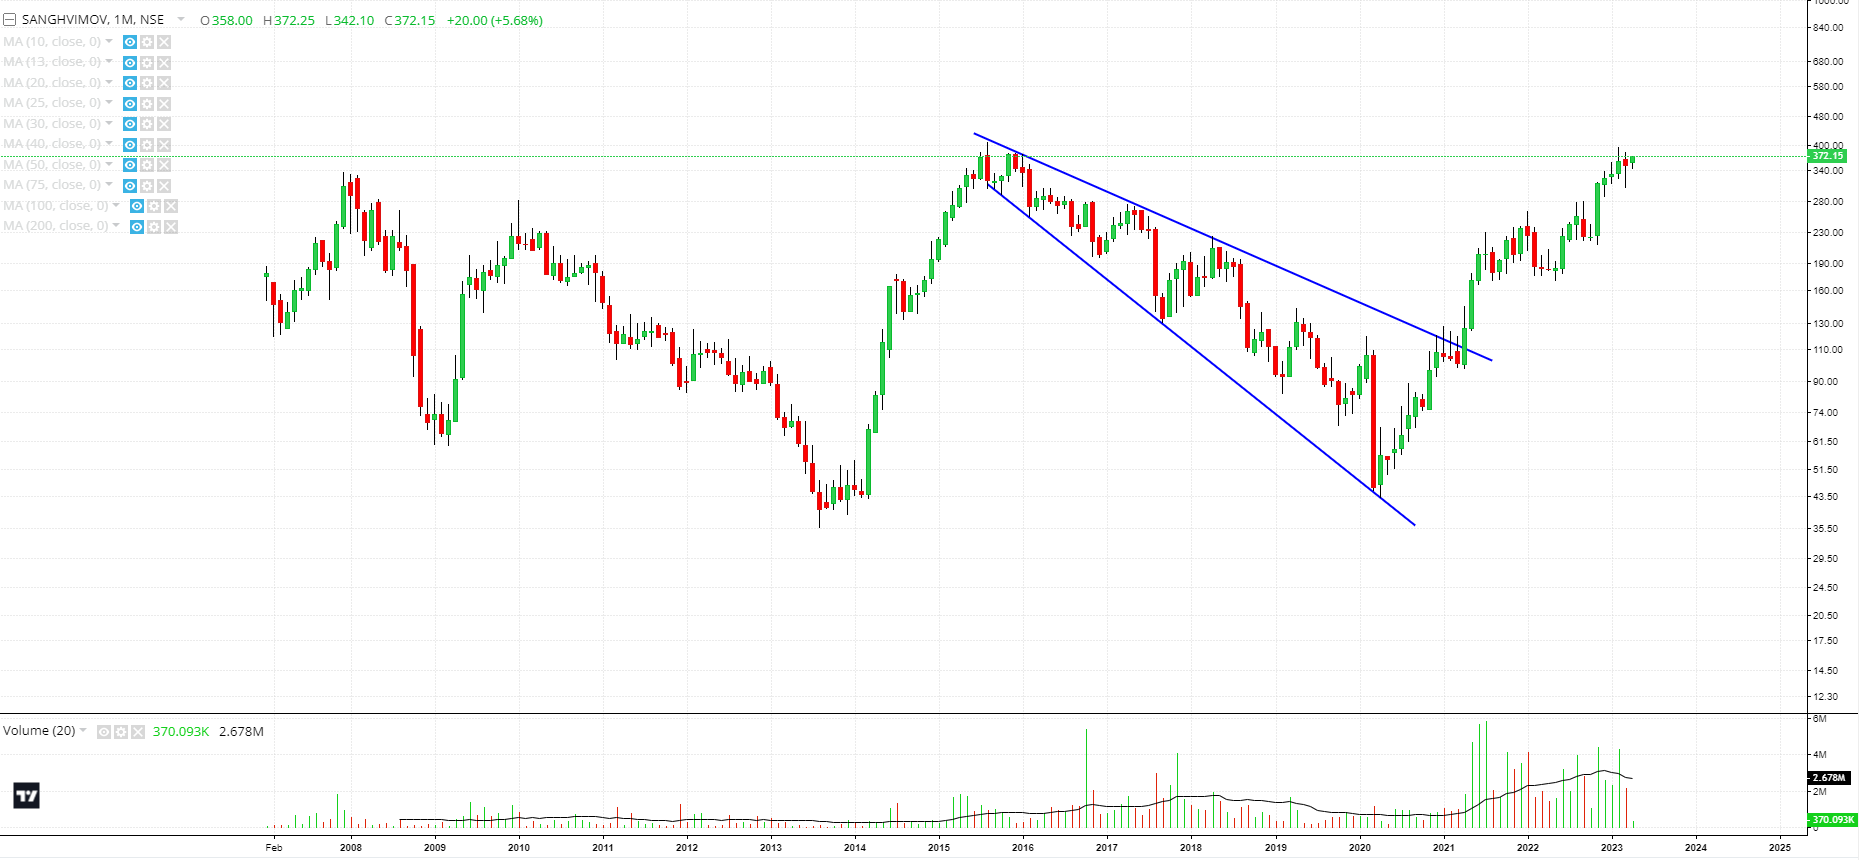
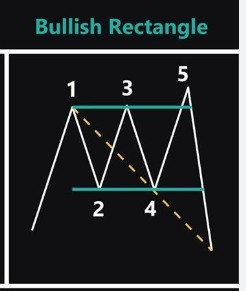
The other pattern which seems to be forming is on the monthly chart is the Wolfe Wave pattern with (5) left to complete. ( Not to sure about the accuracy of this, still learning).
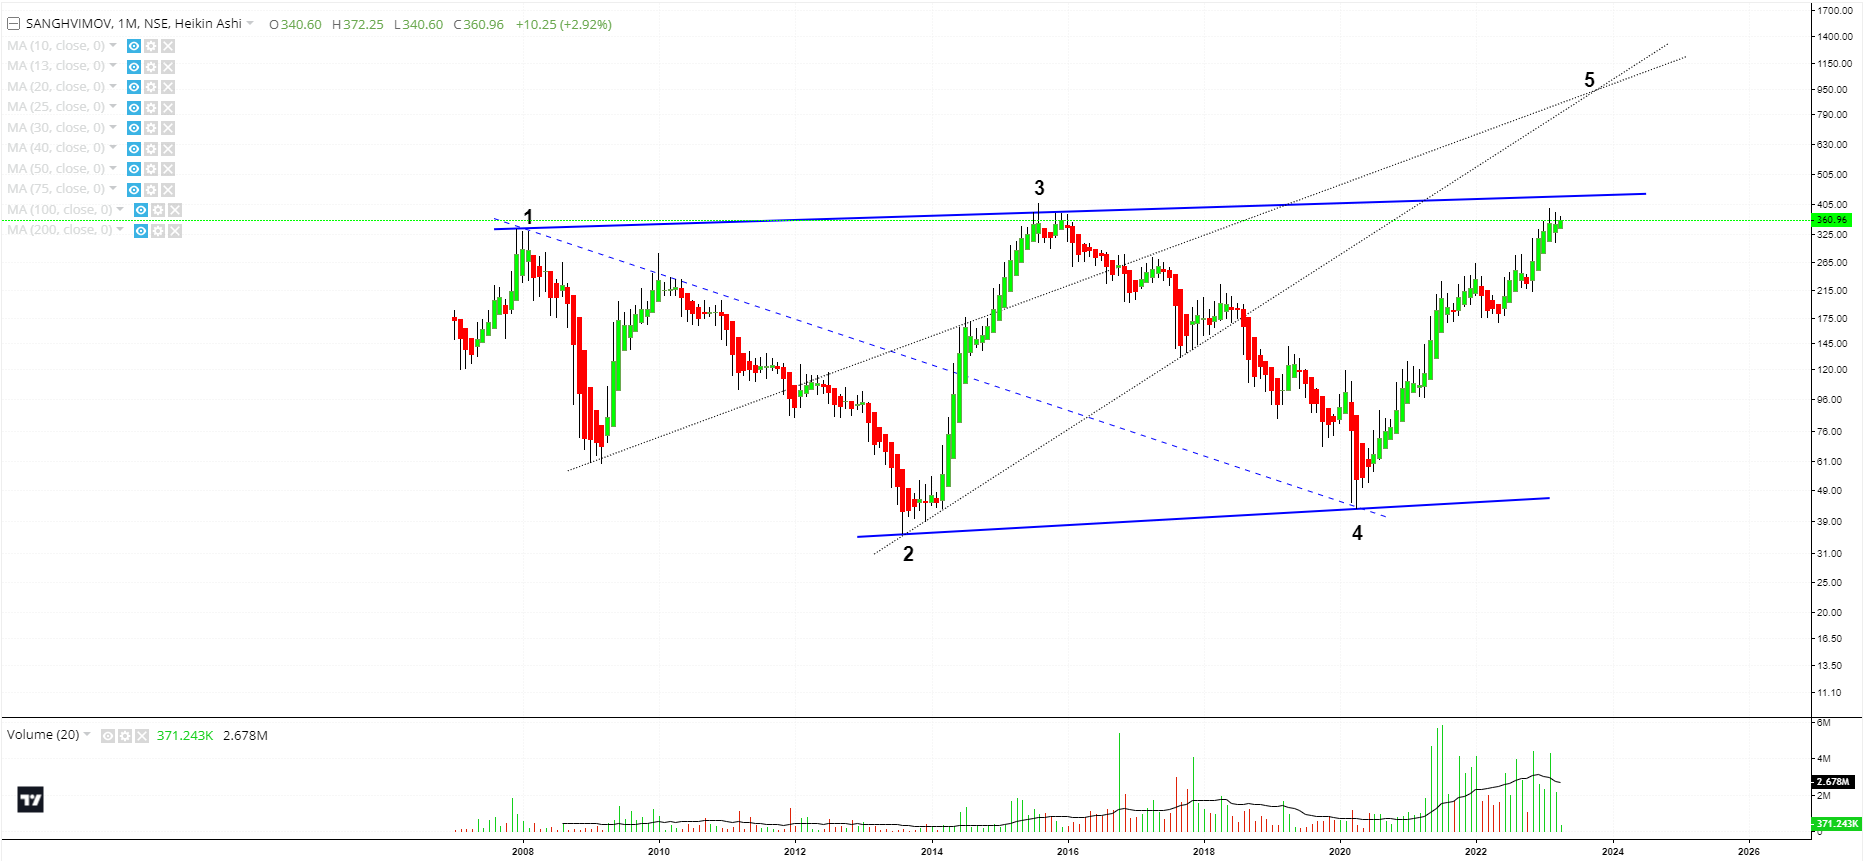
Disc: Biased, invested, not a buy/sell reco, new to TA and learning.
7 Likes
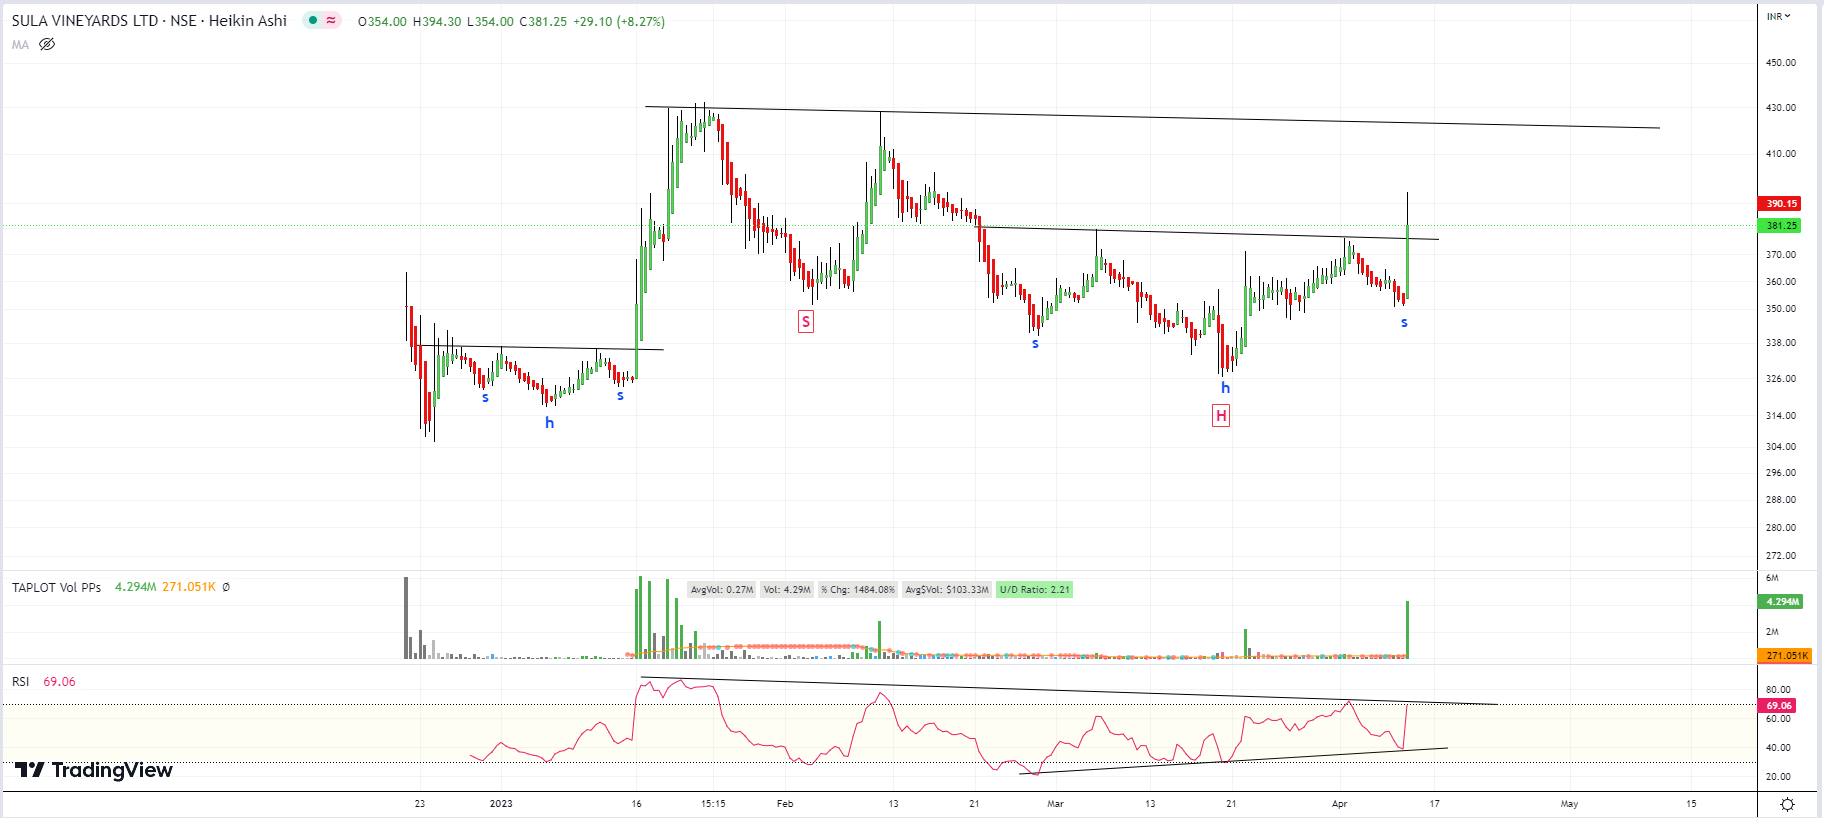
An interesting Fractal Pattern playing out in SULA vineyards:
- Multiple Inverse H&S patterns, smaller ones broken out, larger one possibly forming. Recent IPO, so its a 3HR chart:
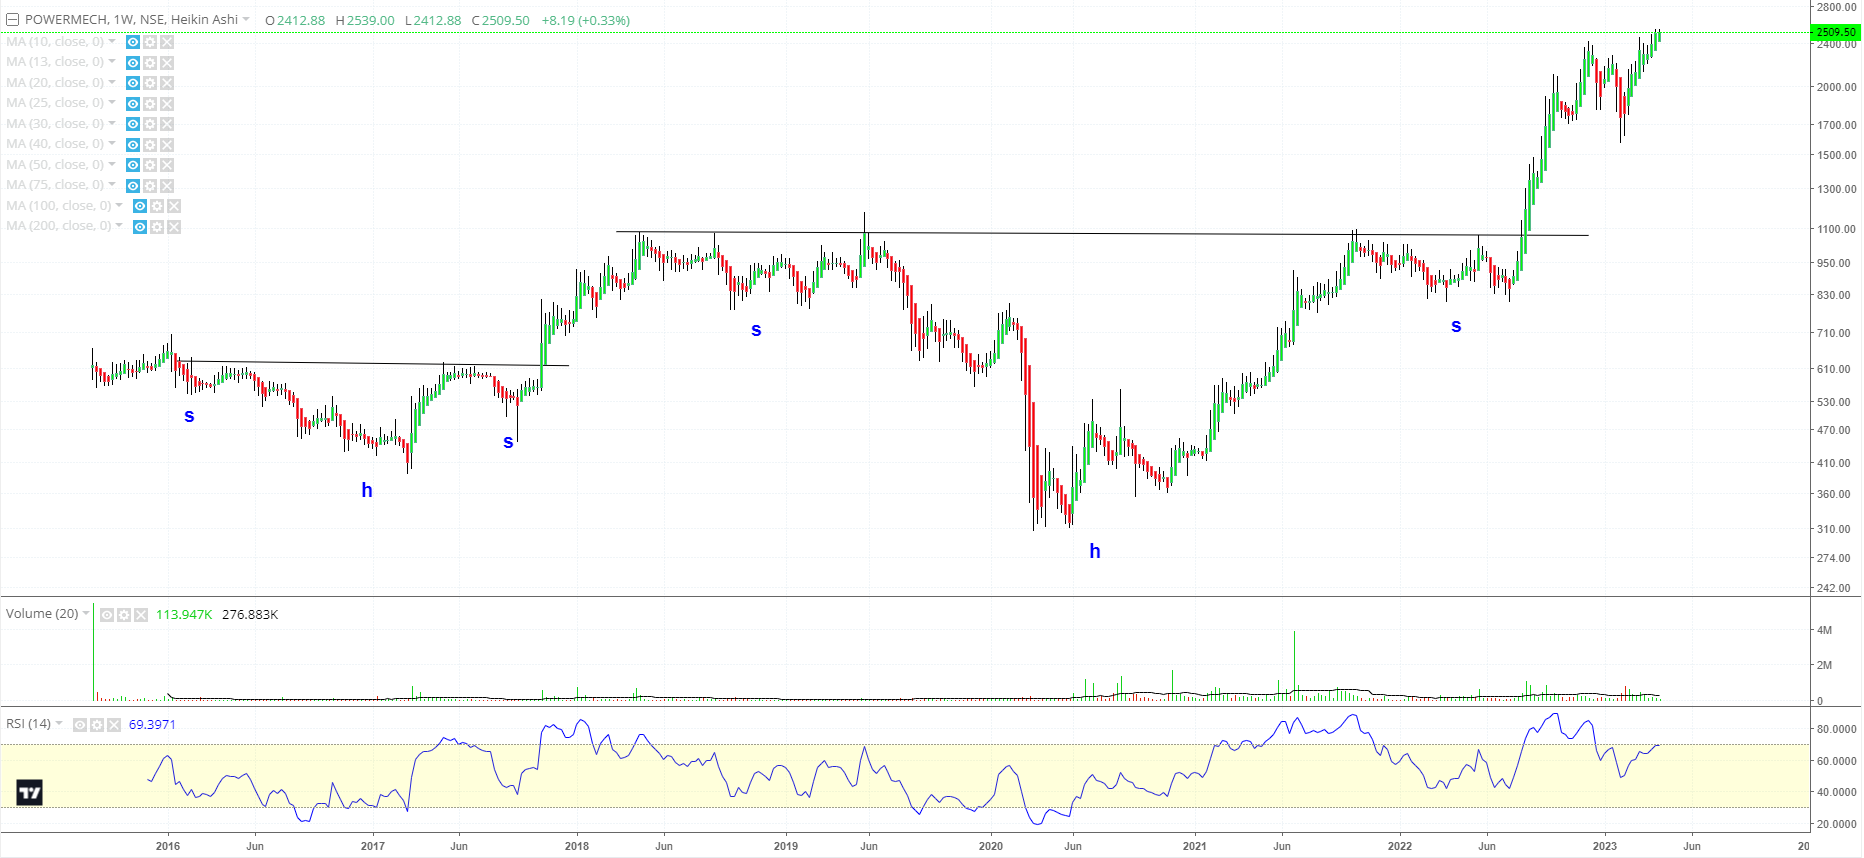
- A similar Inverse H&S fractal played out very well in POWERMECH Projects:
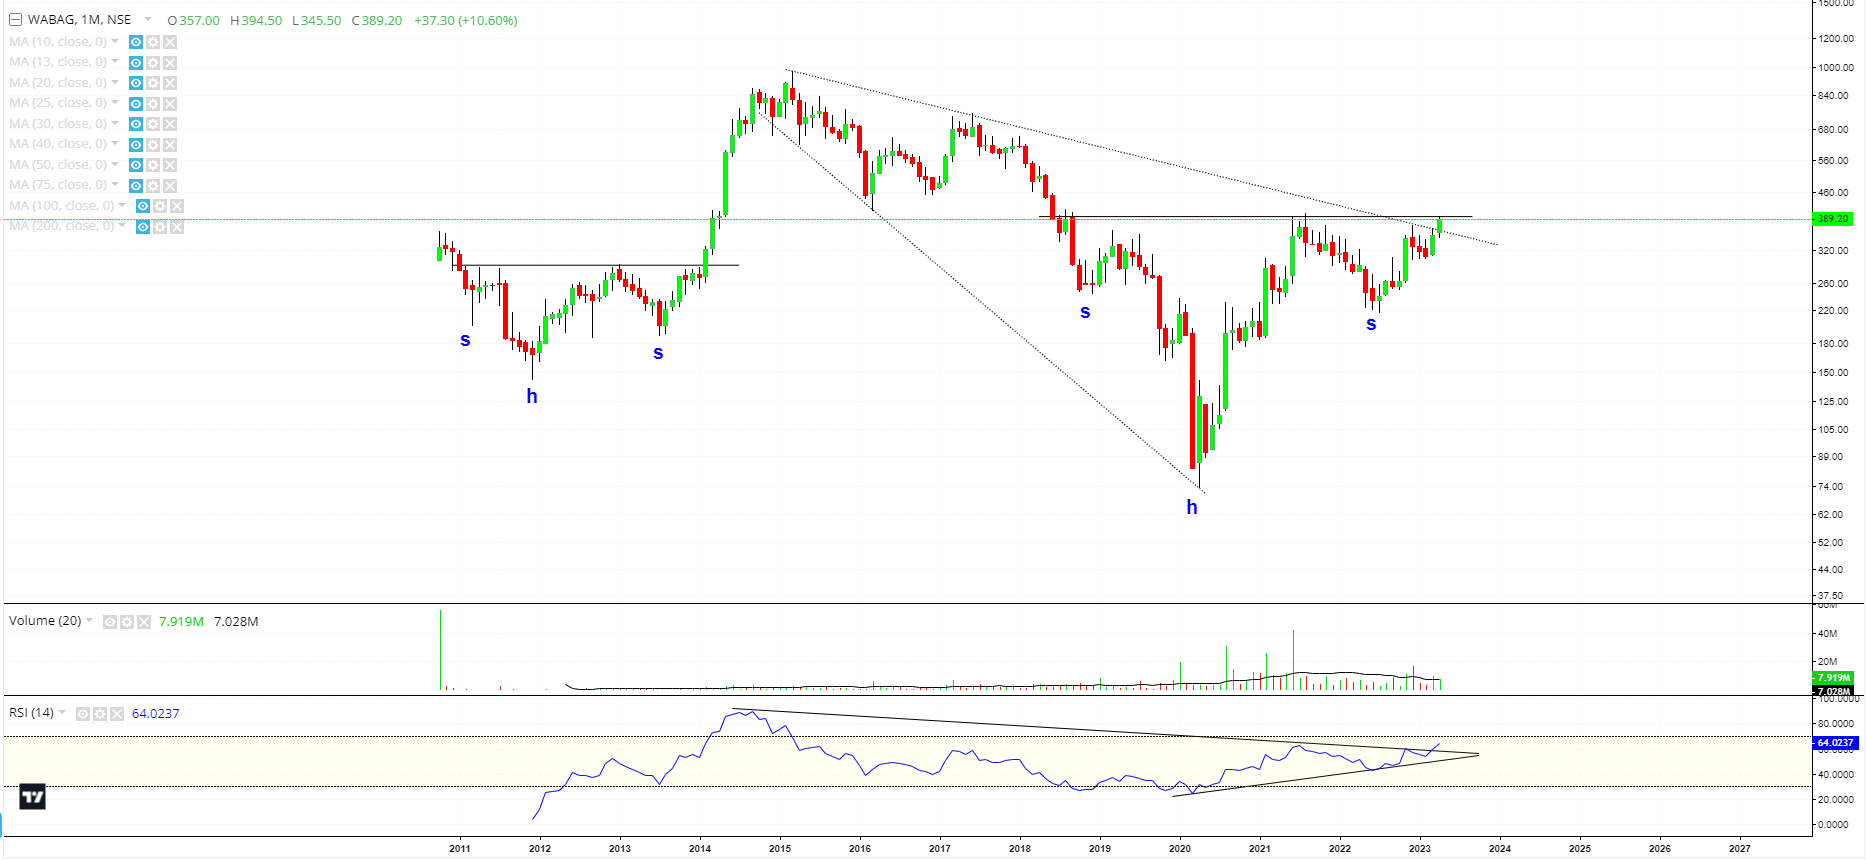
Another example to highlight Fractal nature of patterns playing out is in Va Tech Wabag weekly chart,
- Multiple year Inverse H&S patterns formed. The previous (2010-2014) broke out and gave an excellent move, the current (2018-2023 on going) is nearing breakout.
- An excellent downward broadening wedge pattern can also be seen, and has given a breakout.
- RSI breakout as well.
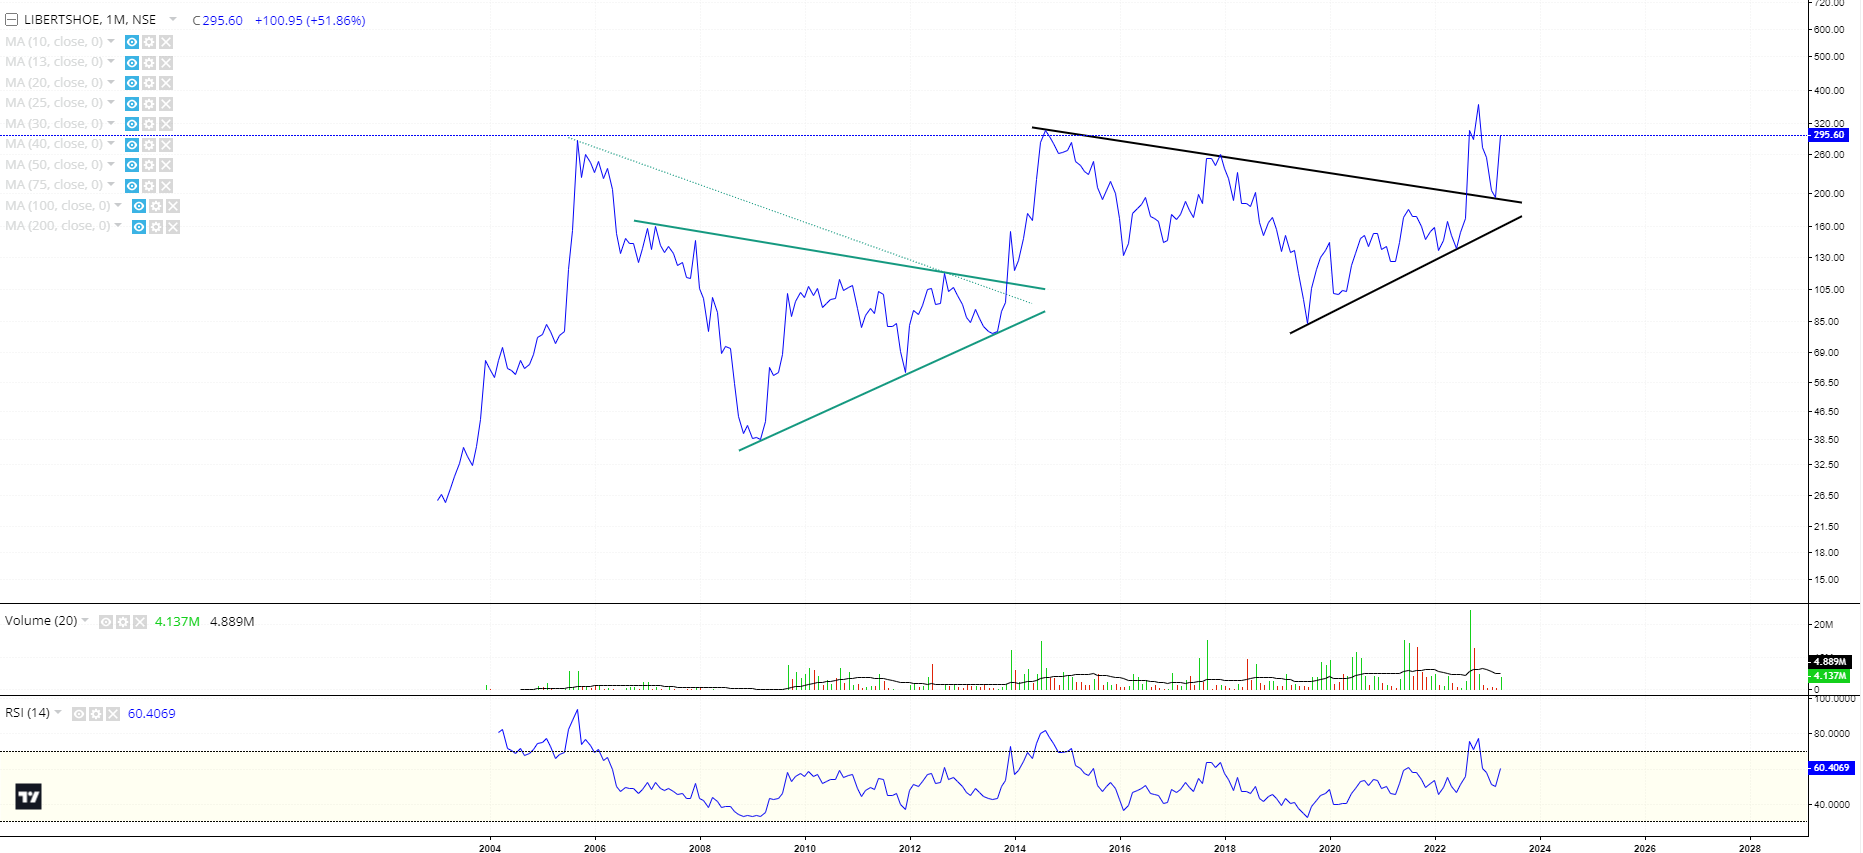
Another example of Fractal Nature of patterns, Liberty Shoes.
- Multiple Multi Year Symmetrical Triangle formations and breakouts,
- (Green) triangle led to a big move post breakout,
- (Black) triangle, and given a breakout and a beautiful retest on low volumes and risen up again.
1 Like
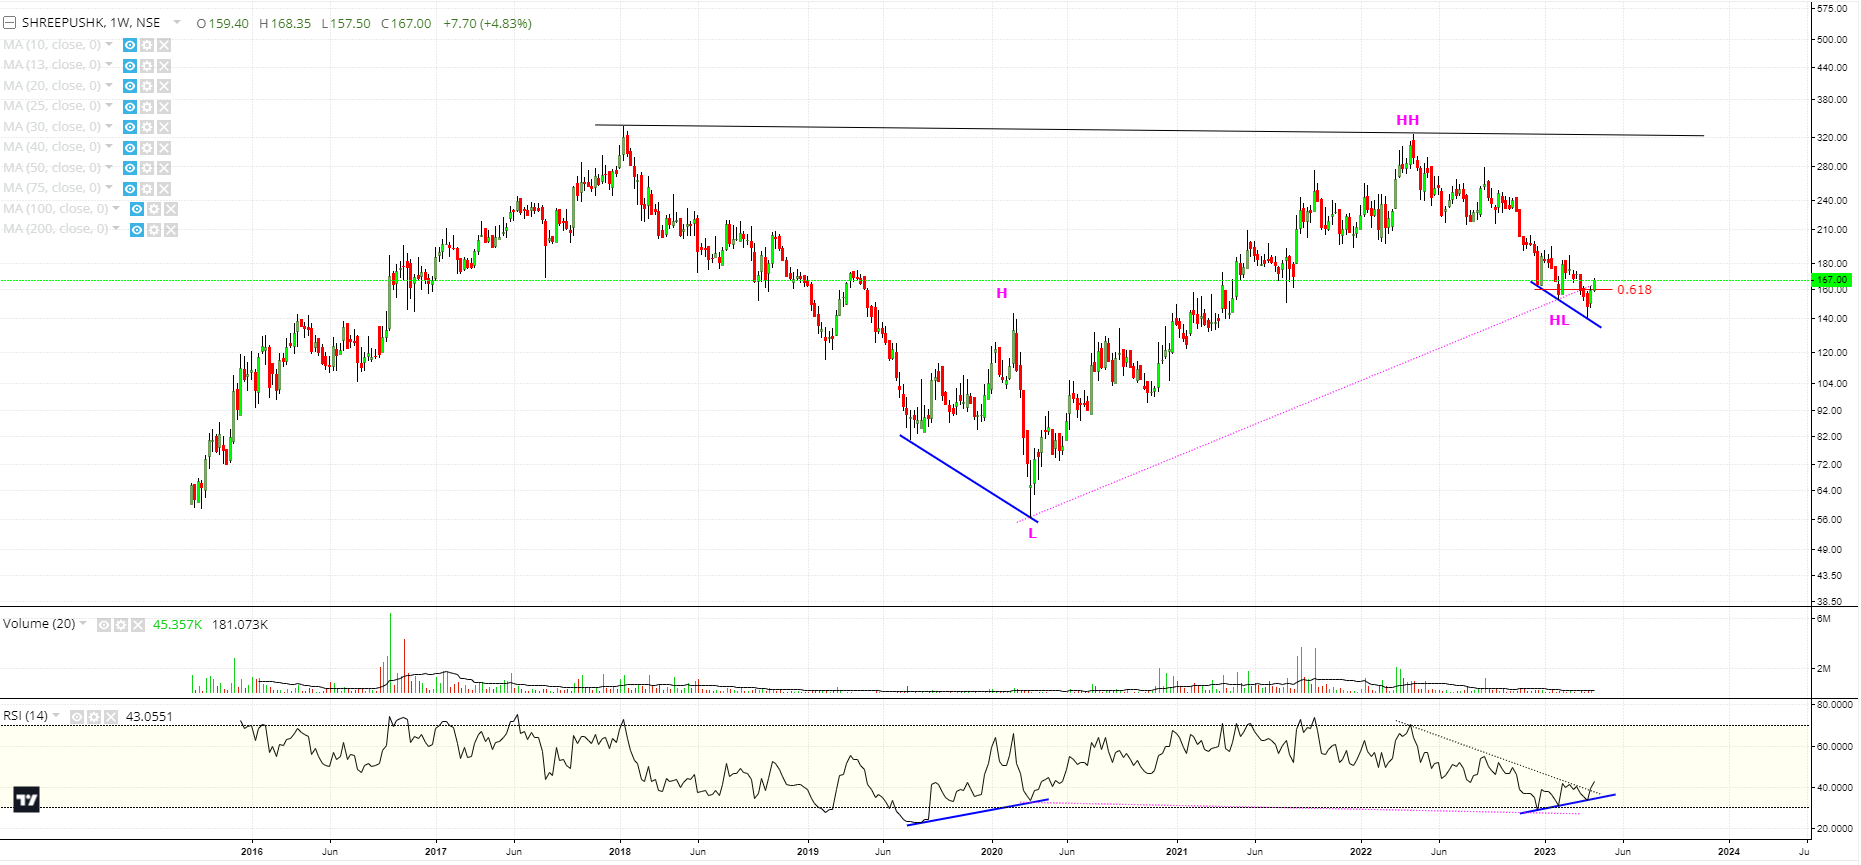
An interesting Chart which is displaying multiple bullish signals:
Shree Pushkar Chemicals: - Weekly Time Frame:
- The chart is showing a Positive RSI divergence, similar to the one seen previously, after a big drawdown (blue lines).
- The current divergence is being formed also near the Fibo 0.618 retracement level.
- There is an interesting HL, HH-HL setup which is also indicating a Hidden Bullish Divergence (Pink dotted trendline)
- A multi year Cup & Handle also seems to be forming.
Experienced TA forum members can comment and share their learnings and insights.
2 Likes
Closely following discussion here. Would like to have views on chart patterns in Royal orchid hotel, following its breakout on 20th April. I am invested in this stock and feel bullish here on fundamentals.
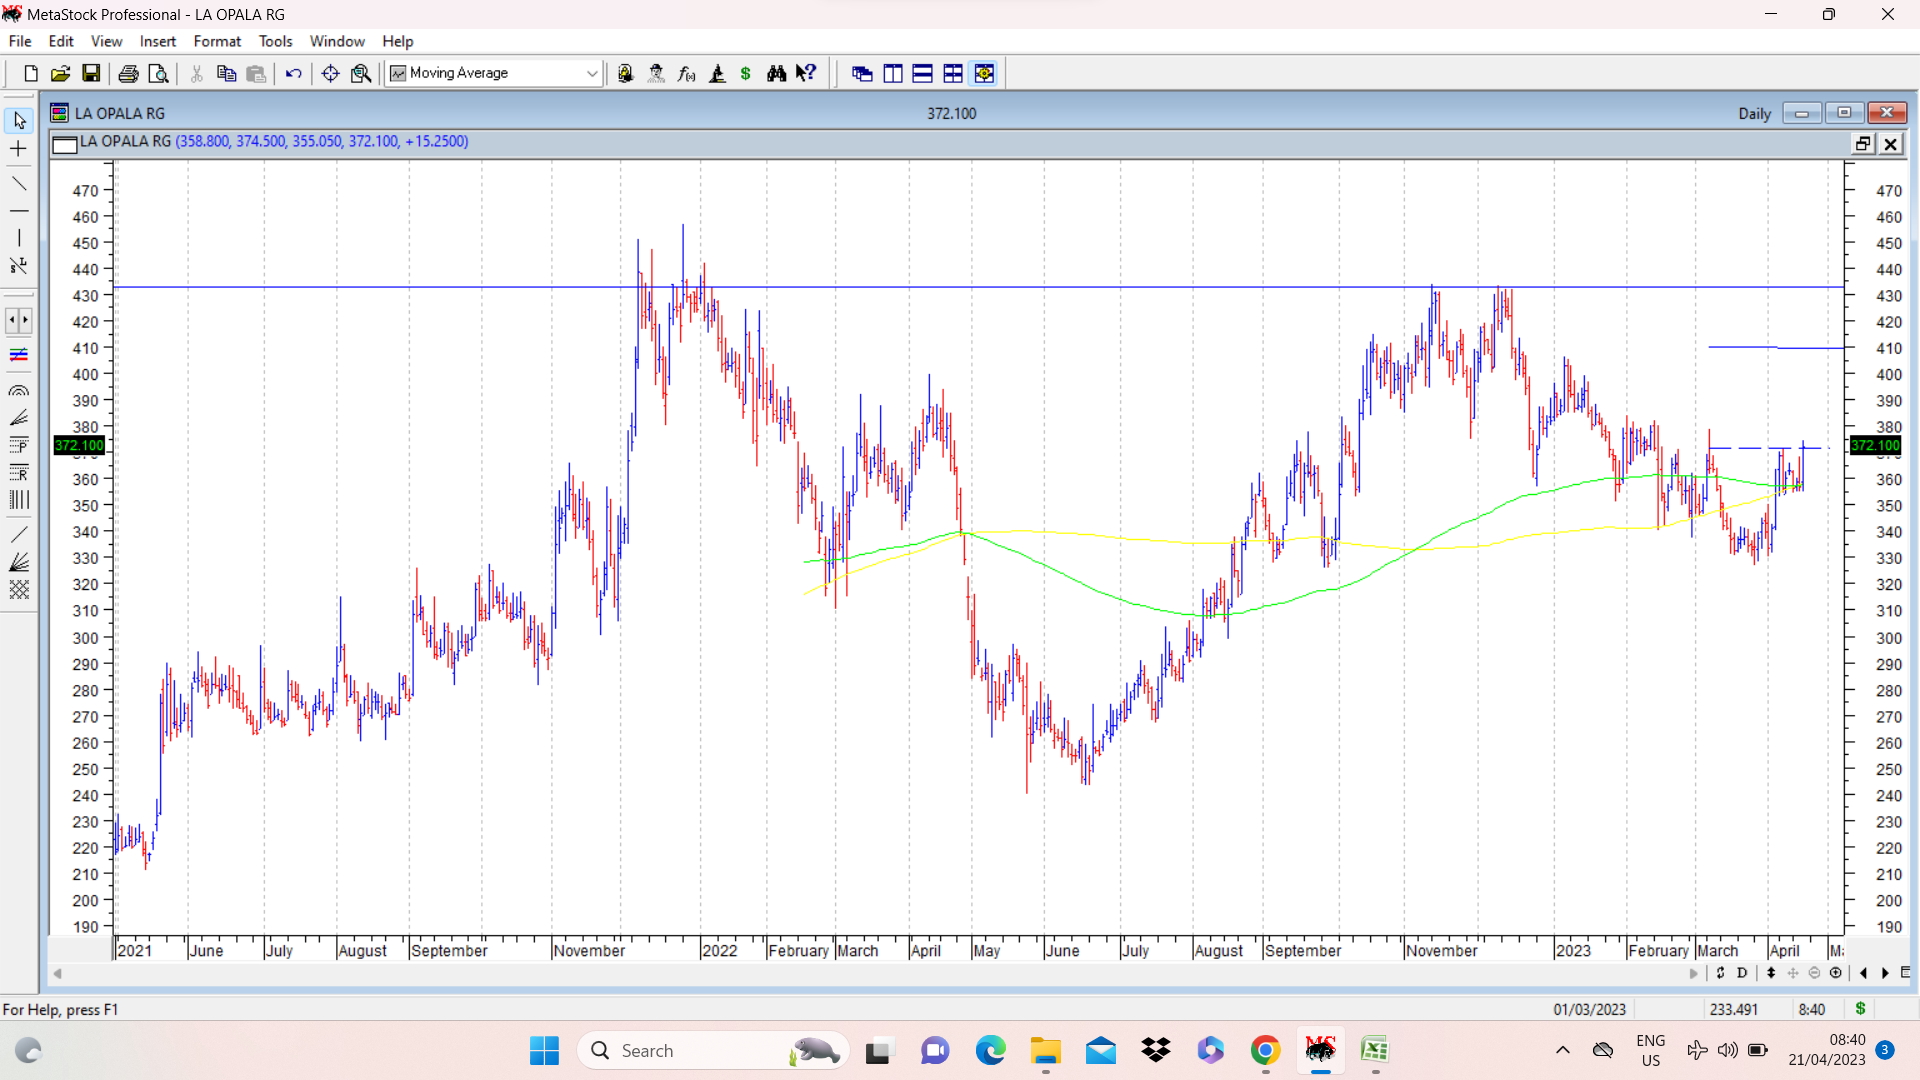
La Opala chart posted below shows a small cup and handle breakout on daily charts with potential targets of 410. If it can cross and trade consistently above 430-440, then a bigger cup and handle pattern comes into play with potential targets of 600. Its an example of pattern within a pattern.
Fundamentally the fruits of capex incurred are to accrue fully over next few quarters.
disc: no positions, posted only for academic purposes. stock remains in watchlist.
12 Likes
VBL has been a rank outperformer during the last few months. In the weekly candlestick chart attached, we can see clear negative divergence where stock price keeps making higher tops and RSI keeps making lower tops (marked in red lines) . Also to be noted is the characteristic of candlesticks in last 3 weeks where we see Doji and other bearish candlesticks… disc: no positions. posted only for academic purpose.
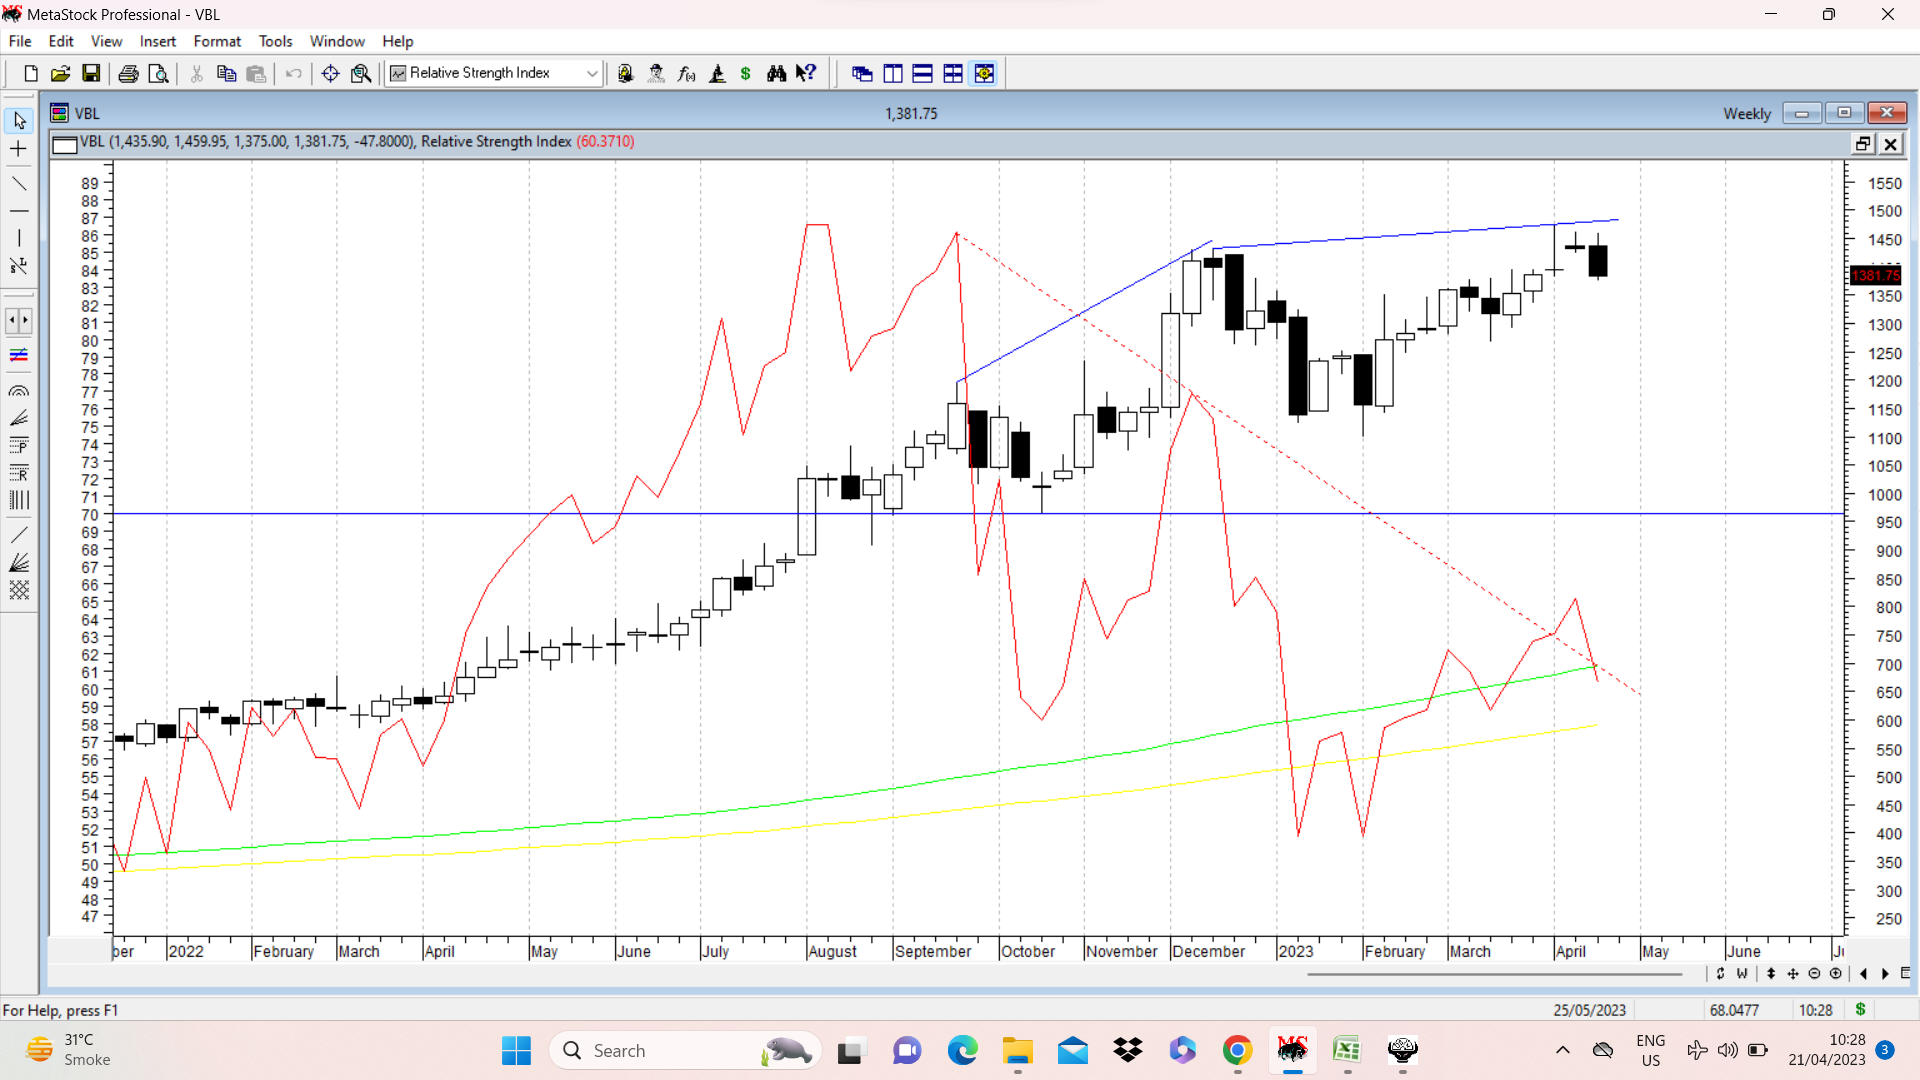
15 Likes