POSITIVE DIVERGENCE ON RSI.
Here typically after a prolonged fall (usually in weekly charts, where it has more significance), stock price keeps making slightly lower lows (not drastically big cuts) successively for a few weeks… And all throughout this process, the RSI keeps posting higher lows…
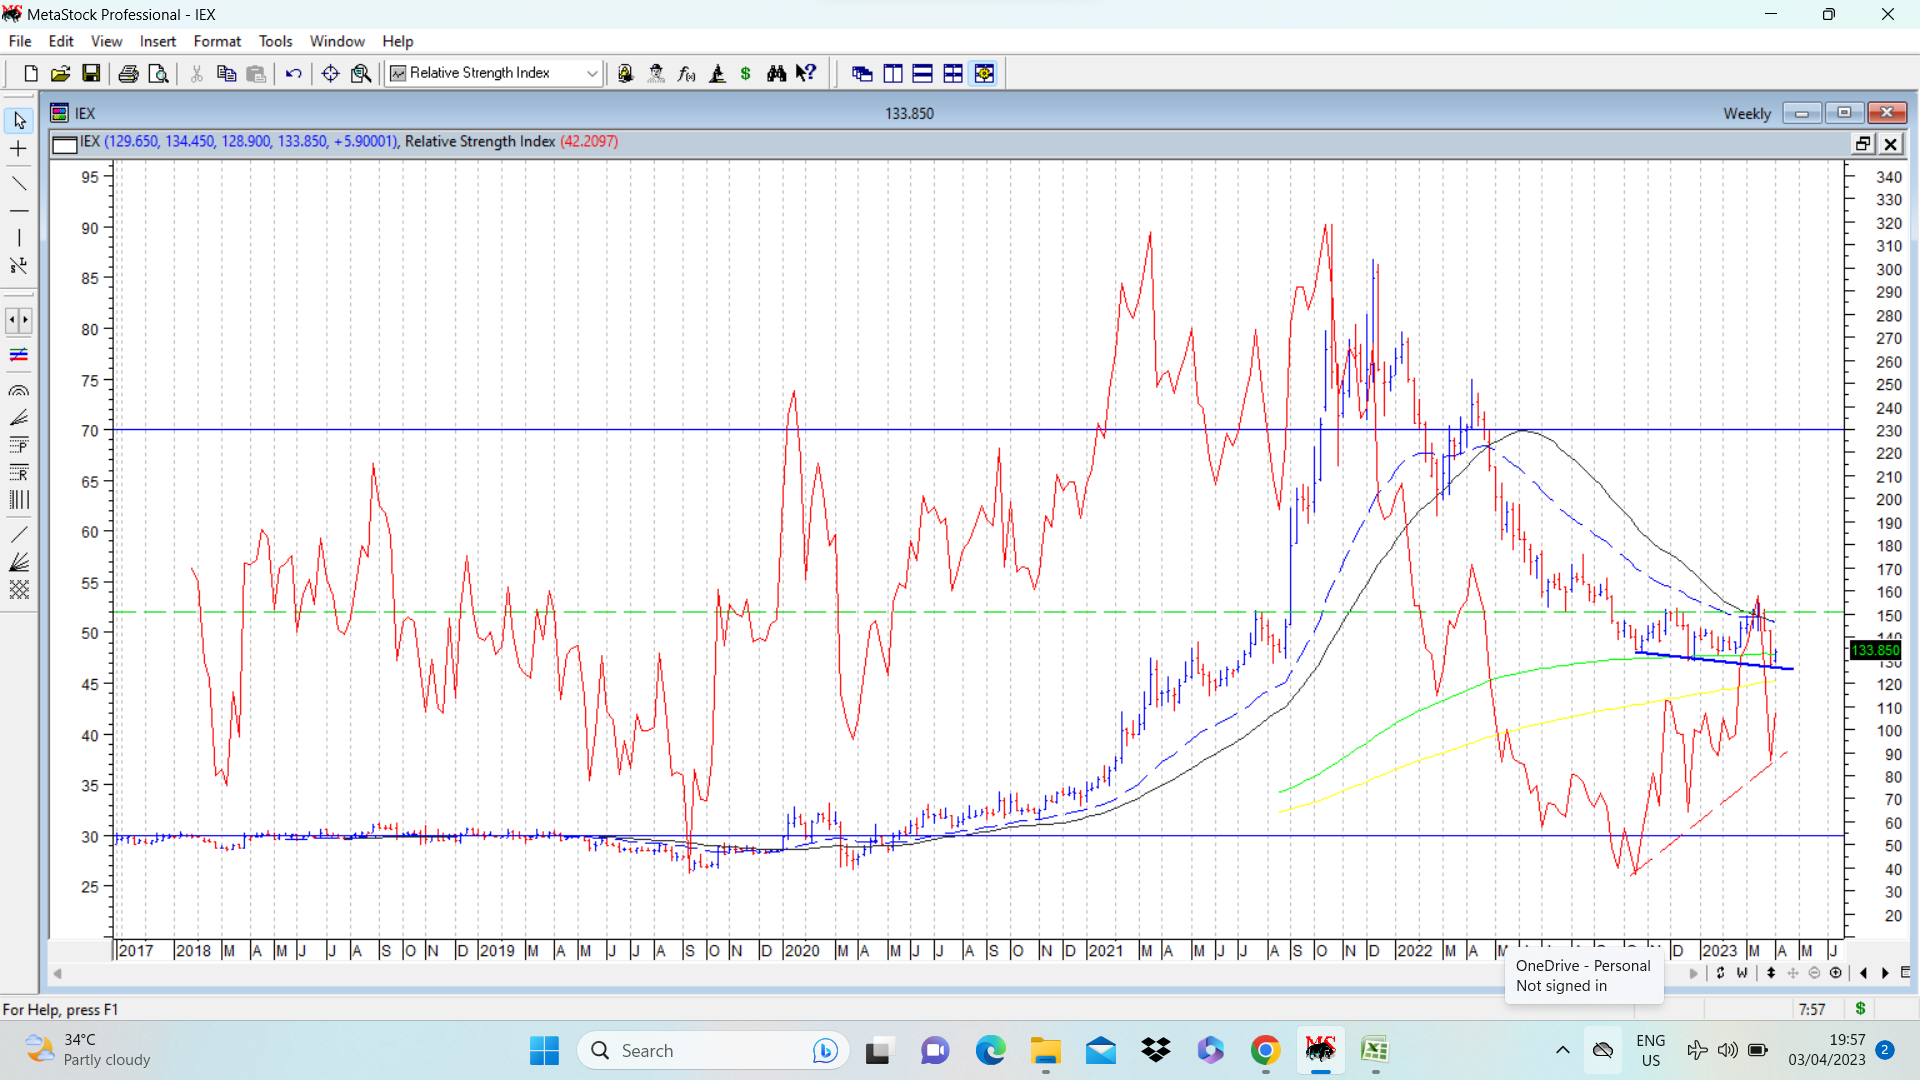
In the attached chart of IEX, (much talked about recently due to stake sale by Dalmia group) , weekly chart shows lower lows as marked by bold blue lines and during that process, RSI shows higher lows (marked in red dotted lines)…
In situations like this, it makes sense to look out for signs of bottoming out and keep this company on the watchlist.
Important resistance to keep a note of is levels of around 151, crossing which enhances bullish undertone. Marked in dotted green lines… disc: no position, but in watchlist.