@hitesh2710 Sir, Please advise on the chart of Sunflag Iron and Industries as it is trading at 52 week as well as all time high levels.
Previous high of Rs 130 has been broken with volumes…can we call it as a break out
Further, Company has also recently received arbitration award of Rs 900 Cr…Company has CWIP of around Rs 450 Cr likely to be commissioned in next 6 to 9 months and hence if it is a break out then it fundamentally in can be sustainable.
Sunflag Iron has broken out of a good rounding bottom pattern and in the process has cleared its previous all time highs. The beauty of rounding bottom patterns is that while going up the stock price goes up in a calibrated manner, digesting selling pressure from time to time of sellers trapped at each level. And on breaking out above the top of rounding bottom, most of the selling is absorbed, and hence upmoves can provide good quick upsides.
Usually targets are calculated by calculating the distance of rounding bottom from top to bottom and adding to breakout level which is the top. Since rounding bottoms take a long time to form, achieving targets can also take time and hence one has to be patient. And another aspect to consider is sometimes stocks correct from exact top of rounding bottom, undergo slight retracement and form a handle like pattern to finish a cup and handle pattern.
Stock price had reached swing high of 600 in most recent upmove and corrected from there to post swing low of 525 and on the back of good results today, went up and closed at 556, having made an intraday high of 562.
Interesting to note a very classical rounding bottom formation which has a top at 925 and low at 311. Post its lows, it started moving up and the best possible entry point was at dotted green line which was early stage of rounding bottom, where typically stock price is well above 200 dema, and 200 dema is starting to trend up and stock price is above important pivots of 460. After rallying from 460, it crossed an important previous top at 533, hit a swing just above it at 543 and corrected to take support at previous resistance region of 460. It started a fresh upmove from here and took out the swing high of 542 and went on to hit a high of 600 and corrected and took support at area of previous resistance of 533. (usually it is plus or minus a few rupees) It seems to have turned up from this region and we need to see how it behaves now onwards. Most important feature has been the positive response to reasonably good results.
Marked on chart is a possible resistance zone between dotted red lines and possible aspirational targets marked in dotted blue lines, above 600.
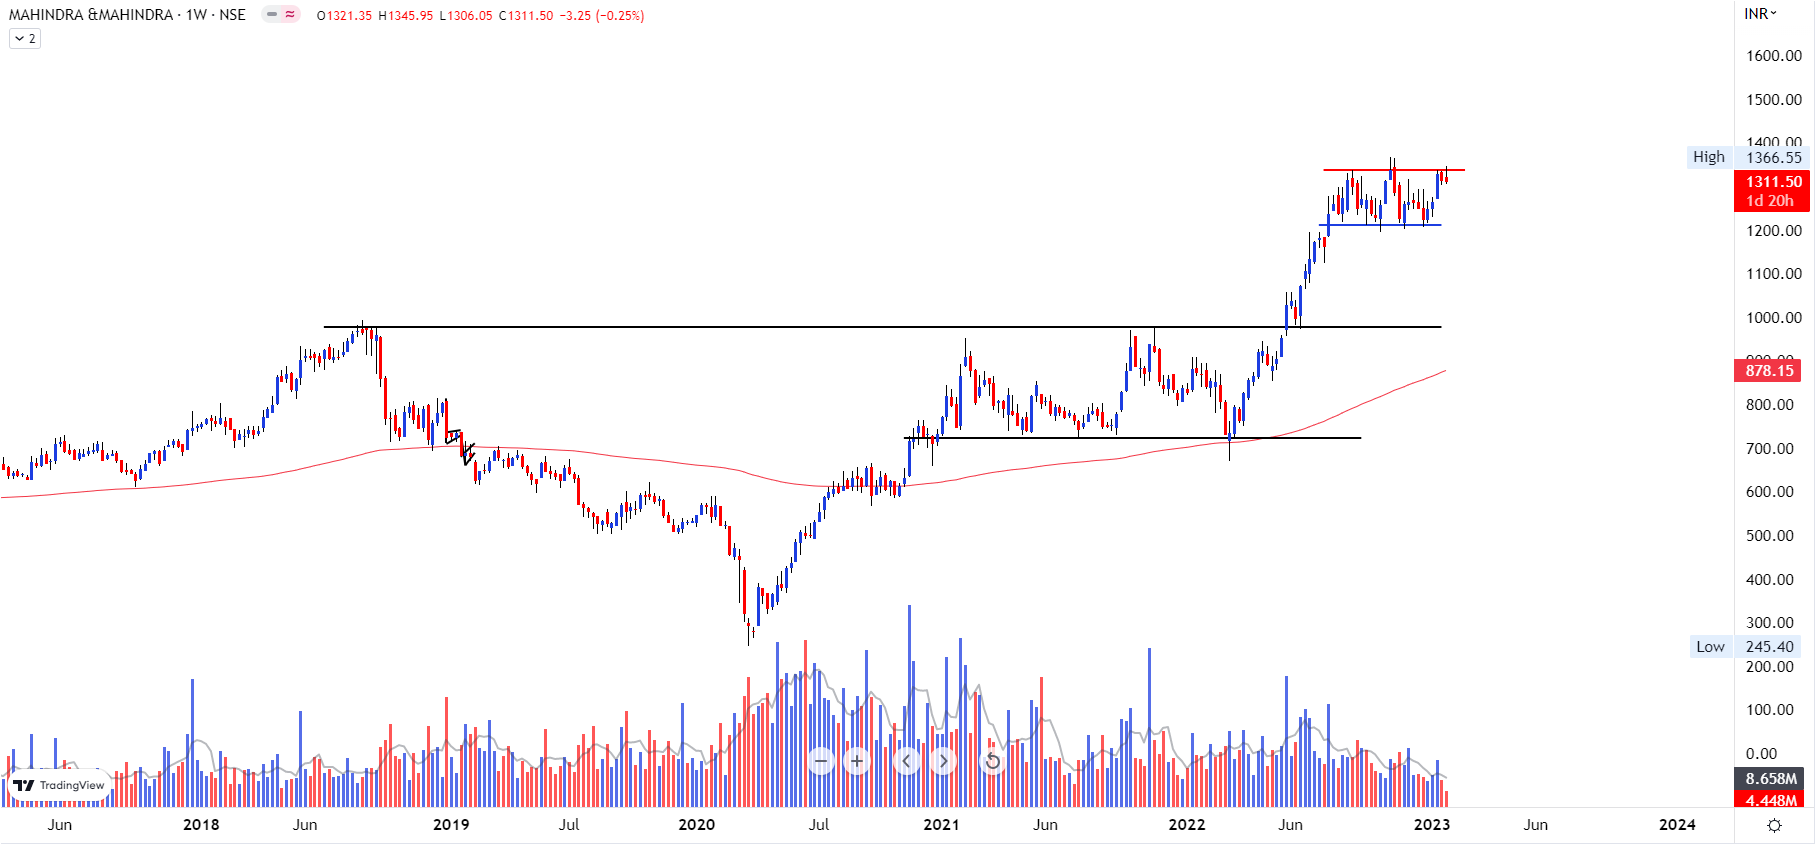
As already mention stock break 52w High and auto index is trending and as expect move and stock made high around 1366 and currently again stock trading in narrow range 1200 to 1350 range once crossed the high 1366 and sustain above it then next level to test 1500 1550 1600 , Also Q3FY23 Maruti result & Bajaj auto result we see margin improvement so coming quarter looking good for auto if no any external ( global ) issue arise
Disc: Now not holding this
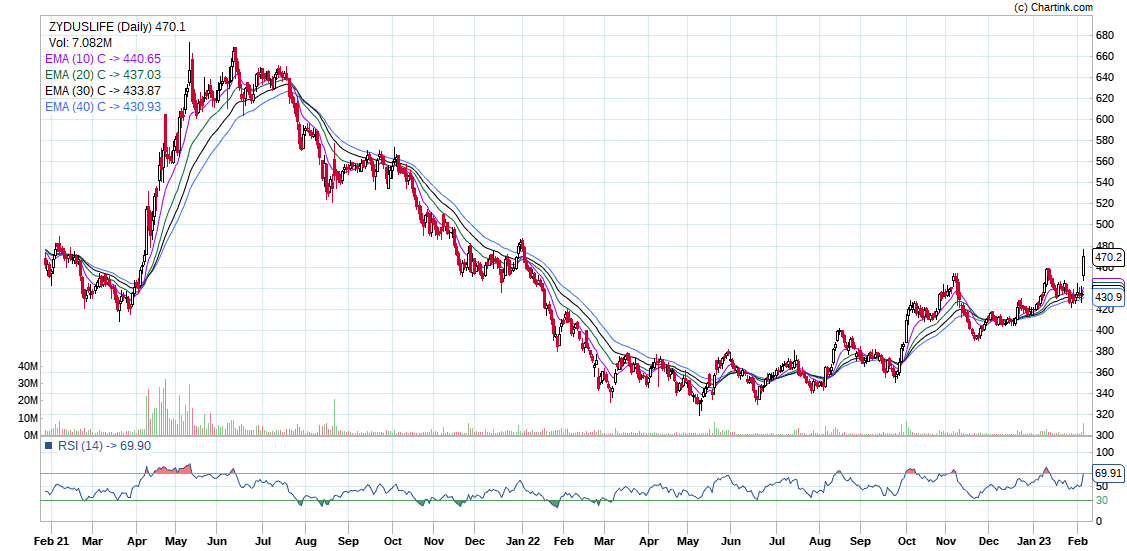
Zydus Life:
Company came up with good results. The share price crossed previous high and made 52 WK high after some days, with good volumes. The charts show rounding bottom formation over weekly/daily time frame over the last 2 years.
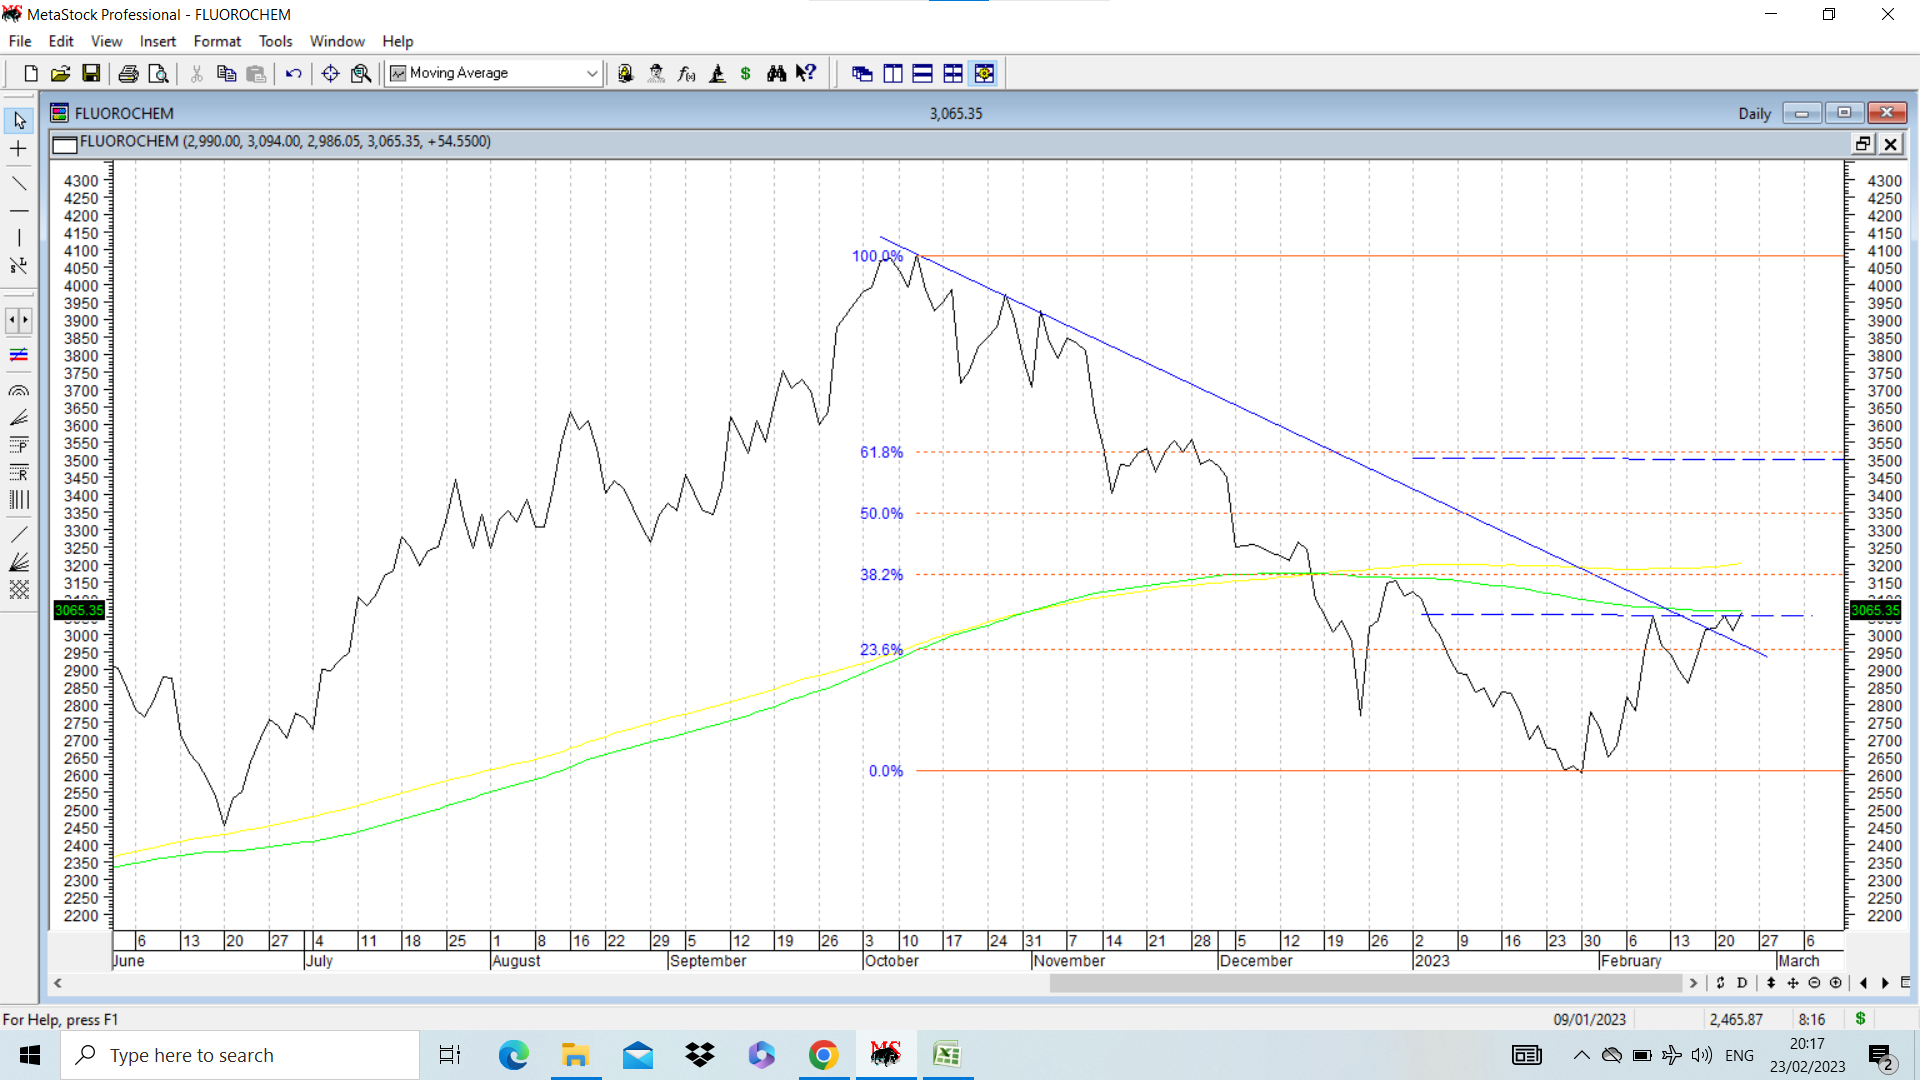
Fluorochem came out with results today with good growth y on y and flat (marginally negative) on q on q basis. Management has explained subdued demand due to winter in European geography.
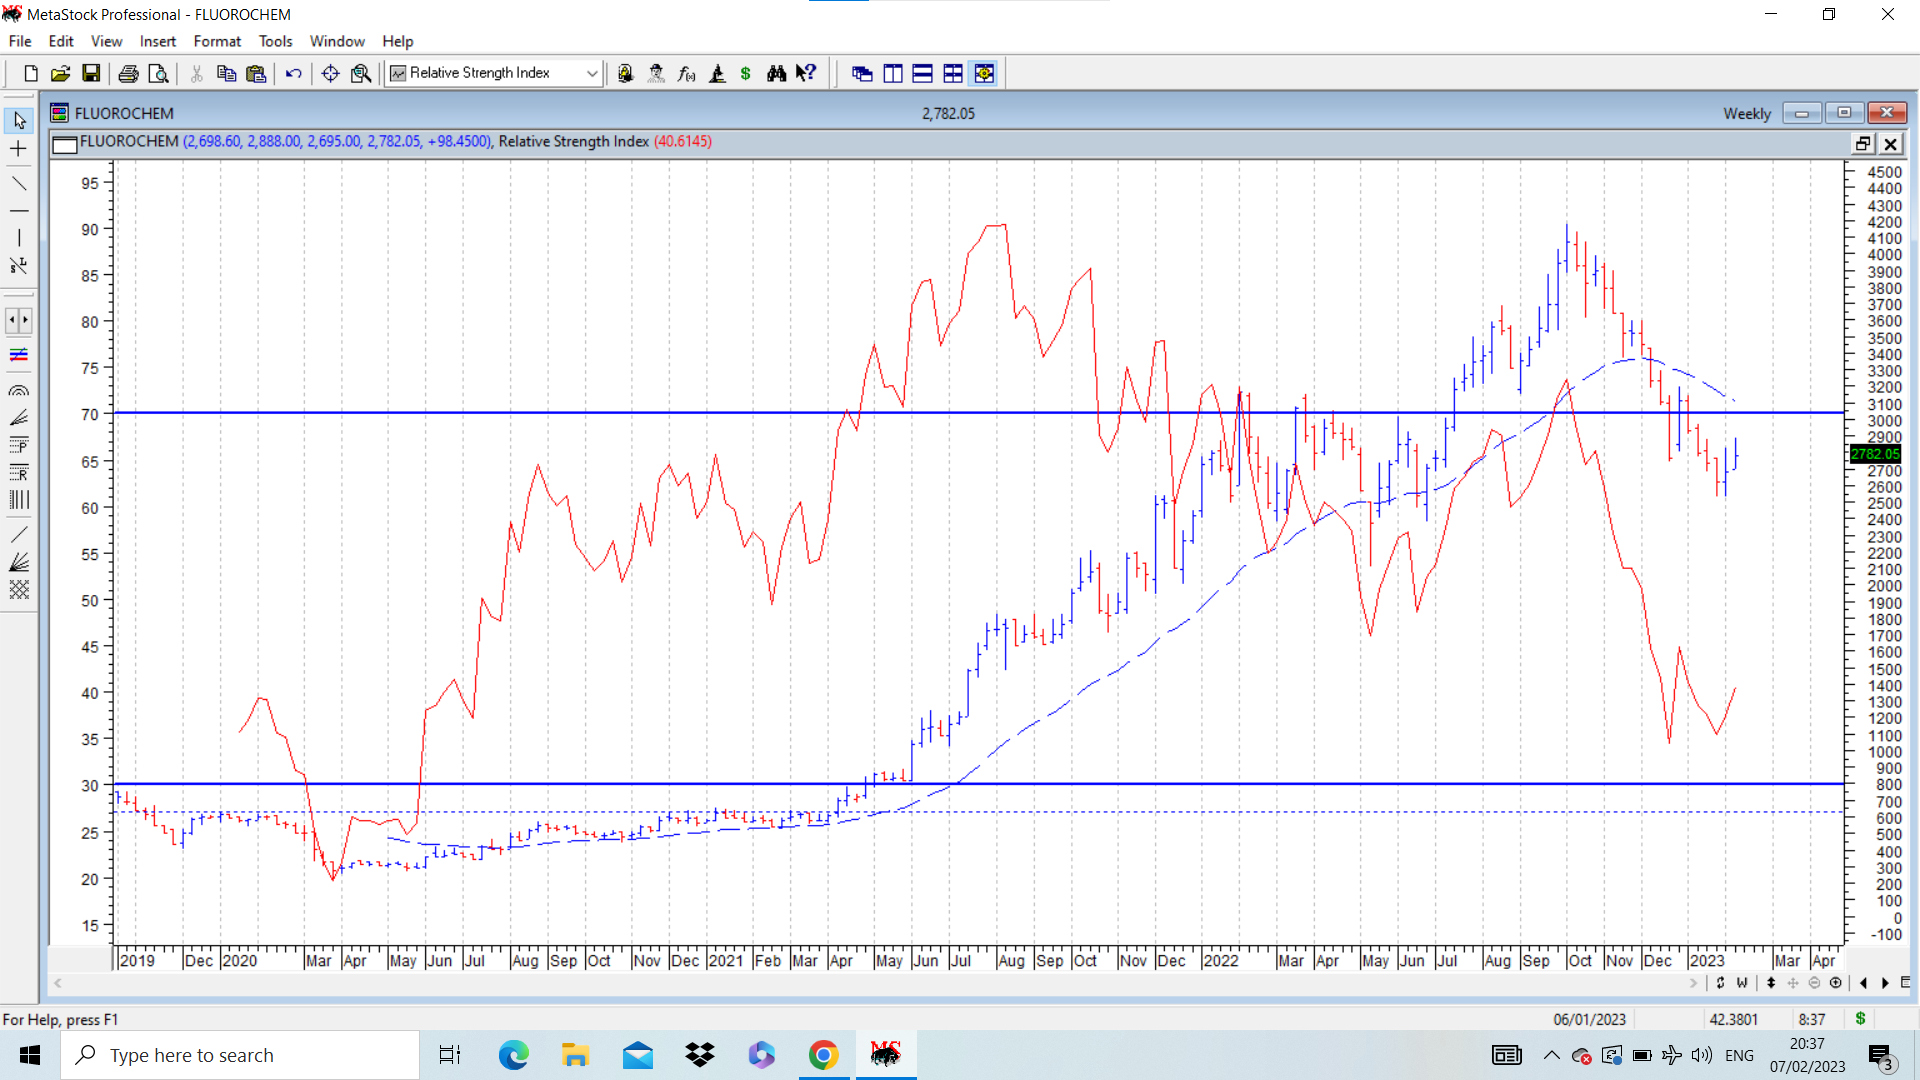
Fluorochem weekly chart. negative is stock price is well below 30 WEMA at 3115 and the avg is pointing down. Positive is the positive divergence seen in charts on RSI… When bottom of 2740 was made in Dec 22, RSI was 34.54. Recent bottom was made at 2534, lower than earlier low, but recent RSI was 35.45 which is higher than earlier RSI bottom. This positive divergence on weekly chart is often (though not always) an early indication of a bottom formation. And when this happens at levels that are important in terms of retracement, support ( usually previous zones of consolidation), then it assumes significance. For trend followers, it makes sense to buy once stock goes above 30 WEMA and the moving avg also turns up. For those who know their company and are confident about fundamentals for next few quarters and are ready to bear range bound moves in the stock price, current price or lower with stop loss of 2534 may be good enough to take/accumulate position. Though they might need patience. disc: invested as disclosed before.
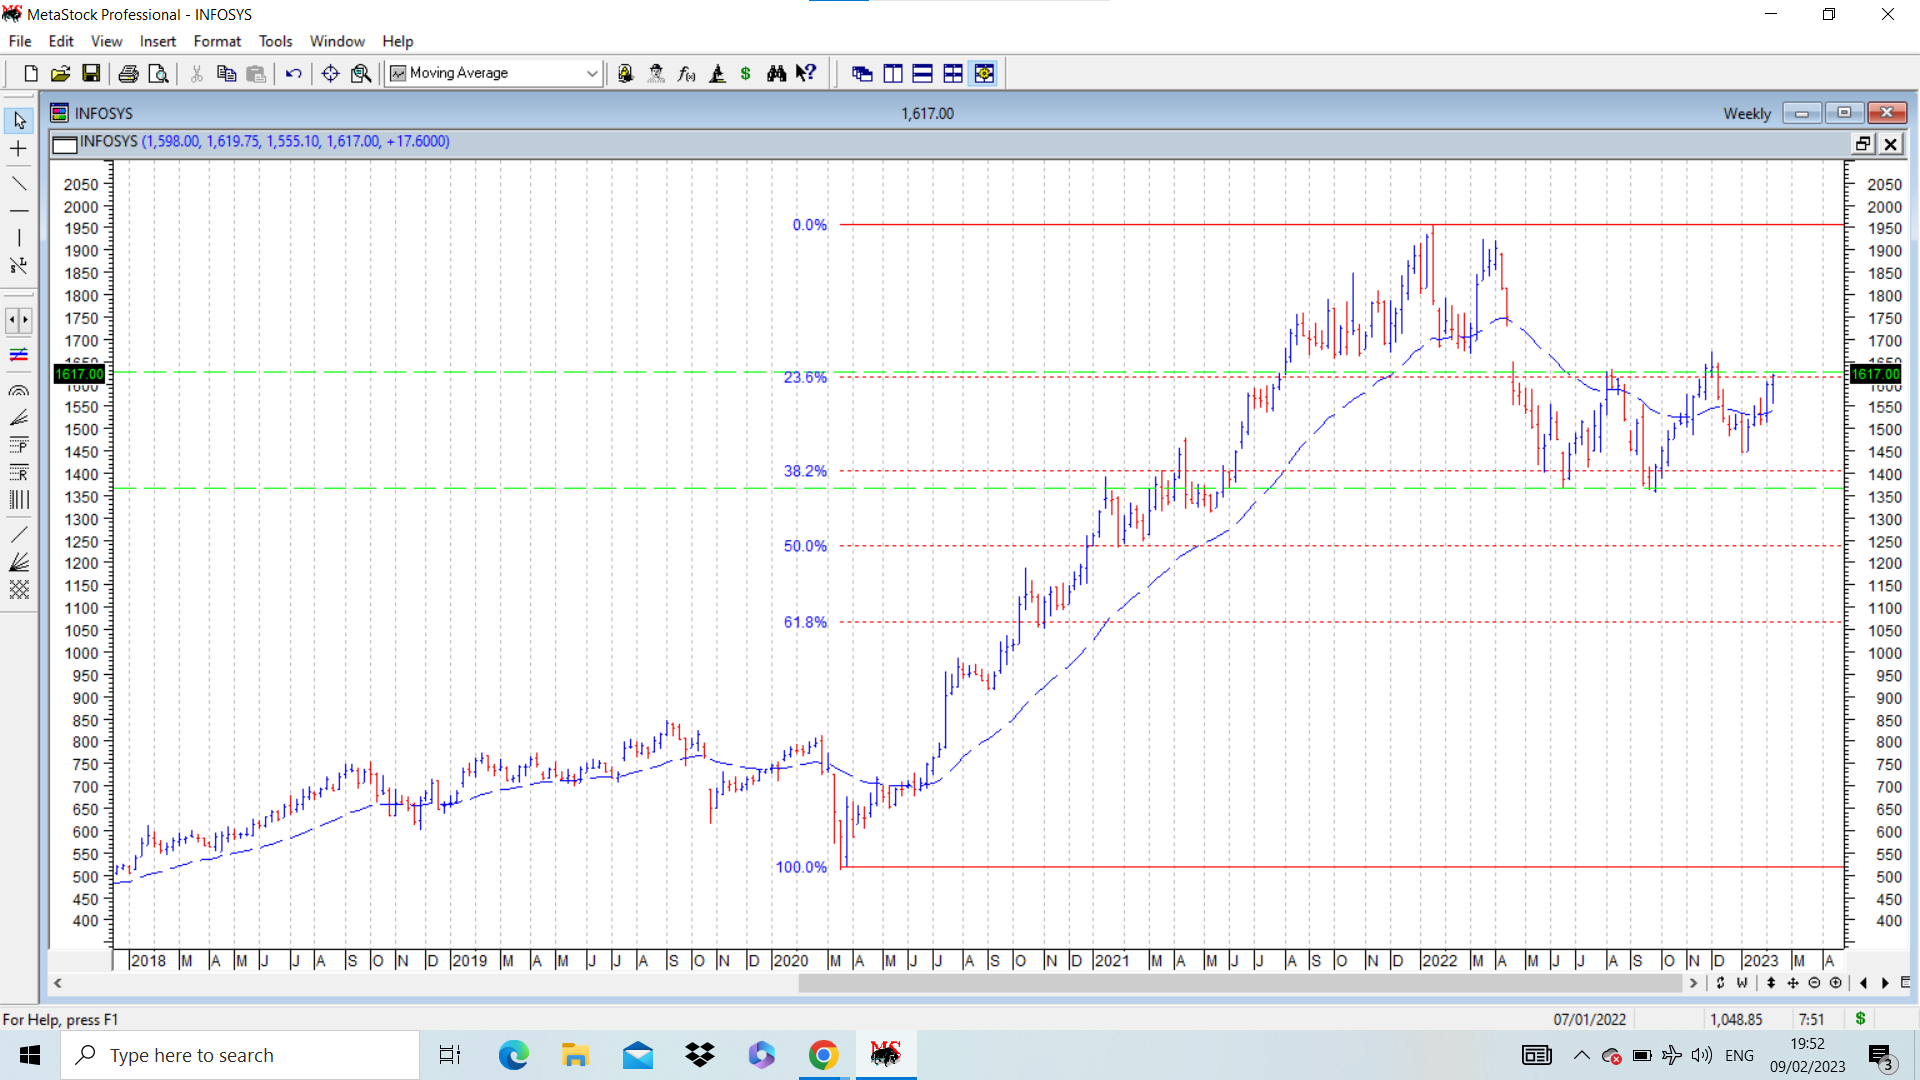
Putting up weekly chart of INFY. It comes across as one of the strongest stocks in large cap IT pack mainly because it corrected the least in the IT meltdown seen in past few months. It retraced only 38.2% of its entire rise from 510 in March 2020 to 1950 in Jan 2022, a rally lasting nearly 22 months. It posted a double bottom at 1350-60 levels and confirmation of this double bottom break out will come once it gets above 1625-30 and stays or moves above that. Double bottom in chart is marked by dotted green lines. Dotted red lines represent retracement levels. Dotted blue line represents 30 week moving average which has now flattened after remaining declining during the correction.
Near term resistance can be expected between 1727 to 1650 which is the area of a weekly falling gap.
Double bottom breakout target is 1885. All time high posted during previous major rally is 1950. These are key levels to watch. disc: no positions, but in watchlist.
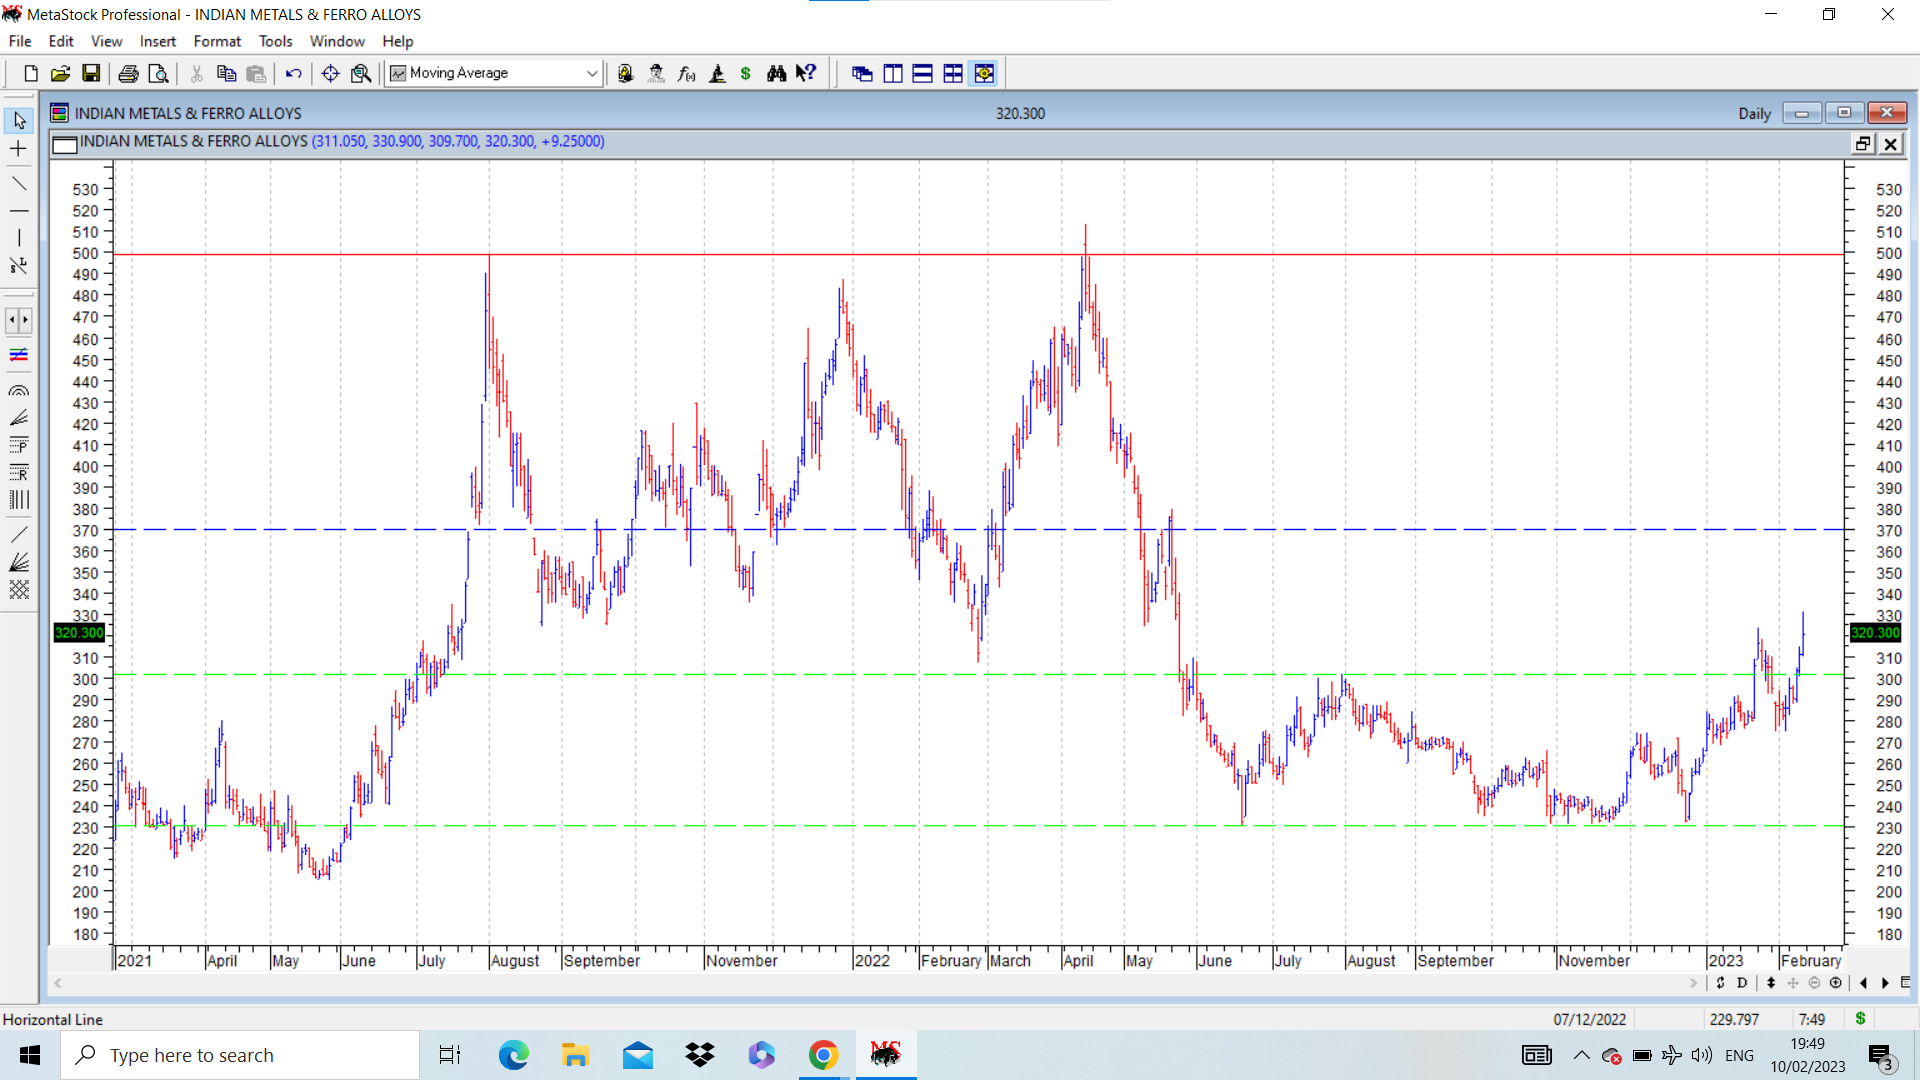
IMFA - Indian metal ferro alloys is a steel ancillary play, with leadership in ferrochrome production. With China opening up post Covid lockdown, the demand and prices for ferrochrome has seen strong rebound. This is a purely cyclical play and one has to play it accordingly. These kind of stocks have a definite buy and sell price which have to be adhered to.
On the charts, stock formed a double bottom at around 230 (shown in dotted green lines) and intervening peak was at 301. Stock price crossed this peak in Jan 2023, and posted a swing high of 323 and then underwent a daily correction and went down to retest breakout zones and posted swing low of 275 and rebounded and today crossed previous swing high of 323 to post a fresh swing high of 330. CMP at 321.
Target if double bottom plays out successfully would be 370 (shown in dotted blue line) . Major resistance above it is at levels of 500 (shown in solid red line) where there are previous major peaks.
disc: invested as a techno funda bet. (not a recommendation, please do your own diligence if you buy it)
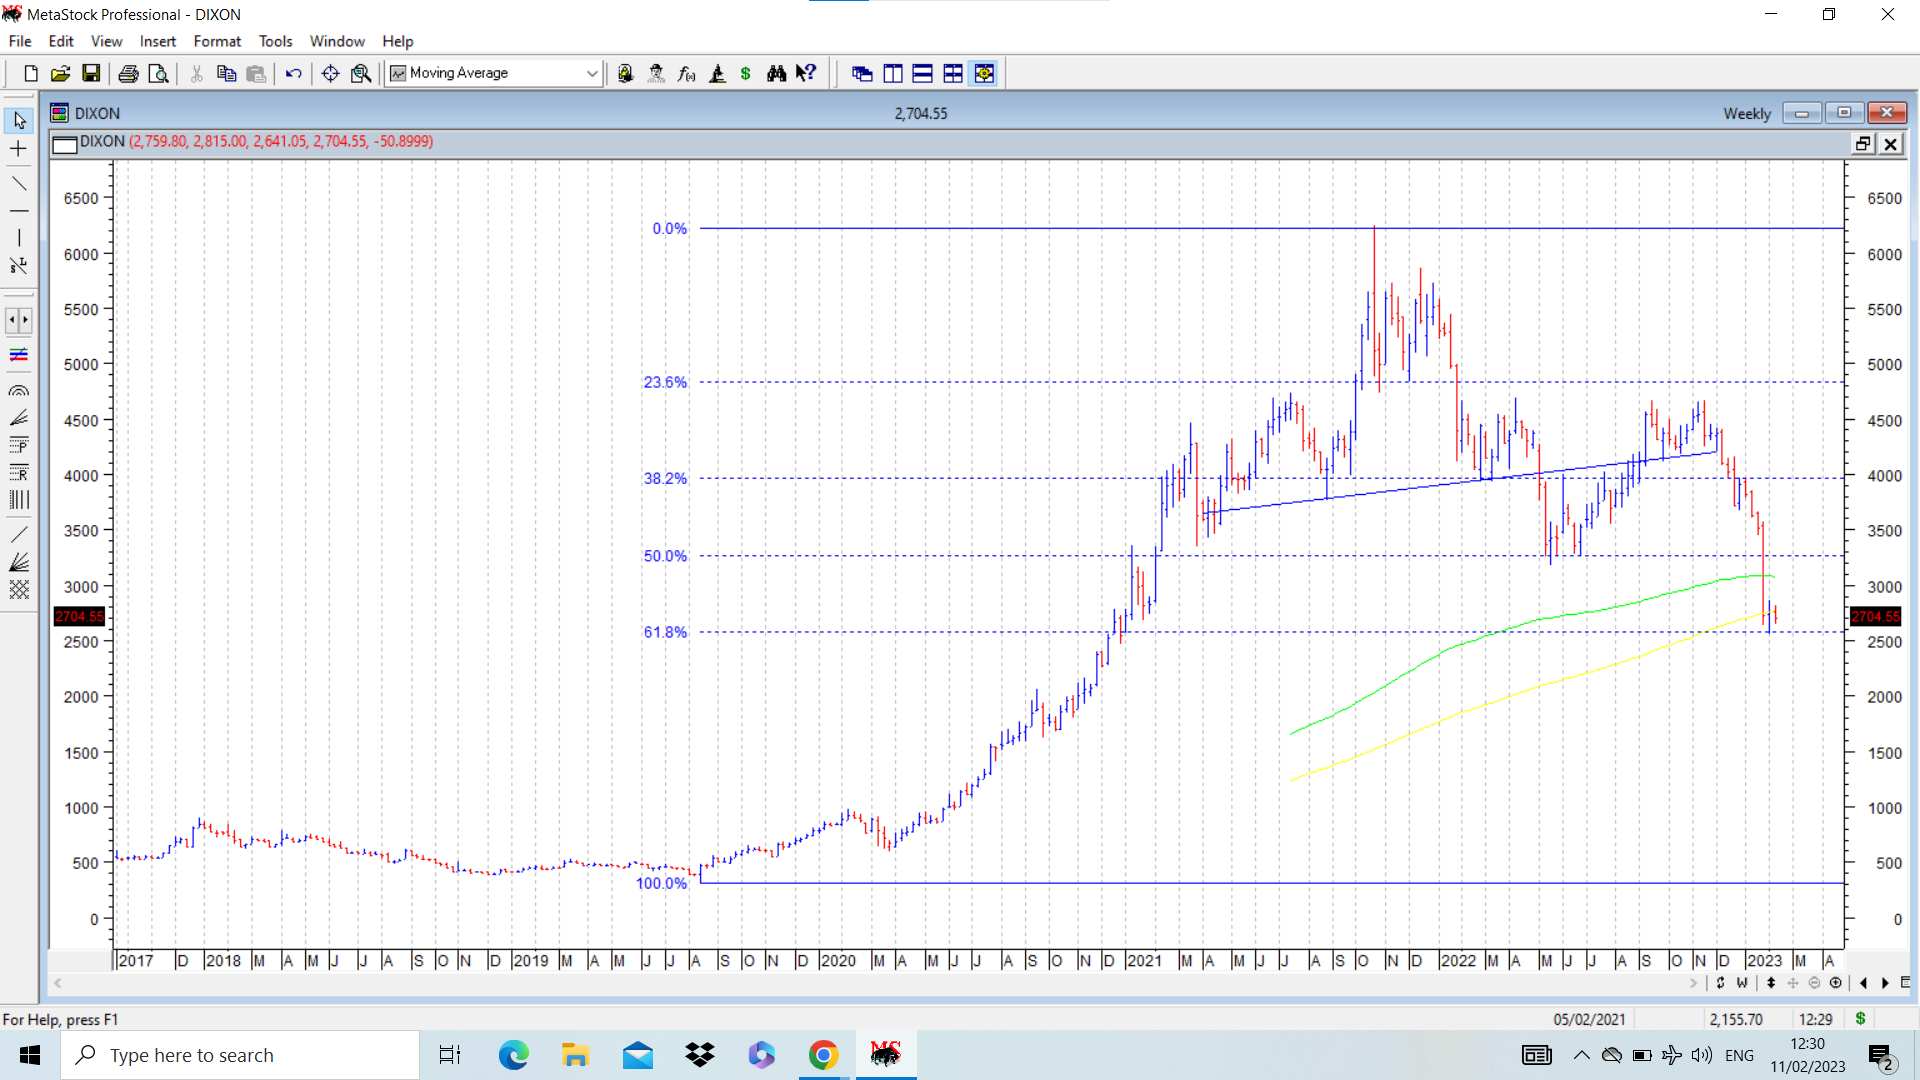
Dixon chart was discussed in May 22 when price broke down below a head and shoulders bearish pattern. At that time, the pattern targets looked alarming. The pattern target for breakdown were close to 2400-2500 and recent swing low of 2553 is very close to that level. Effectively the pattern target is achieved. Now what?
The slide in stock price has stopped exactly at 61.8% of the entire previous rally. Now we need to see if stock price shows any signs of consolidation/bottoming out at around current levels. After such a big fall, wherein stock price corrected from high of 6243 to 2553, stocks don’t usually reverse direction straightaway. They first form a bottom, undergo consolidation with multiple up and down moves within a range, and then break out above the range indicating that a bottom is in place and another fresh rally has begun. In the chart, price correction may/may not have been over, but time correction is still remaining. So its in watchlist for any potential signs of reversal after few weeks/months of consolidation. ( i.e if it still does not go much lower than current levels. ) disc: no positions.
Hitesh Bhai, I have been monitoring Gic housing since you have put up the chart, today it has gone below 170, yet today’s closing is sometime away, what’s your view ? In such situations you hold or exit, as all housing finance companies are closing below their support levels? Thank you
GIC housing has had a tough time post its q3 fy 23 results. On the face of it results are not so bad as to warrant a correction from a swing high of 248 to current levels of below 170. But that’s the state of markets we are in.
On the charts, support zone has been 165-170 and the 200 dema is at 162. 30 WEMA is at 159 and is rising. So current level is close to support and we need to watch how the above support levels hold out.
Coming specifically to results, q3 fy 22 was an exceptionally good quarter with operating profit at 100 crores and net profit at 77 crores and in the absence of strong growth that was a number difficult to match in this quarter. So we had operating profit of 87 crores in q3 fy 23 and net profit at 65 crores. But the more important thing to monitor is the asset quality wherein the improvement in GNPA and Net NPA numbers continues continuously. Net NPA has reduced from a peak of 7.82 % in June 2021 to current levels of 3.94% as on Dec 22. Gross NPA has also maintained its improvement.
Coming to q4 fy 22, it was a tepid quarter with net profit at 49 crores. So I expect q4 fy 23 to be a much better quarter on a y on y comparision when results of q4 fy 23 come out in due course.
Current Book value is at 306 and based on current run rate, EPS for fy 23 is likely to be closer to 40. So we have a financial company with price to book at 0.55, and PE at sub 5. Statistically this looks very cheap at current valuations, plus it is close to support zone.
I had earlier booked partial profits on strong run up, though only on a small portion of my total holding. At sub 170 levels, I find a lot of value here and added the earlier sold quantity today.
In these kind of situations, the valuation is of a no growth stock, available at deep discount to book value If the improvement in asset quality continues, we could see decent upsides here. ( This is not a recommendation but my thought process with relation to the company at current prices. Company does not do concalls so its difficult to dig more other than rely on numbers. I had similar experience with Canfin back in 2012-13 when it was available at deep discount to book value, though there the NPA were negligible, but significant upsides materialised once company started showing consistent growth.) PNB housing is another similar company I hold which is showing relative strength in an overall dodgy market, but there valuations are not so cheap, mainly because company is showing growth and management does concall and has clearly articulated its plan.
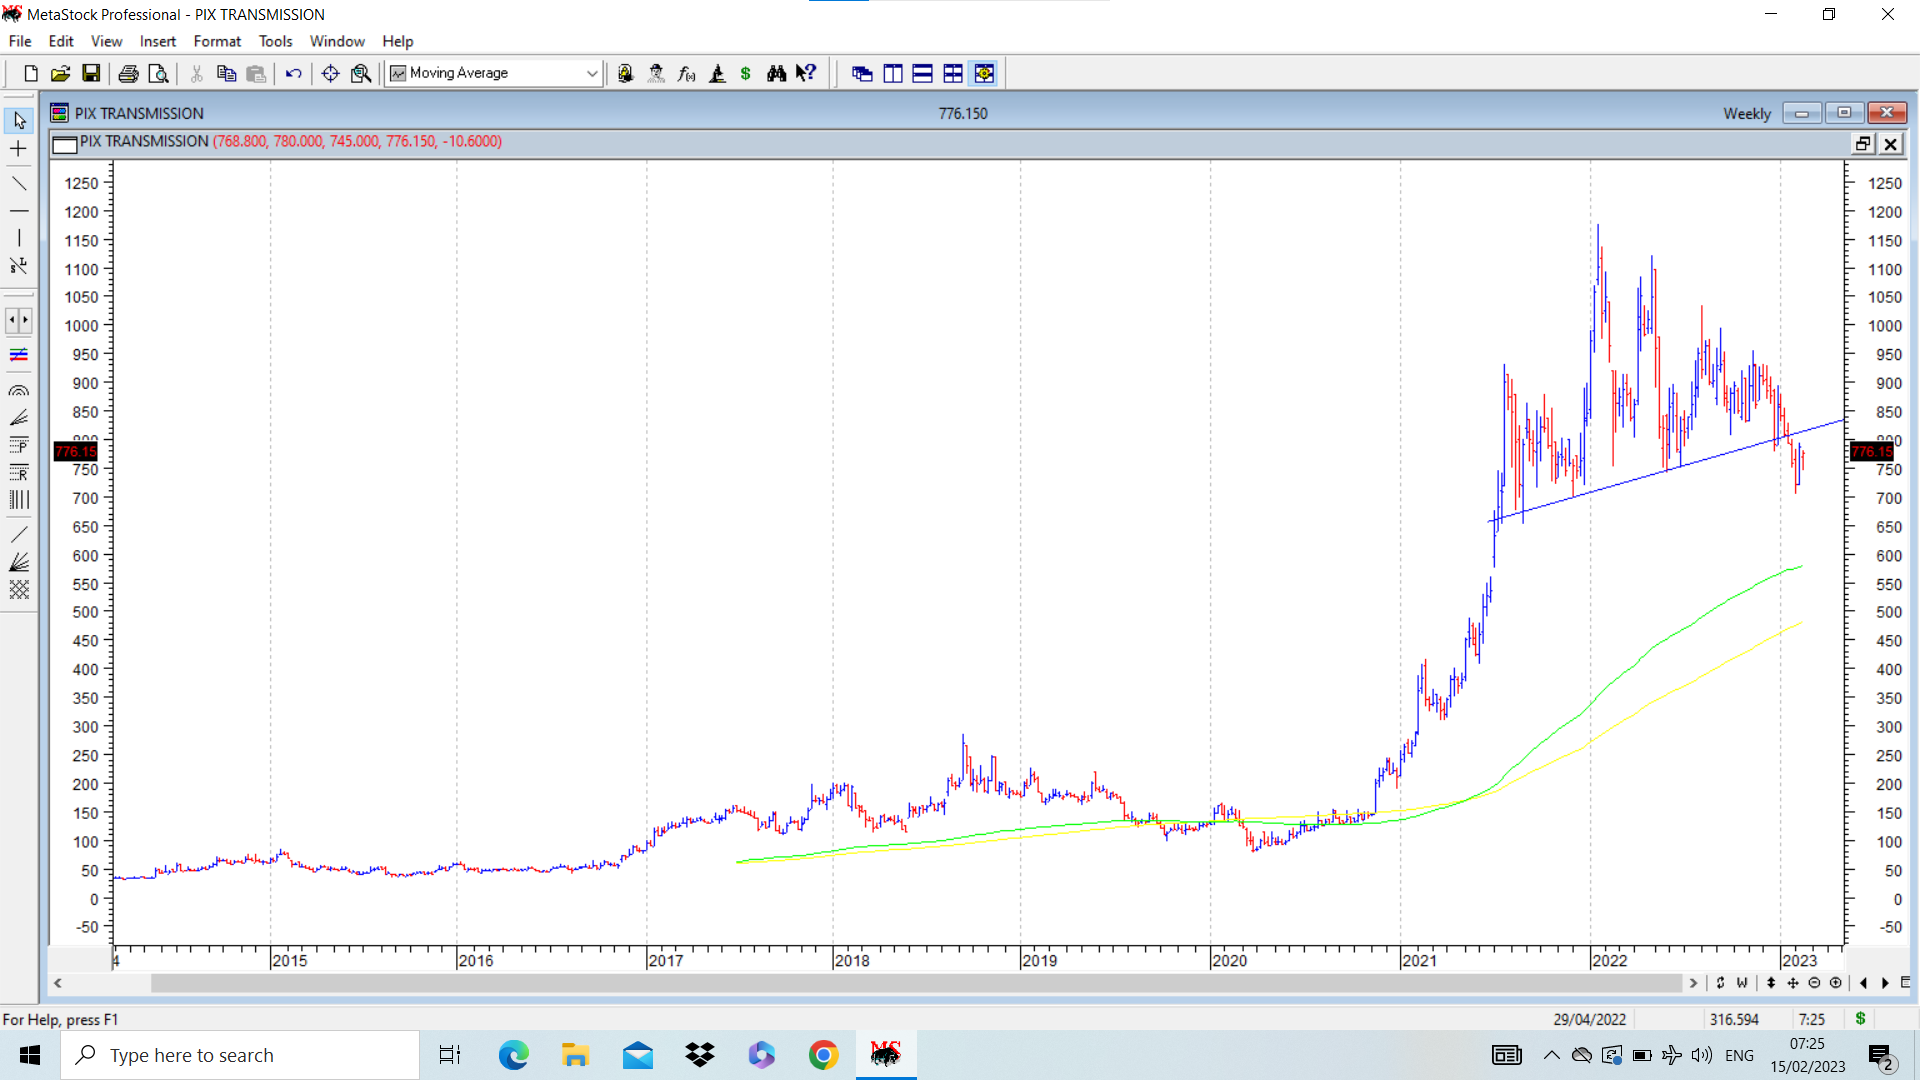
Pix transmission has had a superb run, with the stock price rallying from Covid lows of 80 to a high of 1174 in Jan 2022. It has broken down below a bearish head and shoulders pattern on weekly chart. The height of the pattern is close to 400 rs and breakdown level is 800. So pattern target can be around 400. As of now it seems these are lofty targets, but I will keep observing to see how the pattern plays out. I personally do not hold any positions, and this is not a recommendation. Posted only for academic interest as it is a pattern close to a classical pattern.
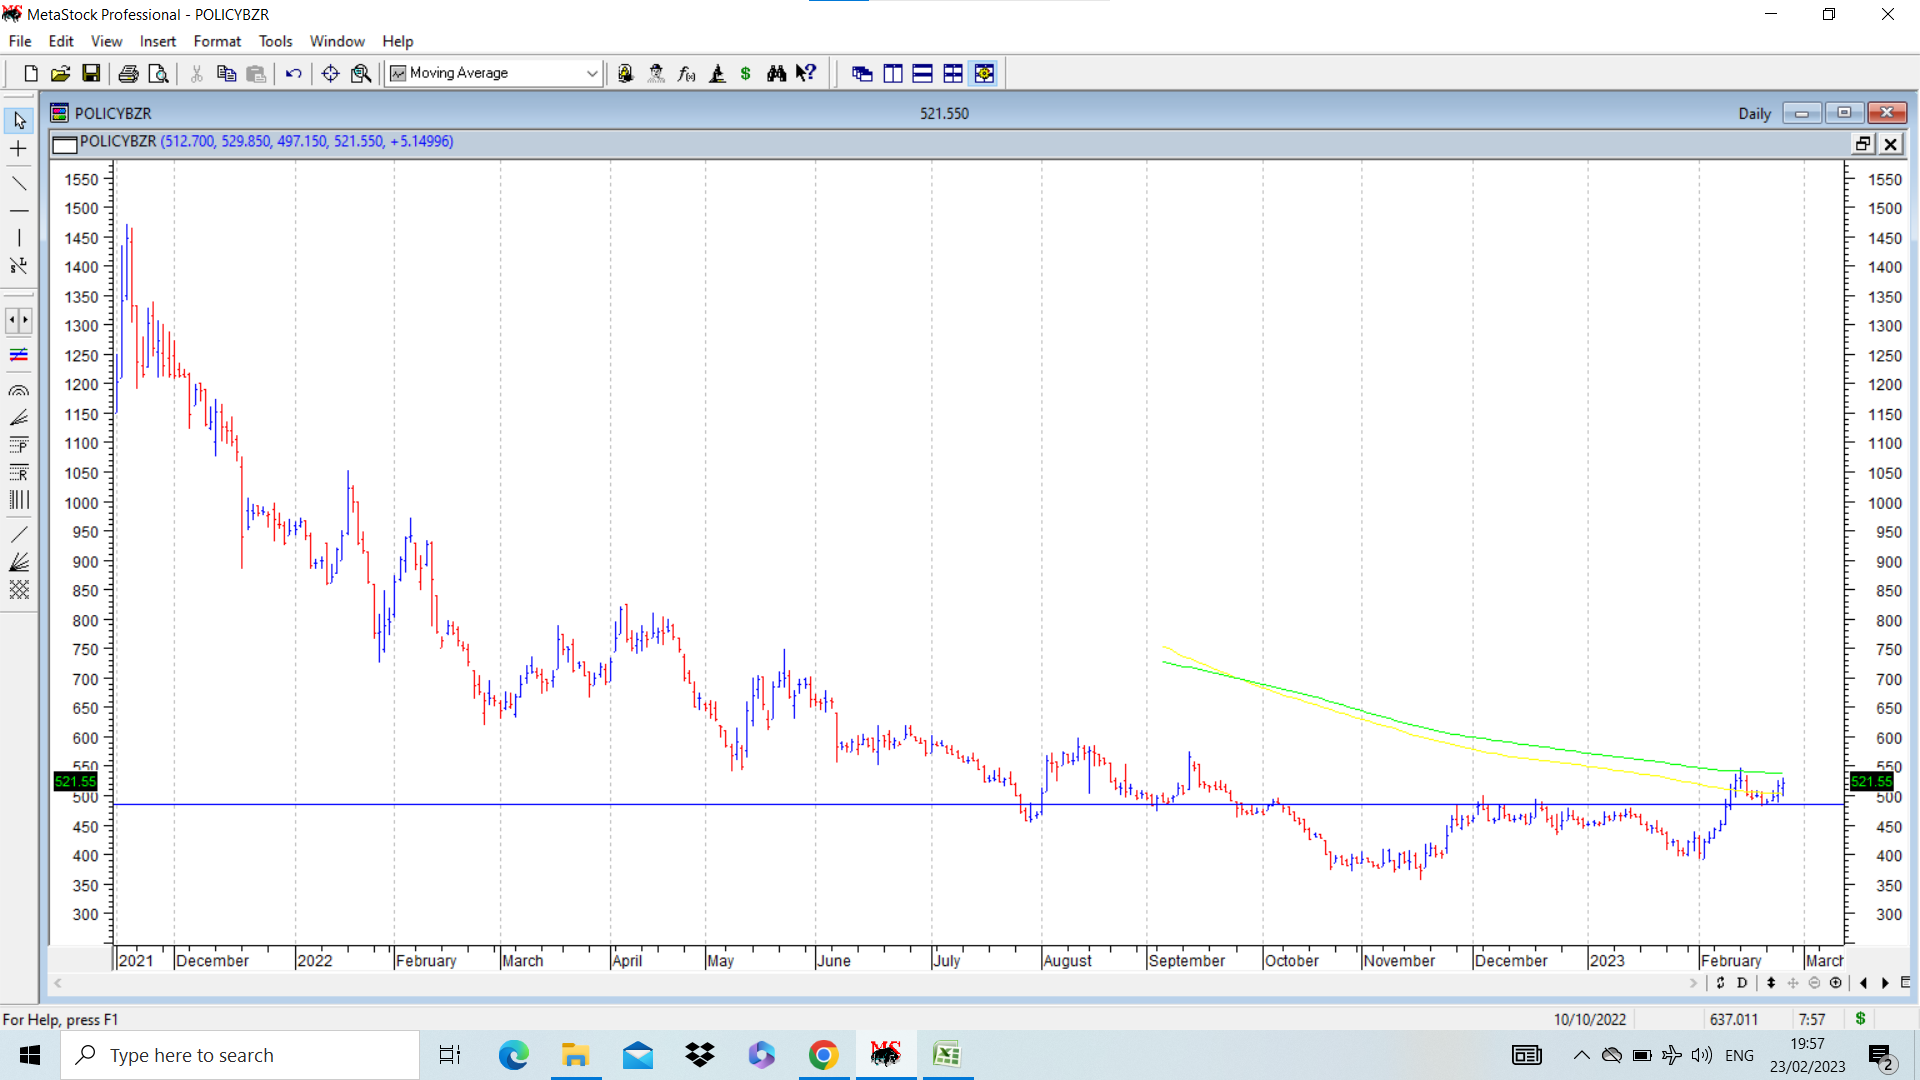
Policy bazaar is a recent listing and there was a lot of buzz post listing. IPO was at 980 per share and stock price hit an all time high of 1470 on second day of listing i.e on 17 Nov 2022. After that it has been all downhill and stock price made low of 356 but it consolidated between levels of around 370-400 for many trading sessions and started an upmove which faced resistance at 480-500 and stock price corrected to post a higher bottom at 390 and again started moving up and posted a fresh swing high of 545 which was its 200 dema and corrected exactly from there. On retracement from here it took support at 480-500 and now seems to be attempting to move up, but still remains below its 200 dema which is currently at around 538 and is flattening out from earlier declining trajectory.
Overall there seems to be good early signs of some kind of bottom formation, though the verdict still is not confirmed.
On the bar chart there is a lot of clarity about where resistances were on way up and how this same resistance zone offered support during the latest decline.
The problem with these kind of structures is that there are a lot of guys stuck at higher levels and that comes around as resistances if we see the left side of chart where each higher level can act as a resistance. However if this were to take the form of a rounding bottom we could be seeing a very early stage rounding bottom. I personally am not too comfortable buying when stock is below 200 dema and hence it remains under my watchlist
disc: no positions. posted only for academic purpose to see how this one plays out going ahead. It though remains on my watchlist of stocks for buying if some positive structure emerges.
Fluorochem update. Earlier we had discussed a possibility of a bottom formation based on positive divergence on weekly charts. Stock price has displayed some strength and on the back of decent q3 fy 23 numbers and encouraging commentary from management, there seems to be slight shift in the mood in stock price. It still is to conclusively cross 200 dema, which is close to today’s closing price.
On daily line chart we can see a cup and handle formation with potential target marked in dotted blue line at 3500. 3500 also happens to be a level close to 61.8% retracement to the entire fall from 4173 to 2534.
A simple trendline joining the tops also shows a breakout above the falling trendline.
disc; invested as disclosed before. (not a recommendation, but following the academic progress of the chart discussed earlier)
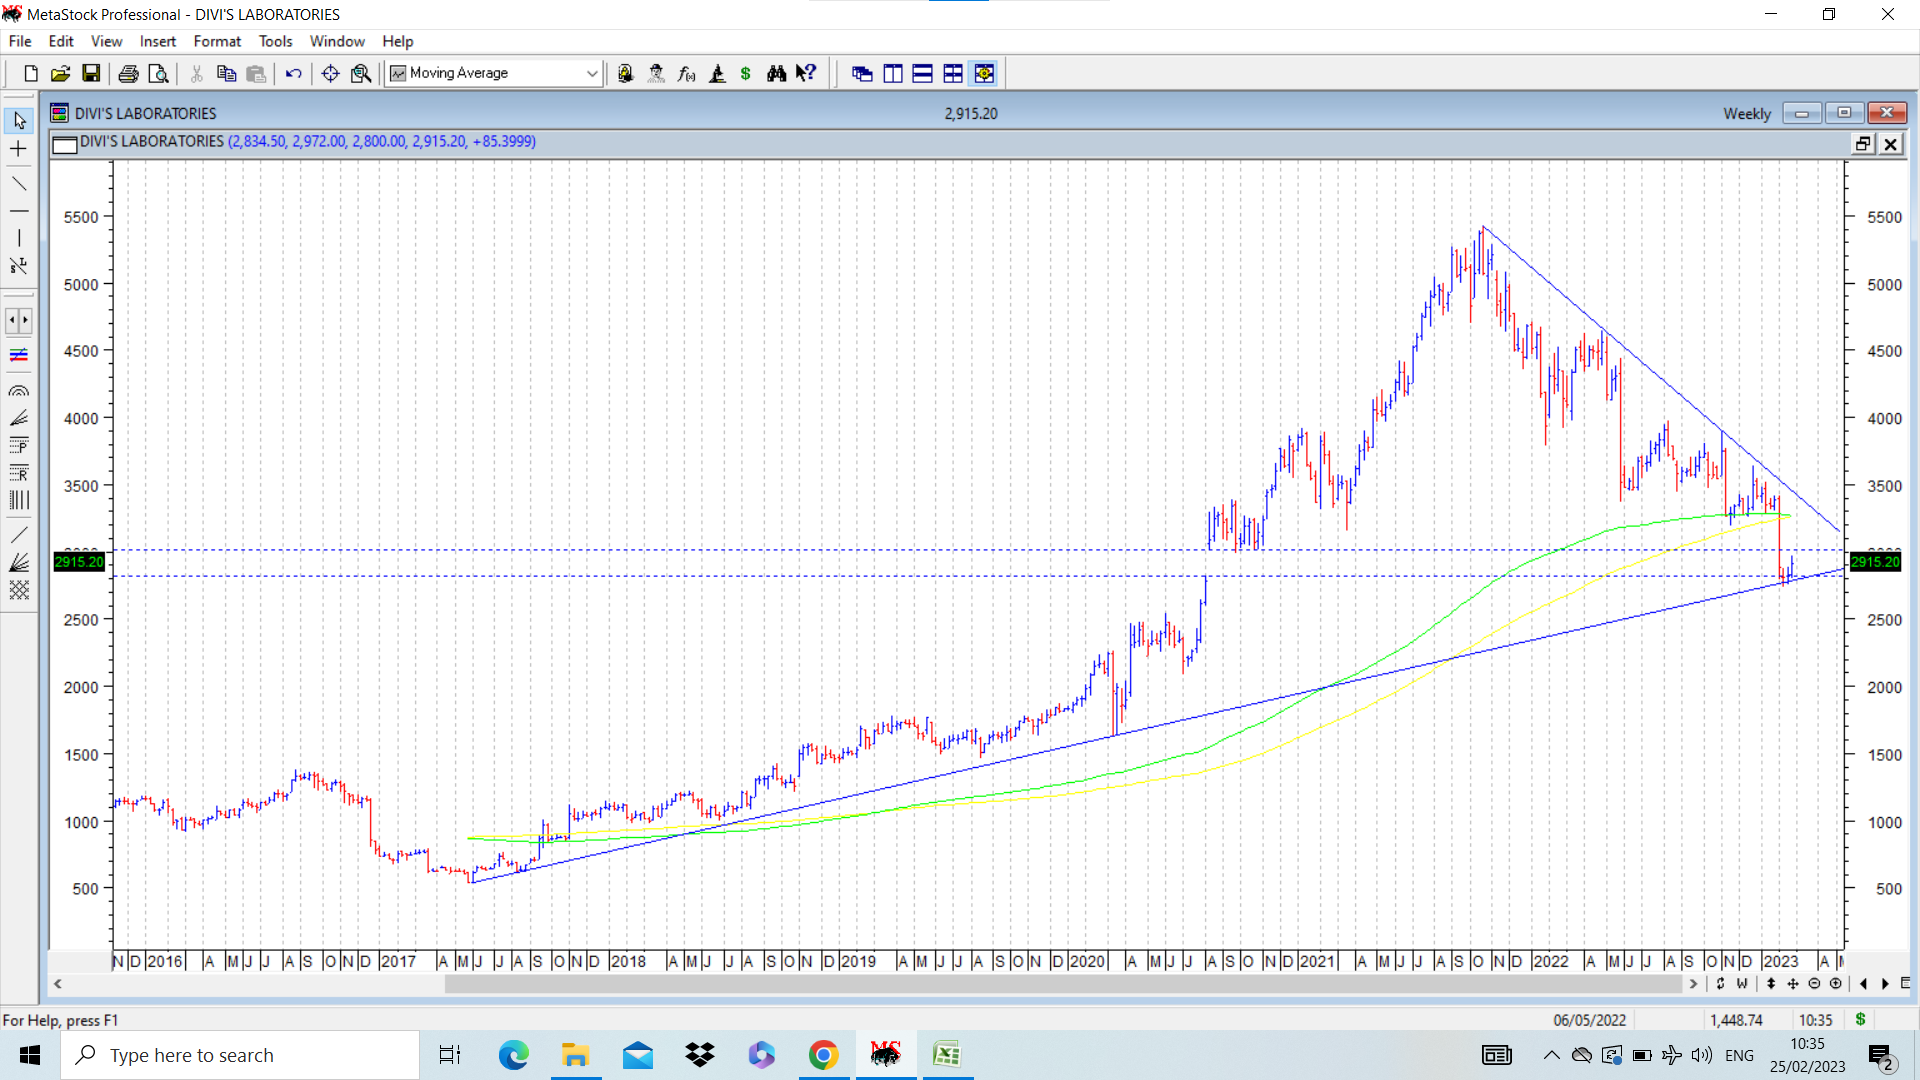
DIVIS labs cmp 2915, has corrected recently from its all time high of 5423 to a swing low of 2740. It took support exactly at a long term trendline drawn on the weekly chart posted below. Another important zone of support we were watching out for was the big unfilled weekly rising gap when stock was going up, which ranged between 2820 to 3012 (marked in dotted blue lines) , which was breached briefly but overall seems to be offering support.
Usually in high quality stocks undergoing medium term correction, support is expected at 200 Week exponential moving average which in case of Divis was at 3275, and it did seem to offer support for a few weeks before the latest bout of weakness which clearly violated the above support zone.
Going forward, i would be keenly watching the falling trendline and any breakout above that if and when it happens. Till that time, it would be wait and watch for me. disc: no positions.
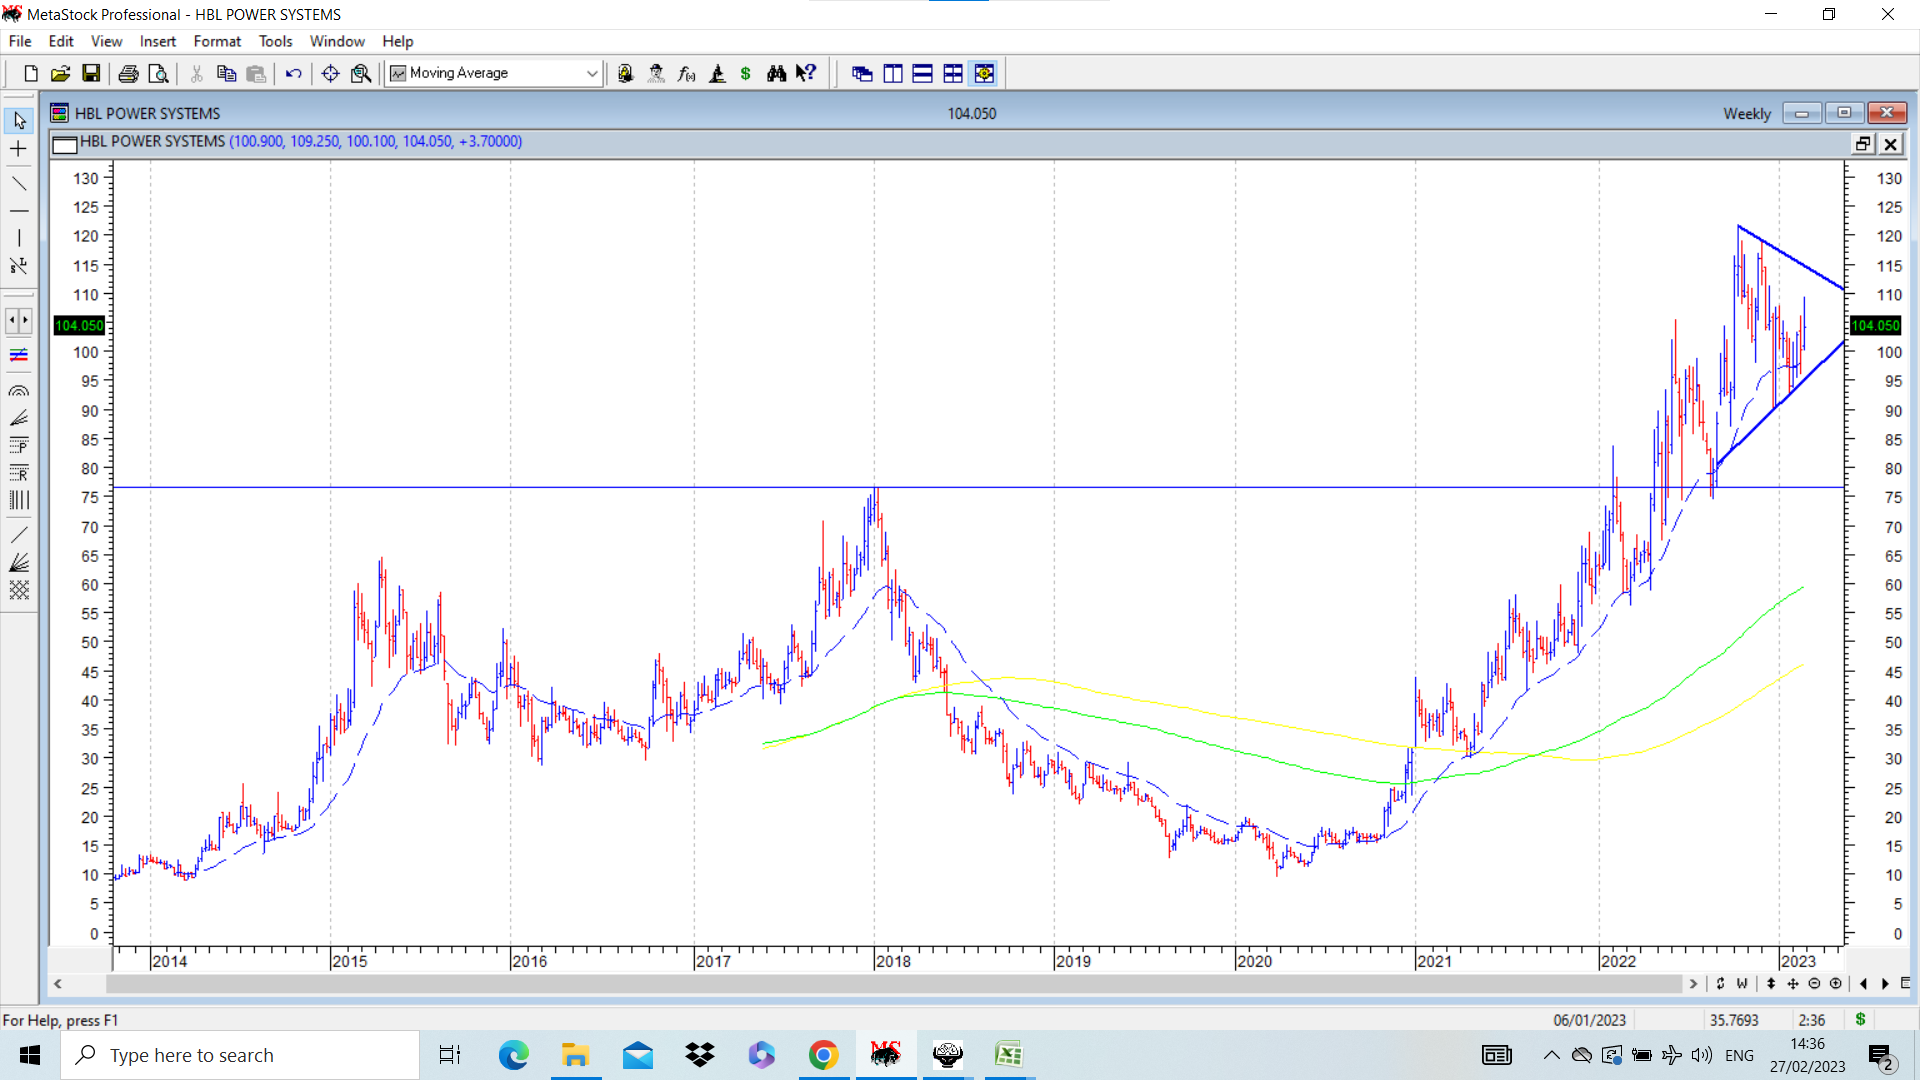
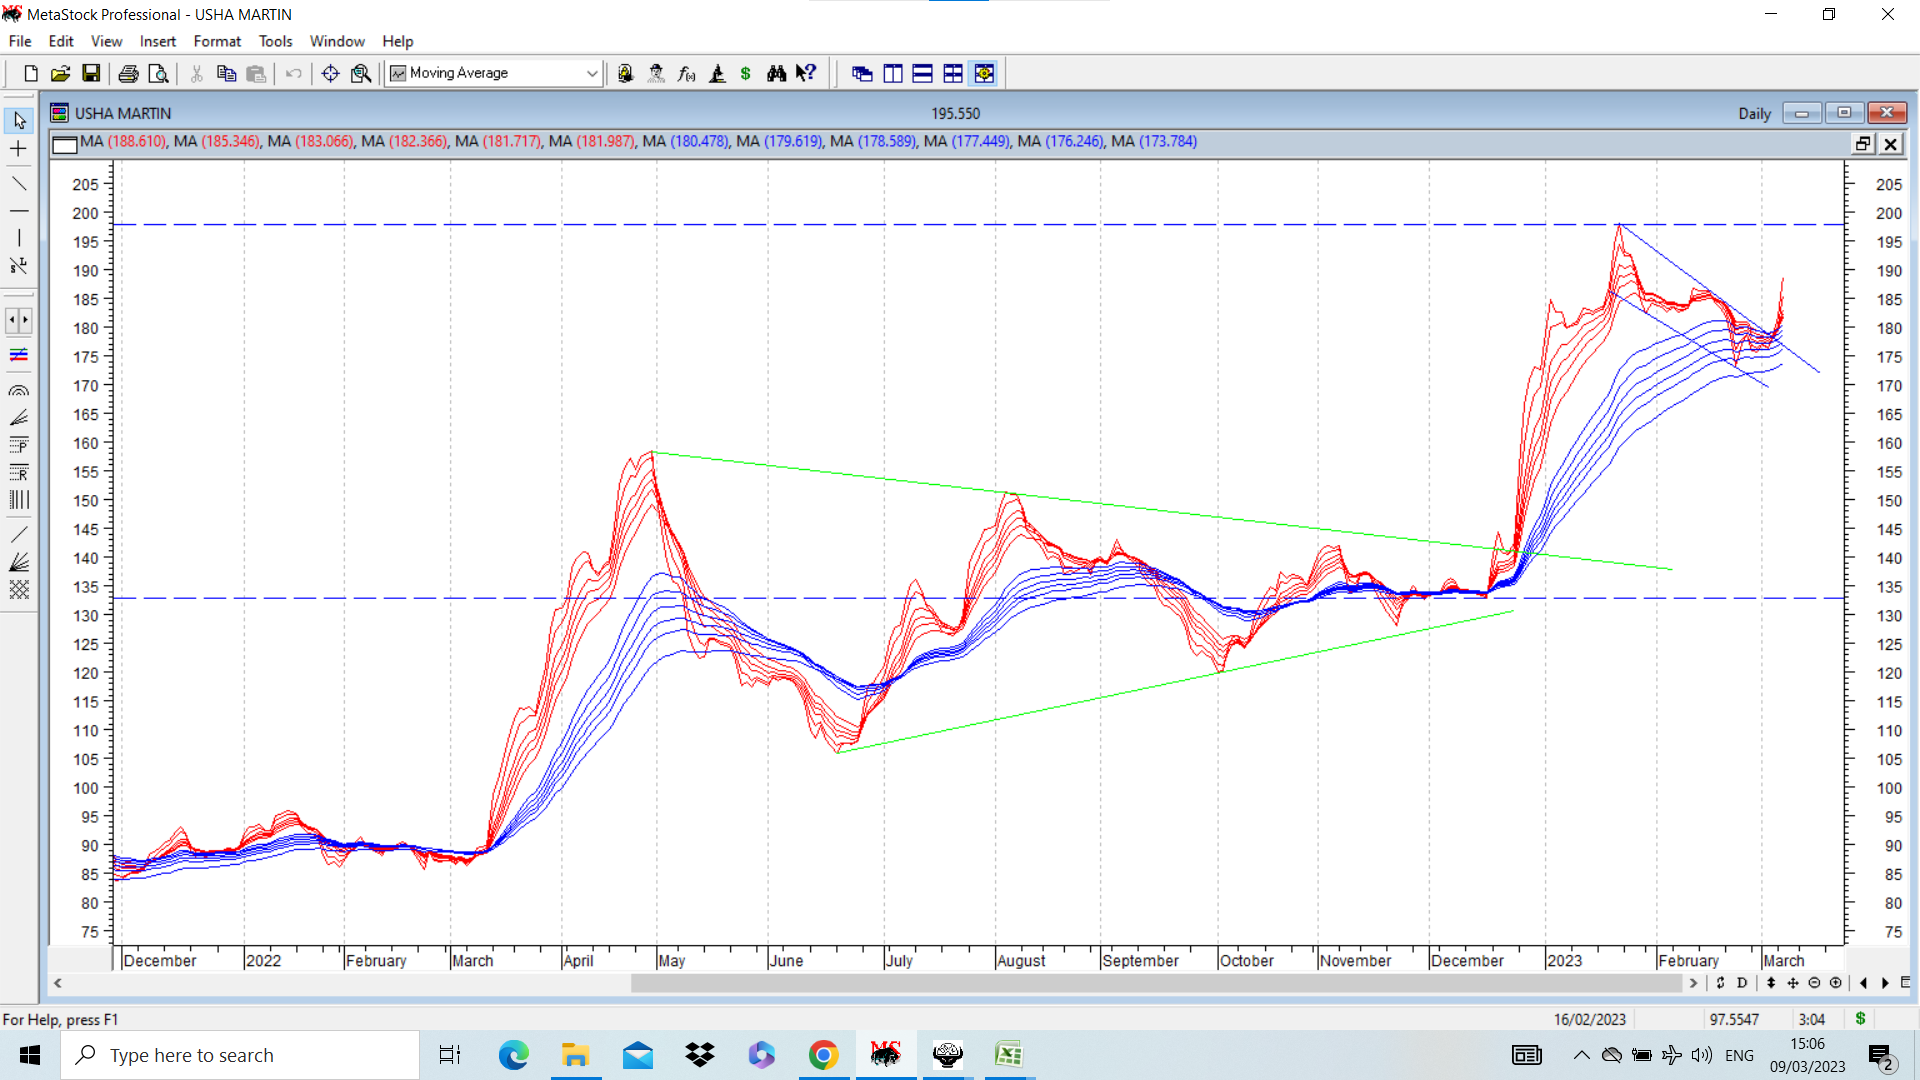
HBL Power has been a well discussed company on VP. Its weekly chart shows an interesting pattern similar to something seen before in Usha martin. After crossing a major resistance of 76 which was its all time high ( in case of Usha it was multiyear high of 106.5) stock price shot up and corrected and has been consolidating within a symmetrical triangle. Breakout point for this is around 115 and the maximum height of triangle is 35 rs. If and when breakout happens above 115, target can be close to 150. ( One can scroll back a few posts to find out similar pattern pointed out in usha martin before on this thread. ) disc: invested as disclosed before. (not a recommendation, discussed because of an interesting triangular pattern located at a very interesting juncture in its journey)
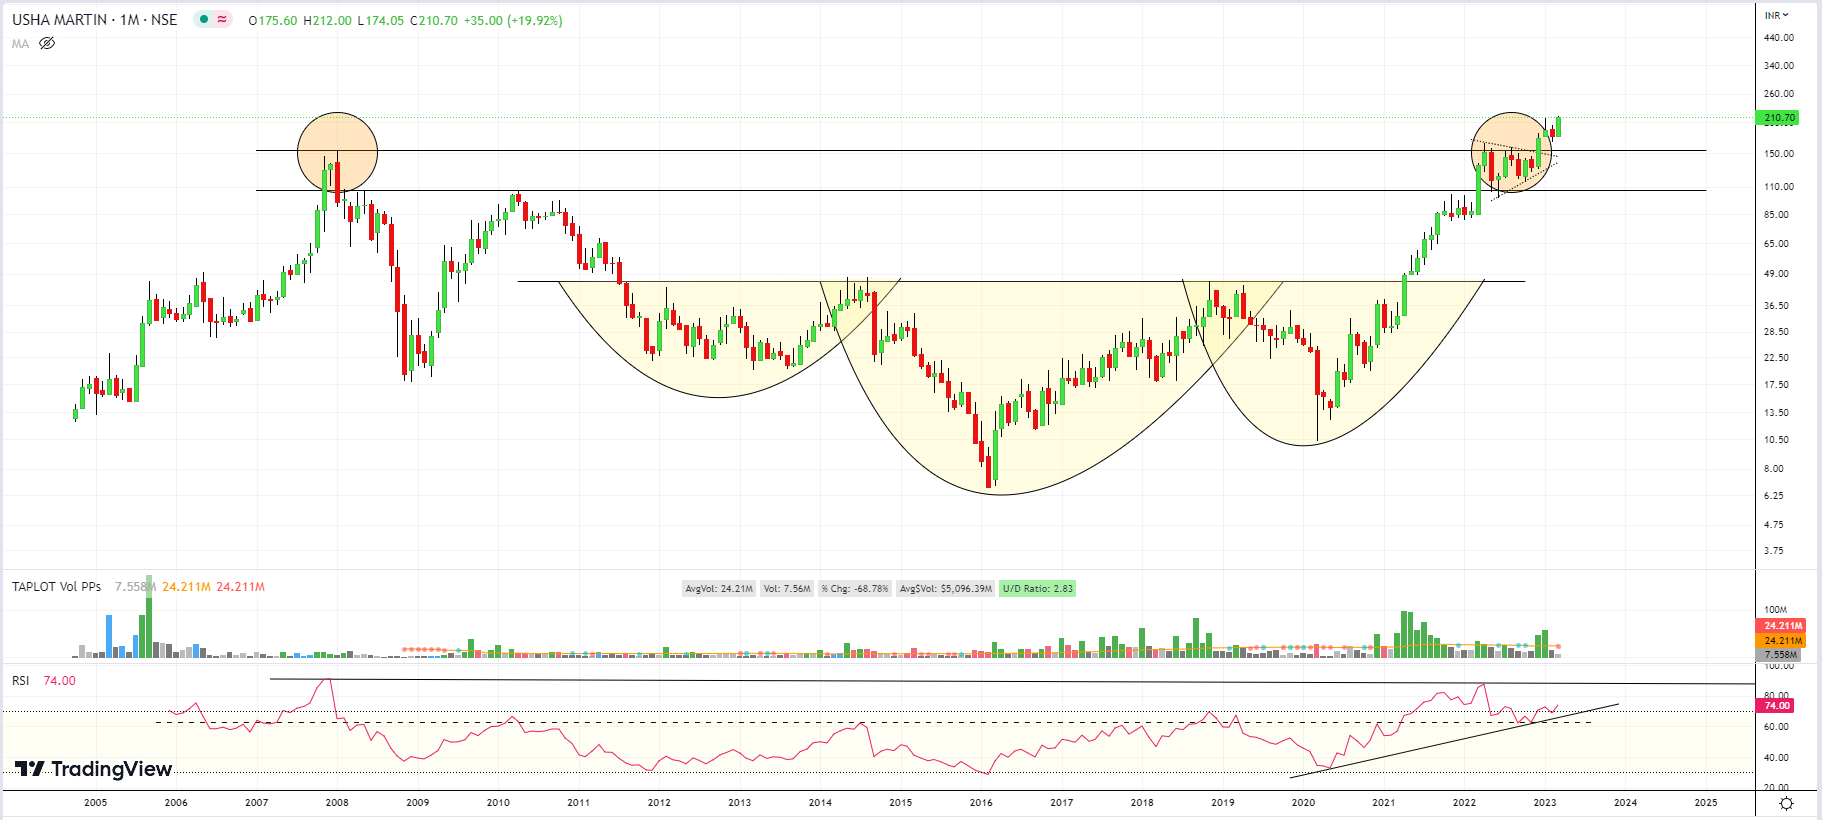
Usha martin daily GMMA chart attached. After breaking out from triangle enclosed by green lines, stock went up and underwent a sideways flag like consolidation (marked on chart) and broke out from that once it moved above 180. Further confirmation of strength on crossing previous high of 197 on GMMA chart and 209 on bar chart. According to the GMMA line chart, potential target if pattern plays out can be in range of 240-245 and according to bar chart targets can be around 255. disc: invested as mentioned before.
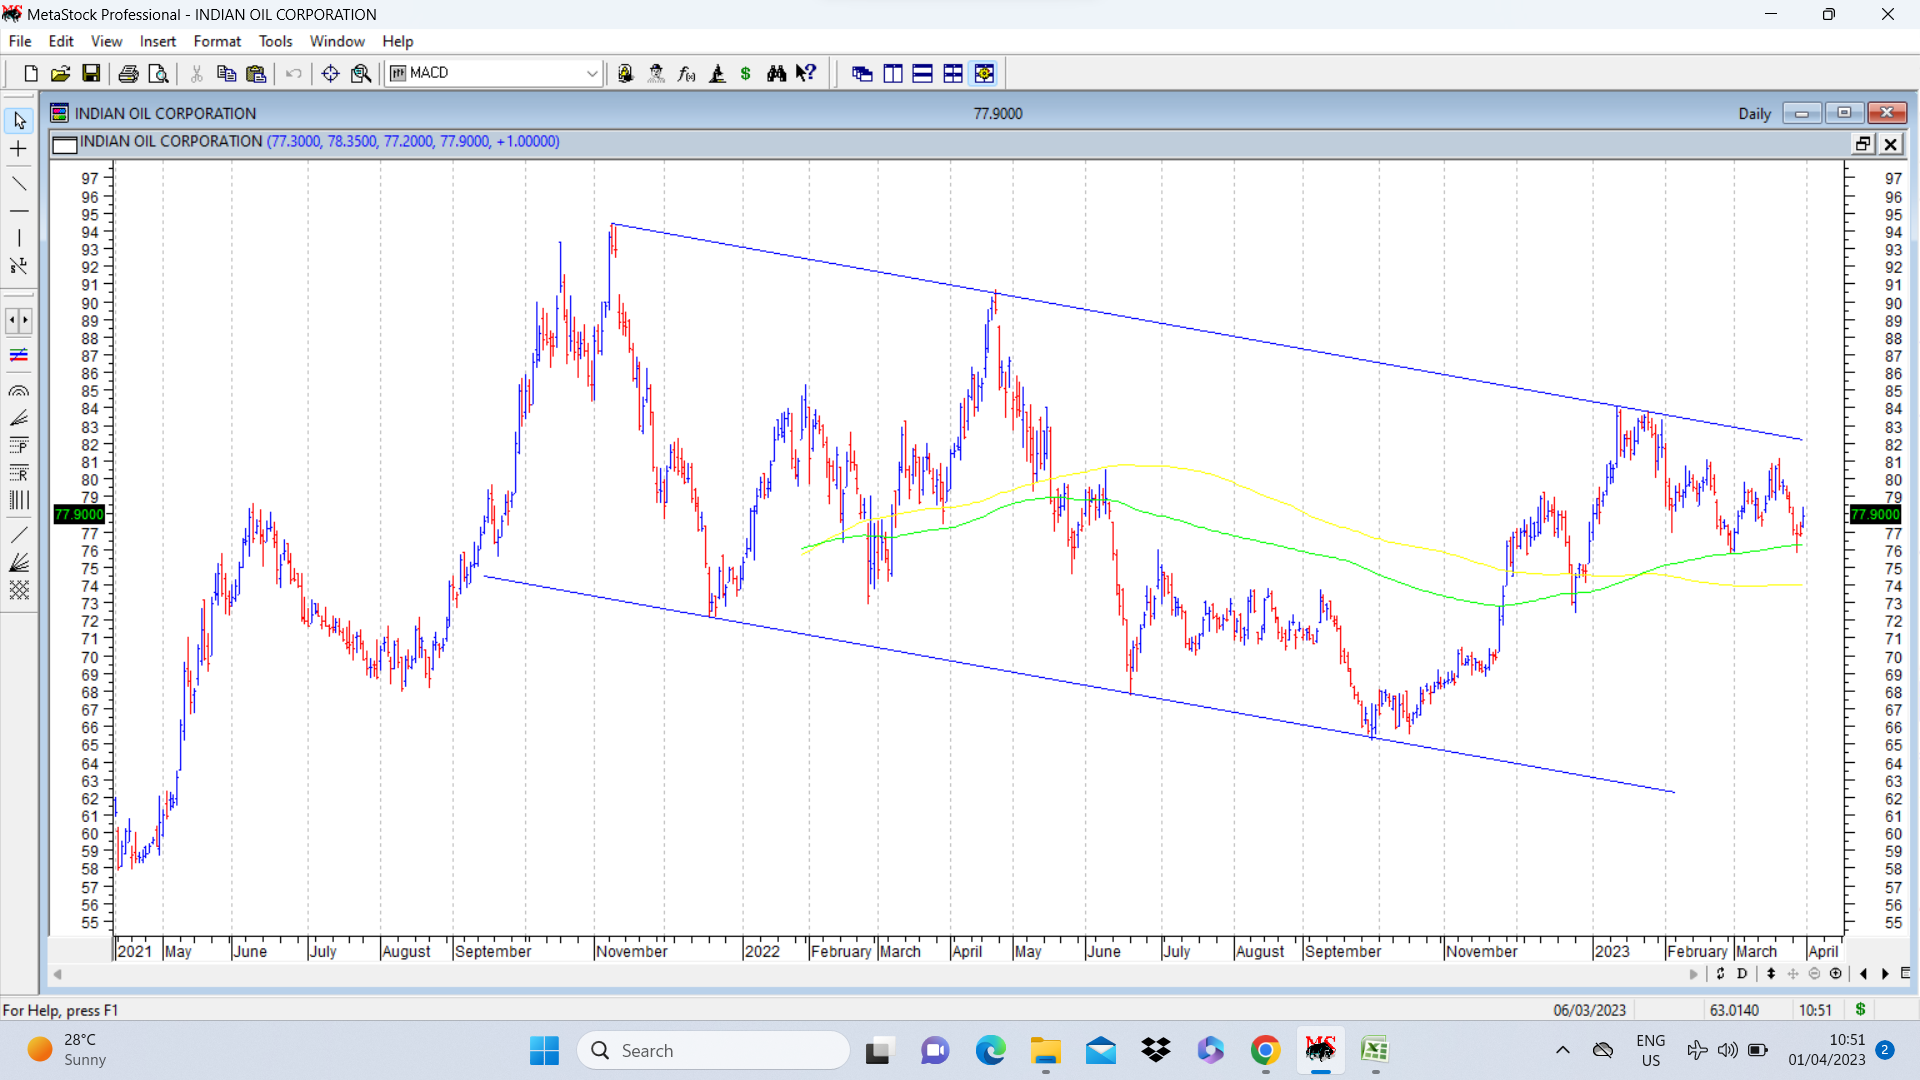
@hitesh2710 - Hi Hitesh, could you please share your latest views on IOCL? I am not much of a technical investor but do track this thread for knowledge. Since this is a techno funda bet for you, on the fundamental side, based on the fall in crude price since last quarter, would you say the improvement in marketing margins will more than offset the adverse impact of GRMs for IOCL? Also, from a technical standpoint, how does IOCL look and what are the crucial support points to watch out for? Thanks.
IOC remains within a falling channel and needs to breakout out from it to post decent gains. It has managed to stay above its 200 dema (green line) and other key support levels all throughout the recent correction, which might be considered as a positive.