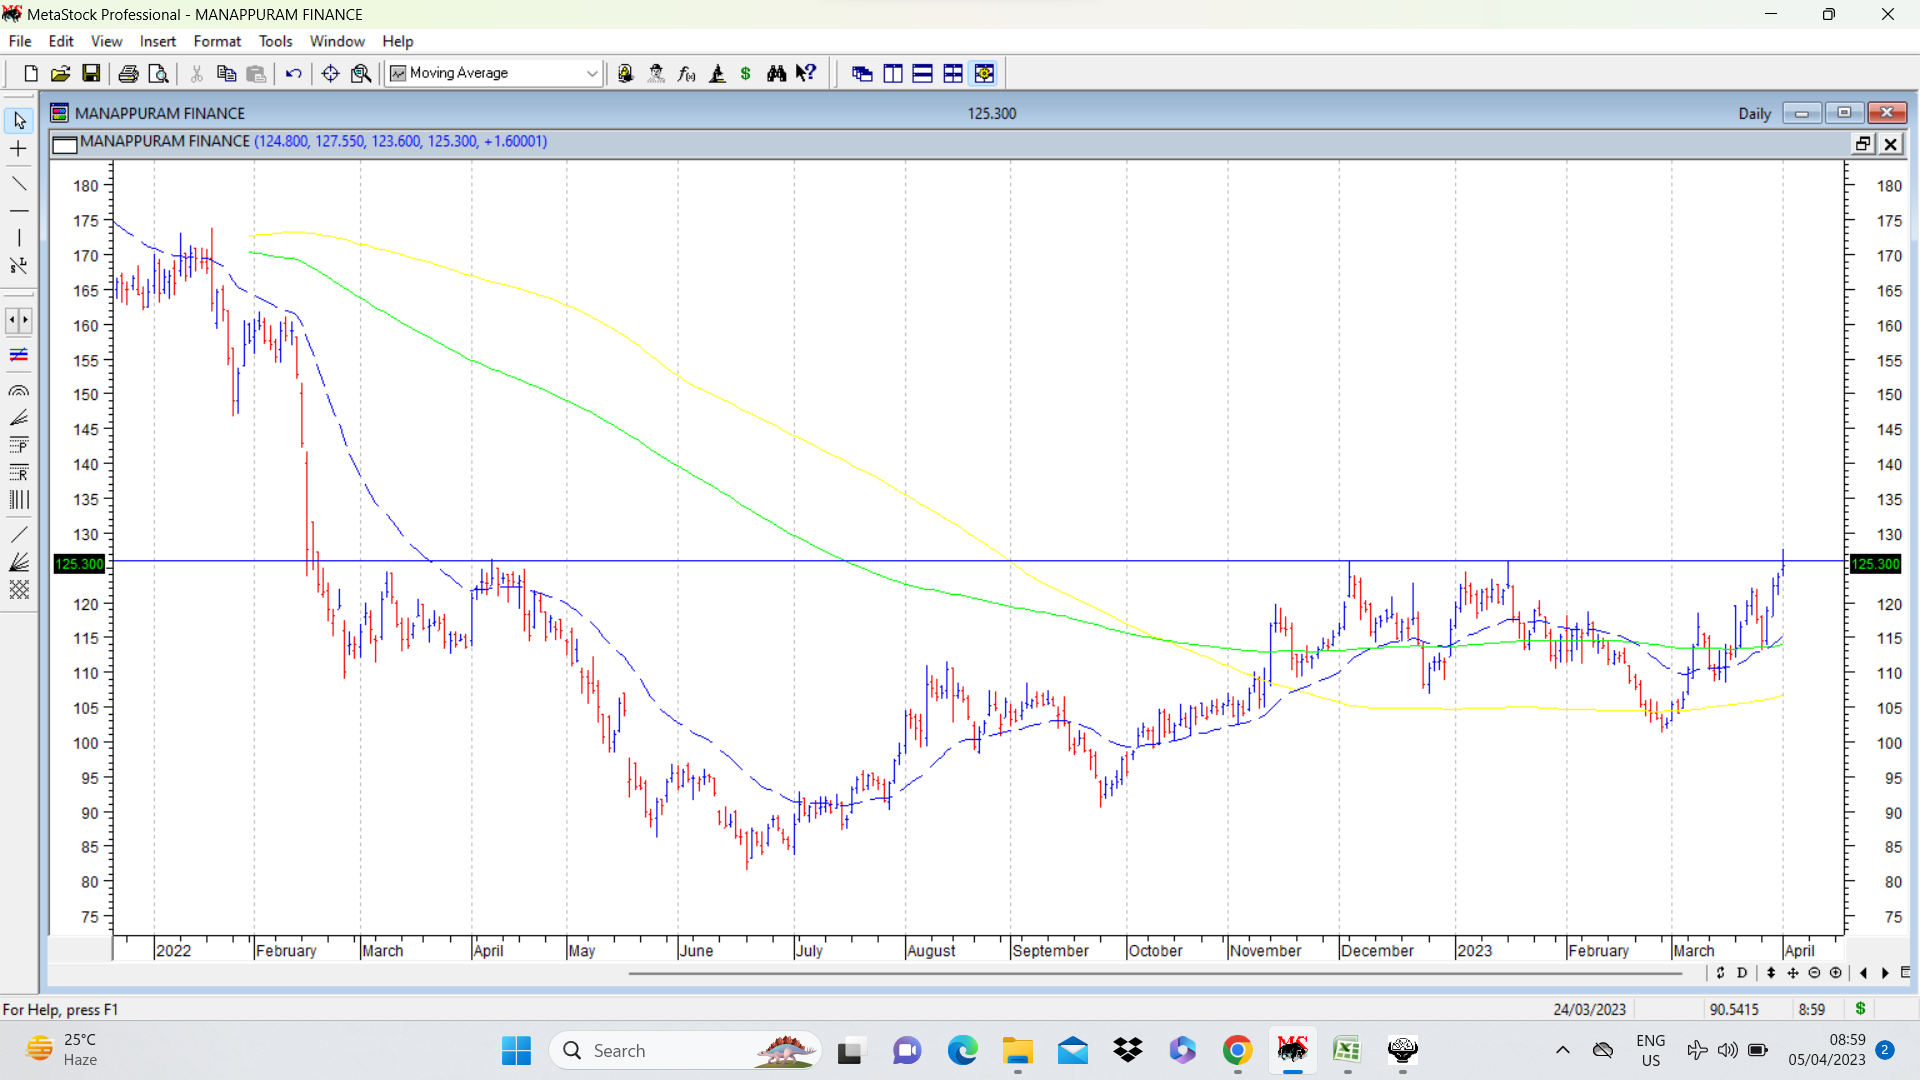
WRT Manappuram chart, your observation is spot on. But in the bar chart I am putting up anew, what is clearly visible and most important for us is the intraday resistance the stock price faced on multiple ocassions at levels of 126 or thereabouts. Once stock prices crosses that level and consolidates, or stays up, there can be confidence about the pattern breakout.
Basically all these patterns tend to show important trendline resistances, and the trendlines can be horizontal or sloping. Most important inference for us is to be able to figure out whether there is any change in trend visible on charts and how we can benefit from it. In a pattern like an inv h &s pattern, in case of Manappuram what is important to note is the resistance at 126 . We should not be lost in the smaller details, else we will lose the bigger picture. Aim always has to be approximately right than precisely wrong . Here in case of Manappuram we have an inv h&s, a sort of rounding bottom, and stock price above 200 dema and 30 WEMA and both averages have started turning up… Additional confirmation can come on breach of 126 on the upsides…