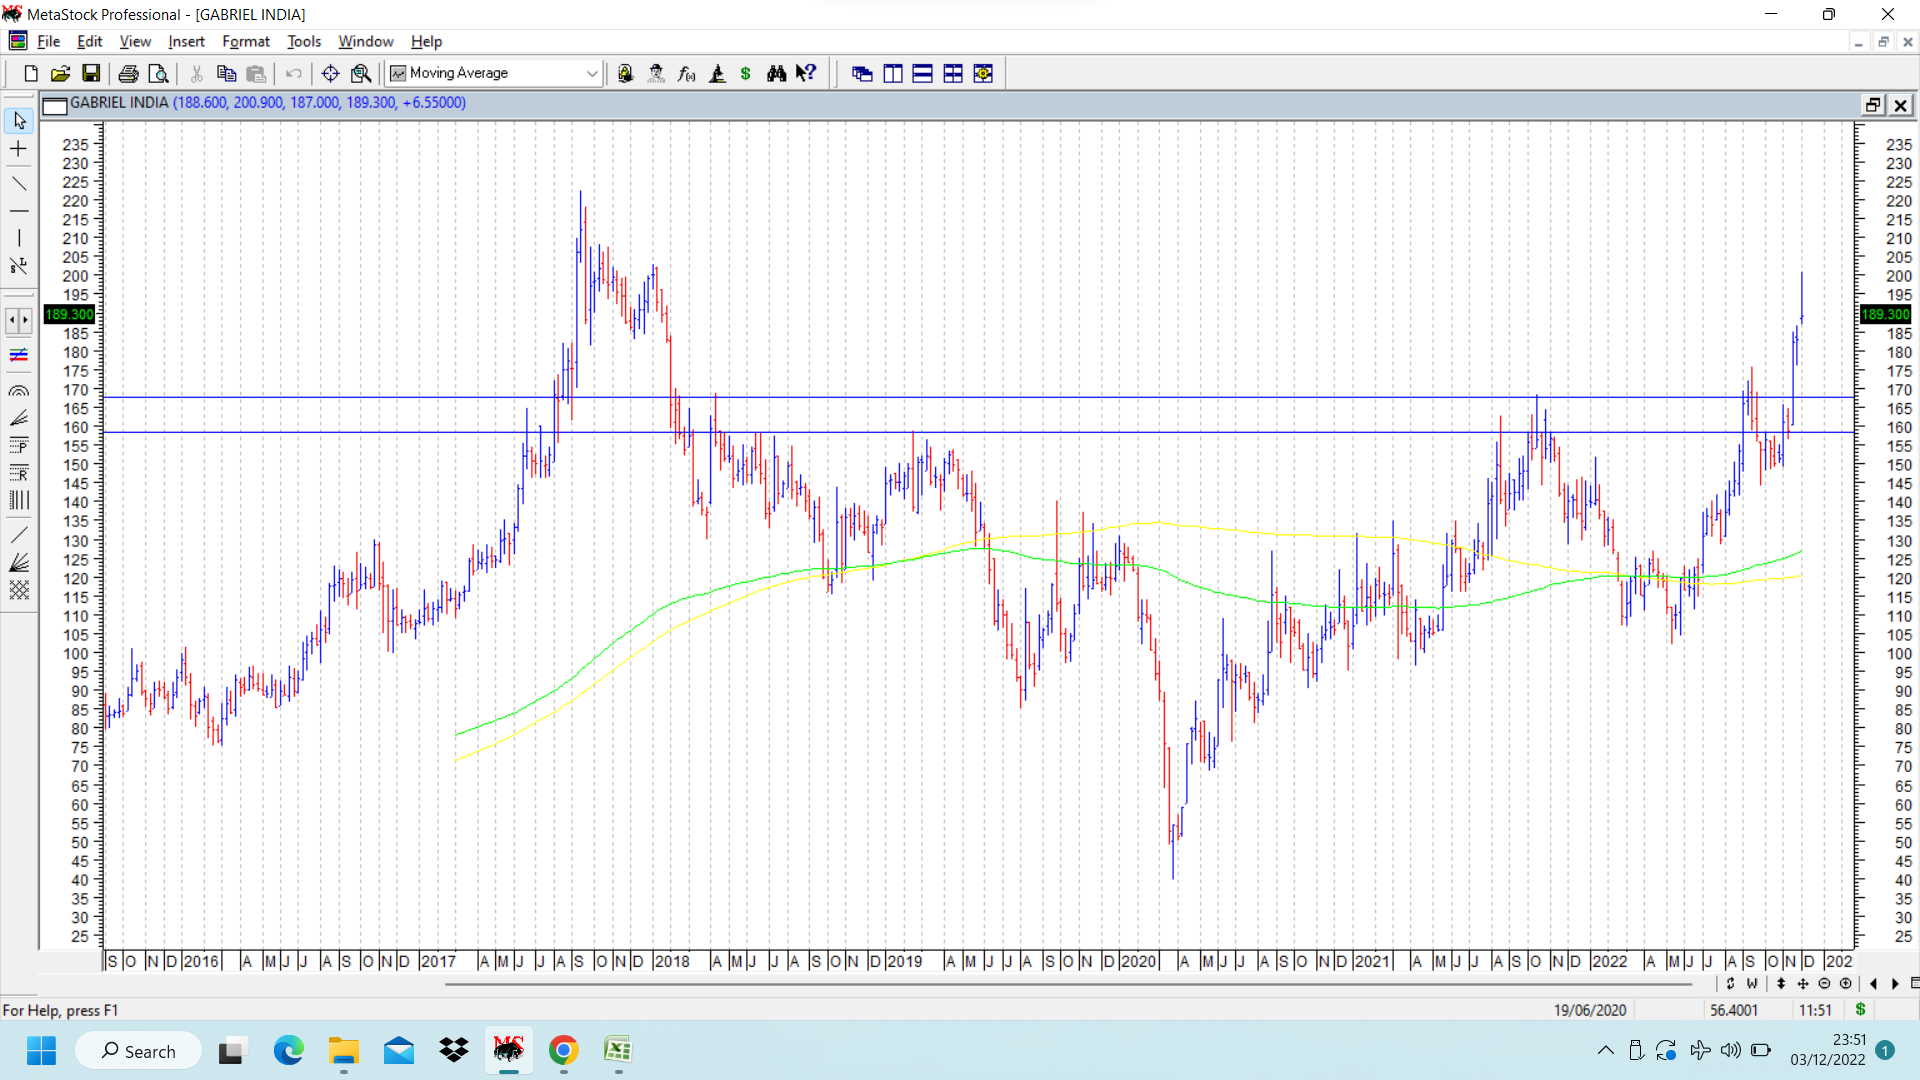
Gabriel India chart follow up. The stock chart was put up (then price of 136 in July 2022 when there was a lot of bearishness on general markets according to Elliot Wave practitioners. Since then a lot of water seems to have flown under the bridge and now markets are quoting at all time highs.) Gabriel has broken out above important resistance zone between 158-168 and hit a swing high of 200 and now seems to be consolidating. The previous resistance zone needs to be seen for possible support. All time highs on the stock charts is at 222. Last couple of quarter results have been good both on topline and bottomline front.
Weekly chart of Gabriel shows hints of an inverted head and shoulders breakout (where left shoulder is not clearly defined) . disc: booked profits and would be looking at re entry points.
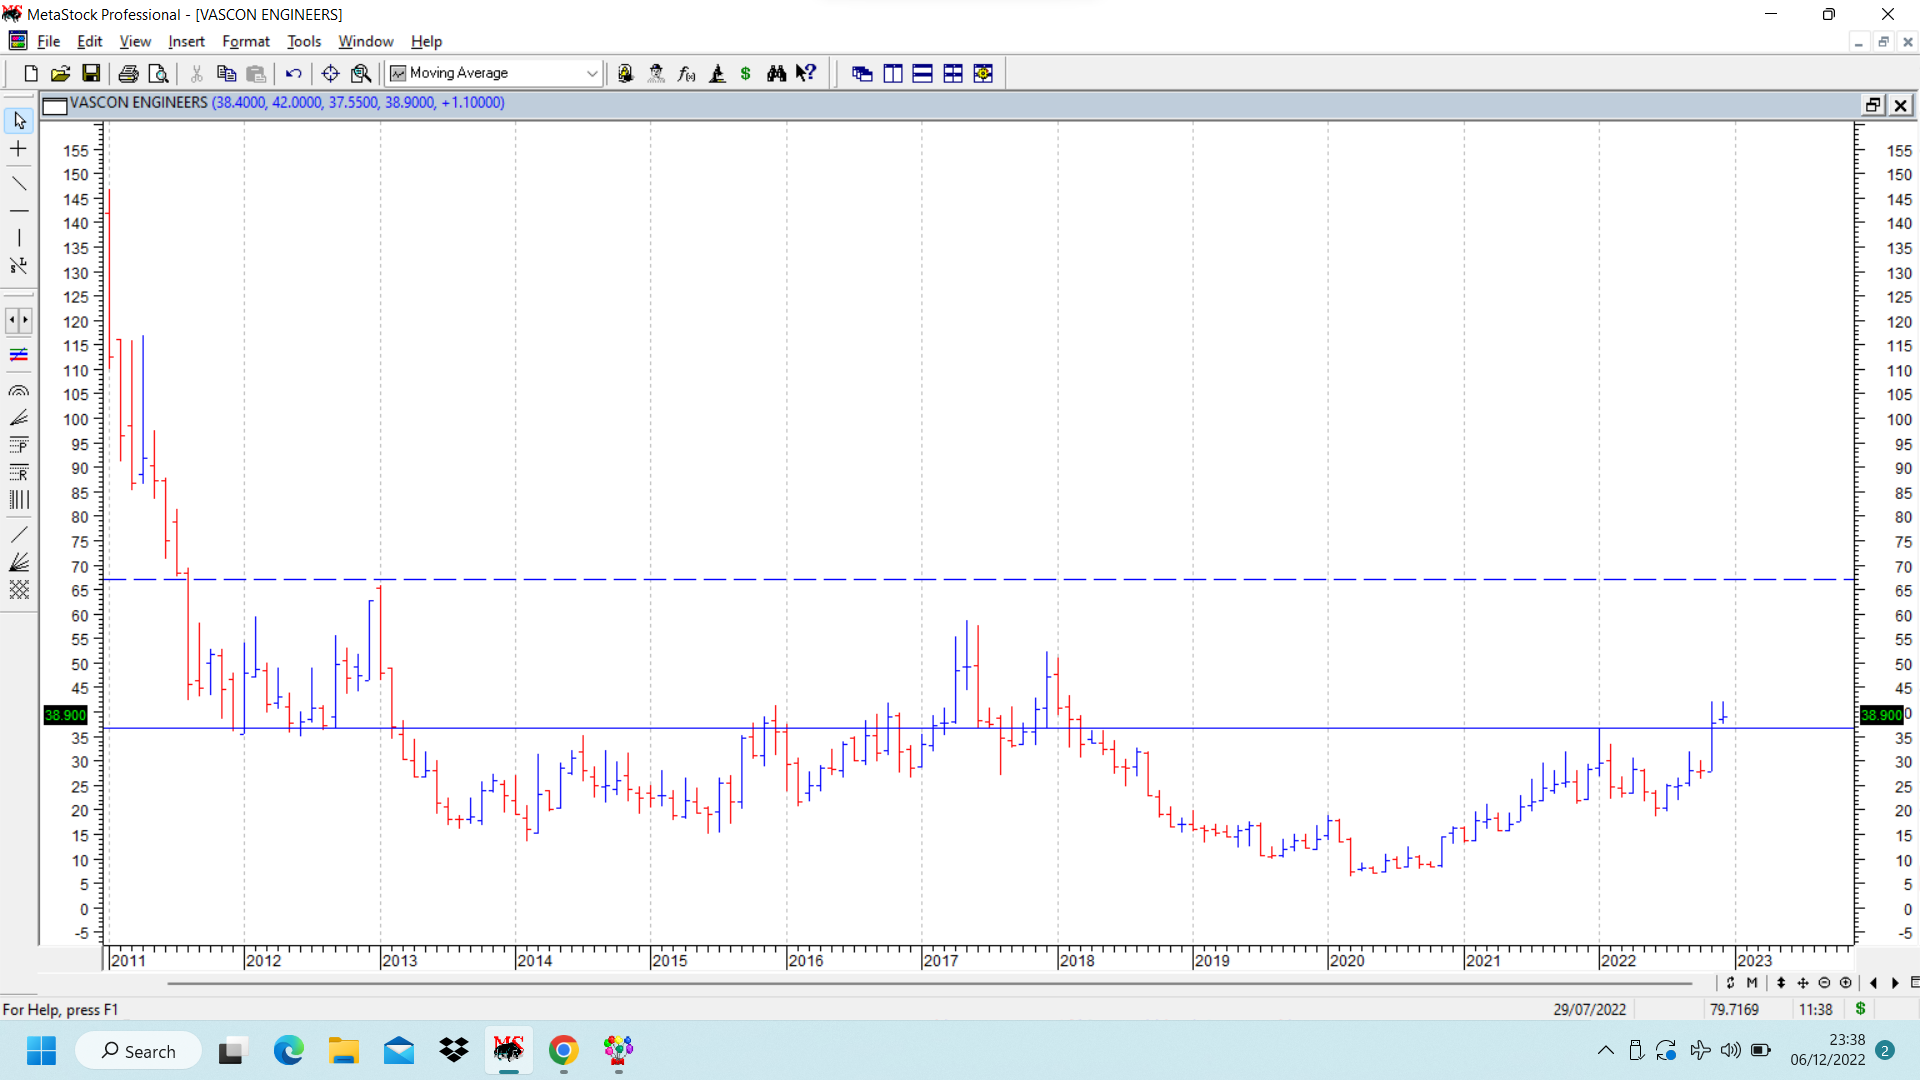
Vascon engg is a construction company with real estate assets. Company has been strenghthening balance sheet by reducing debt. Order book remains strong. Some other infra stocks have started showing decent momentum.
On the monthly chart shown below, stock price broke out above 4 year highs at 36.70, and made a successful breakout above a cup and handle pattern. If the pattern plays out, target can be 67 (marked in dotted horizontal line) , which if achieved, can lead to a 11 year high breakout. disc: trading position.
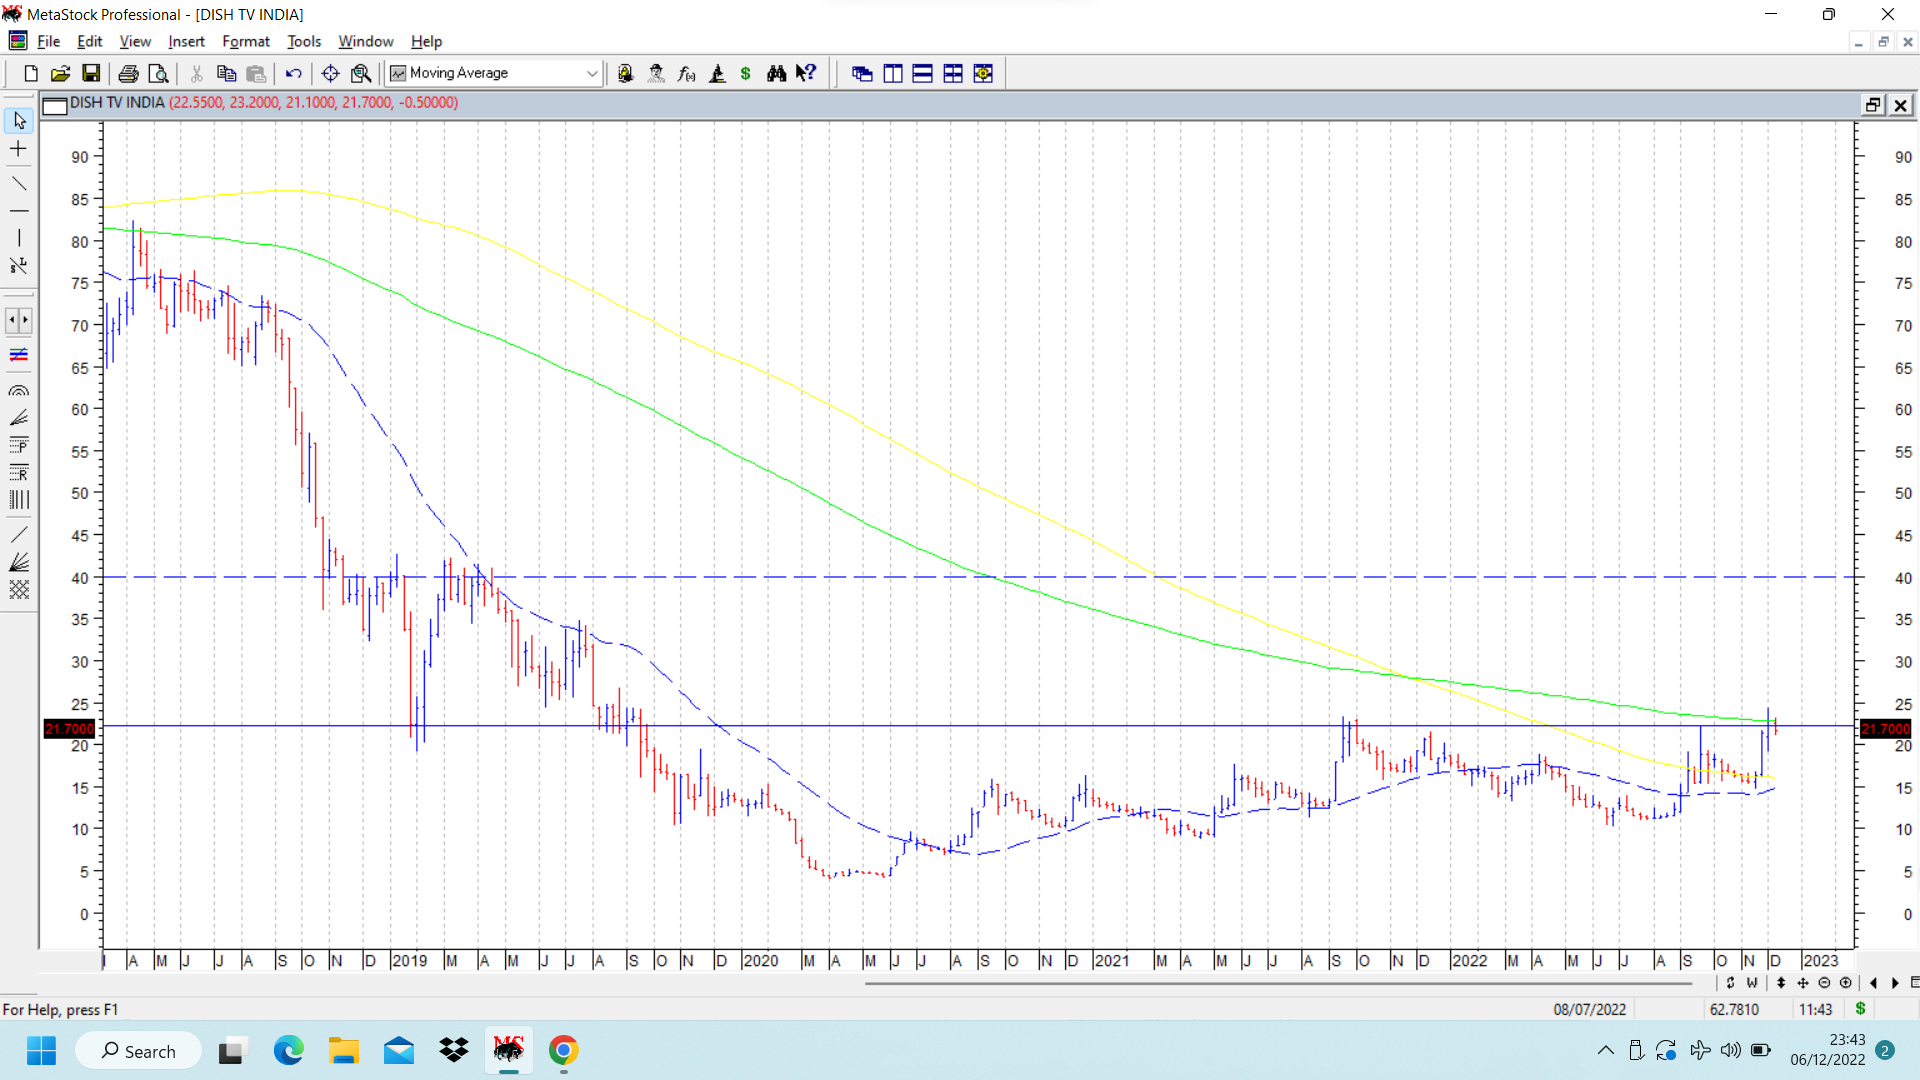
Dish TV weekly chart shows a strong resistance at levels of 21-22, which got crossed recently and now stock price seems to be retracing. Last week there was a 3 year high breakout above 23.35 and strong selling pressure immediately thereafter. Overall looks like a chart worth keeping on the watchlist for some kind of bullish action.
Zee group got acquired recently and there could be some rub on effect on Dish TV. disc: small trading position.
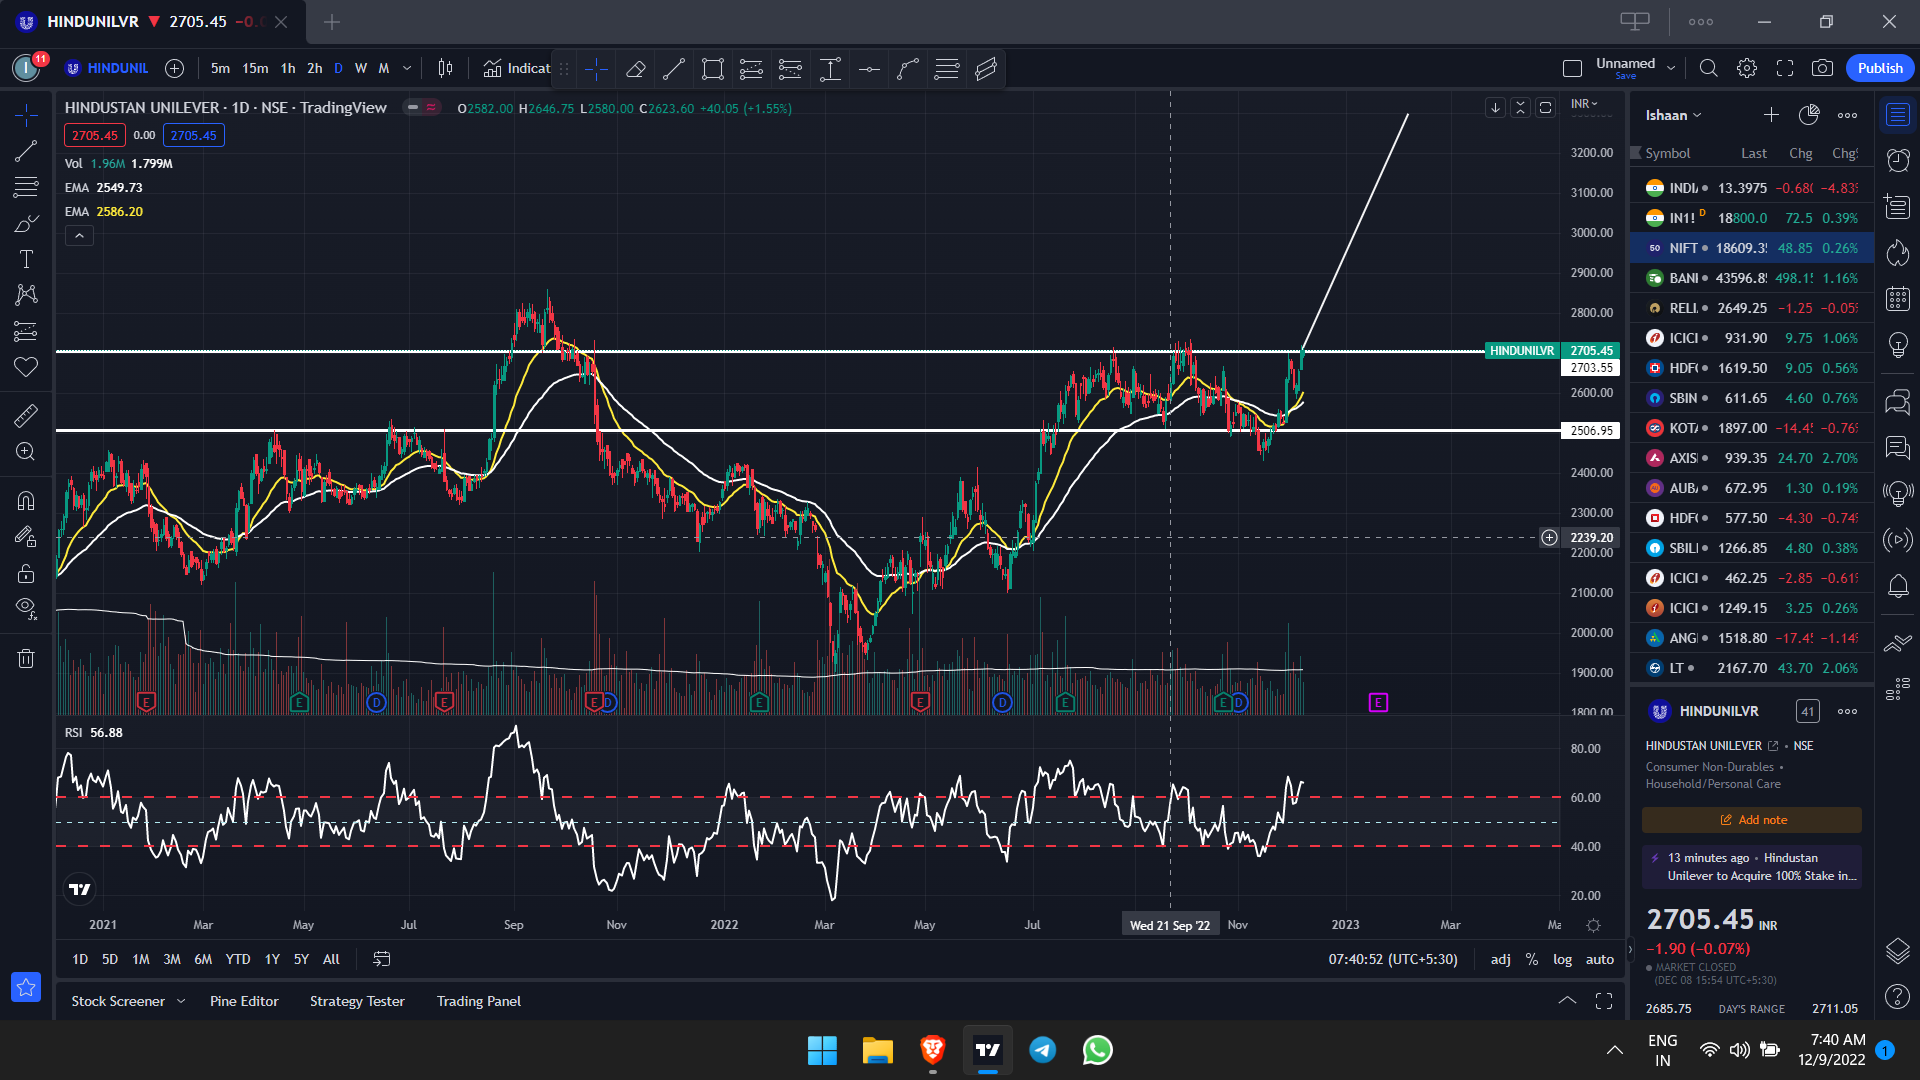
Hindustan Unilever is at its breakout level. I t has been consolidating in the 200 point range and now is moving up with good volumes. The news flow also supports the up move. It has formed a Flag and Pole pattern. If the price sustains above 2700, then 3000 level target is quite achievable.
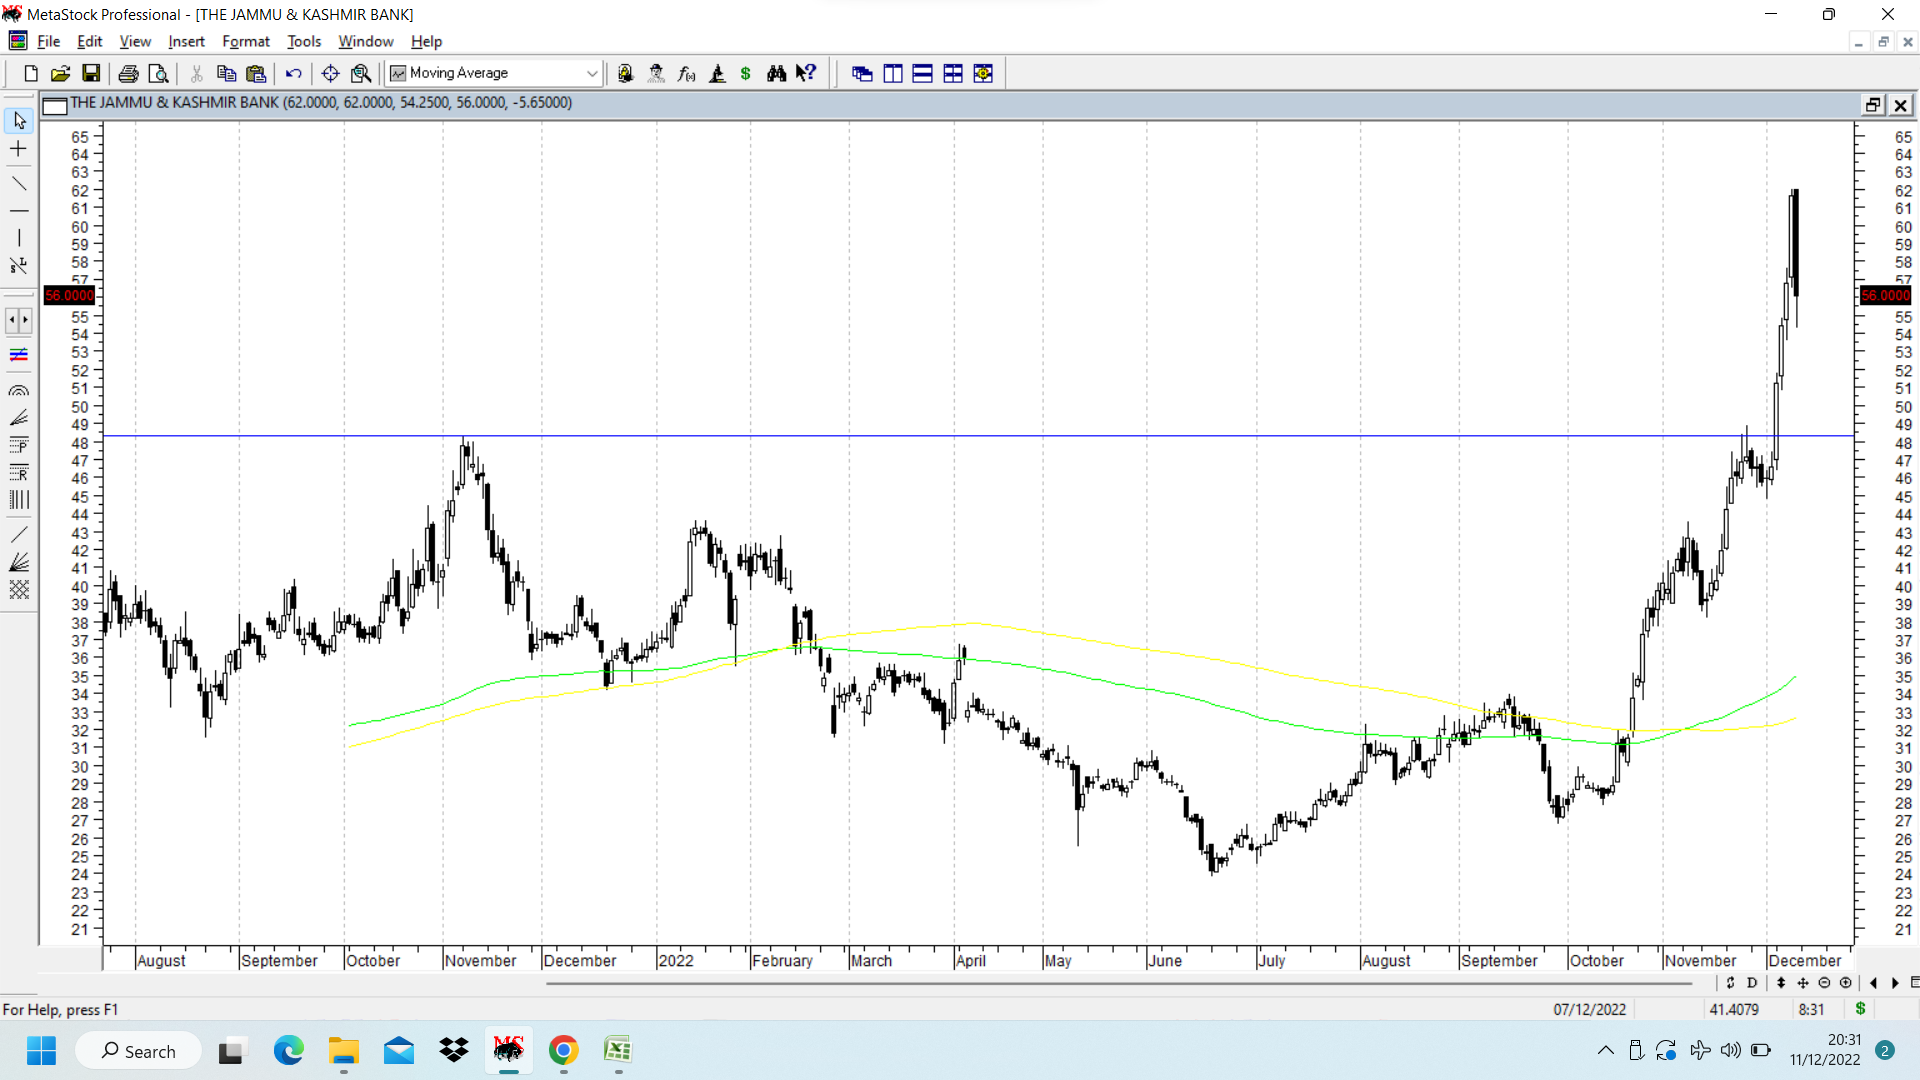
JK Bank was shared in this thread in Sep 2022 and it has had a dream run since then. Stock hit a swing high of 62 on Thursday and on Friday it gave a big bearish engulfing candlestick with high volumes. After such a sharp rally, a bearish engulfing candlestick is usually indicative of a short term top and one should be wary of fresh entry, or if invested, tighten stop losses. 48 which is a 52 week high for the stock should be a crucial level to watch in terms of support on declines. (usually region around 48, so a few rupees plus or minus this level. ) disc: had booked profit earlier, only to see the stock shoot up crazily.
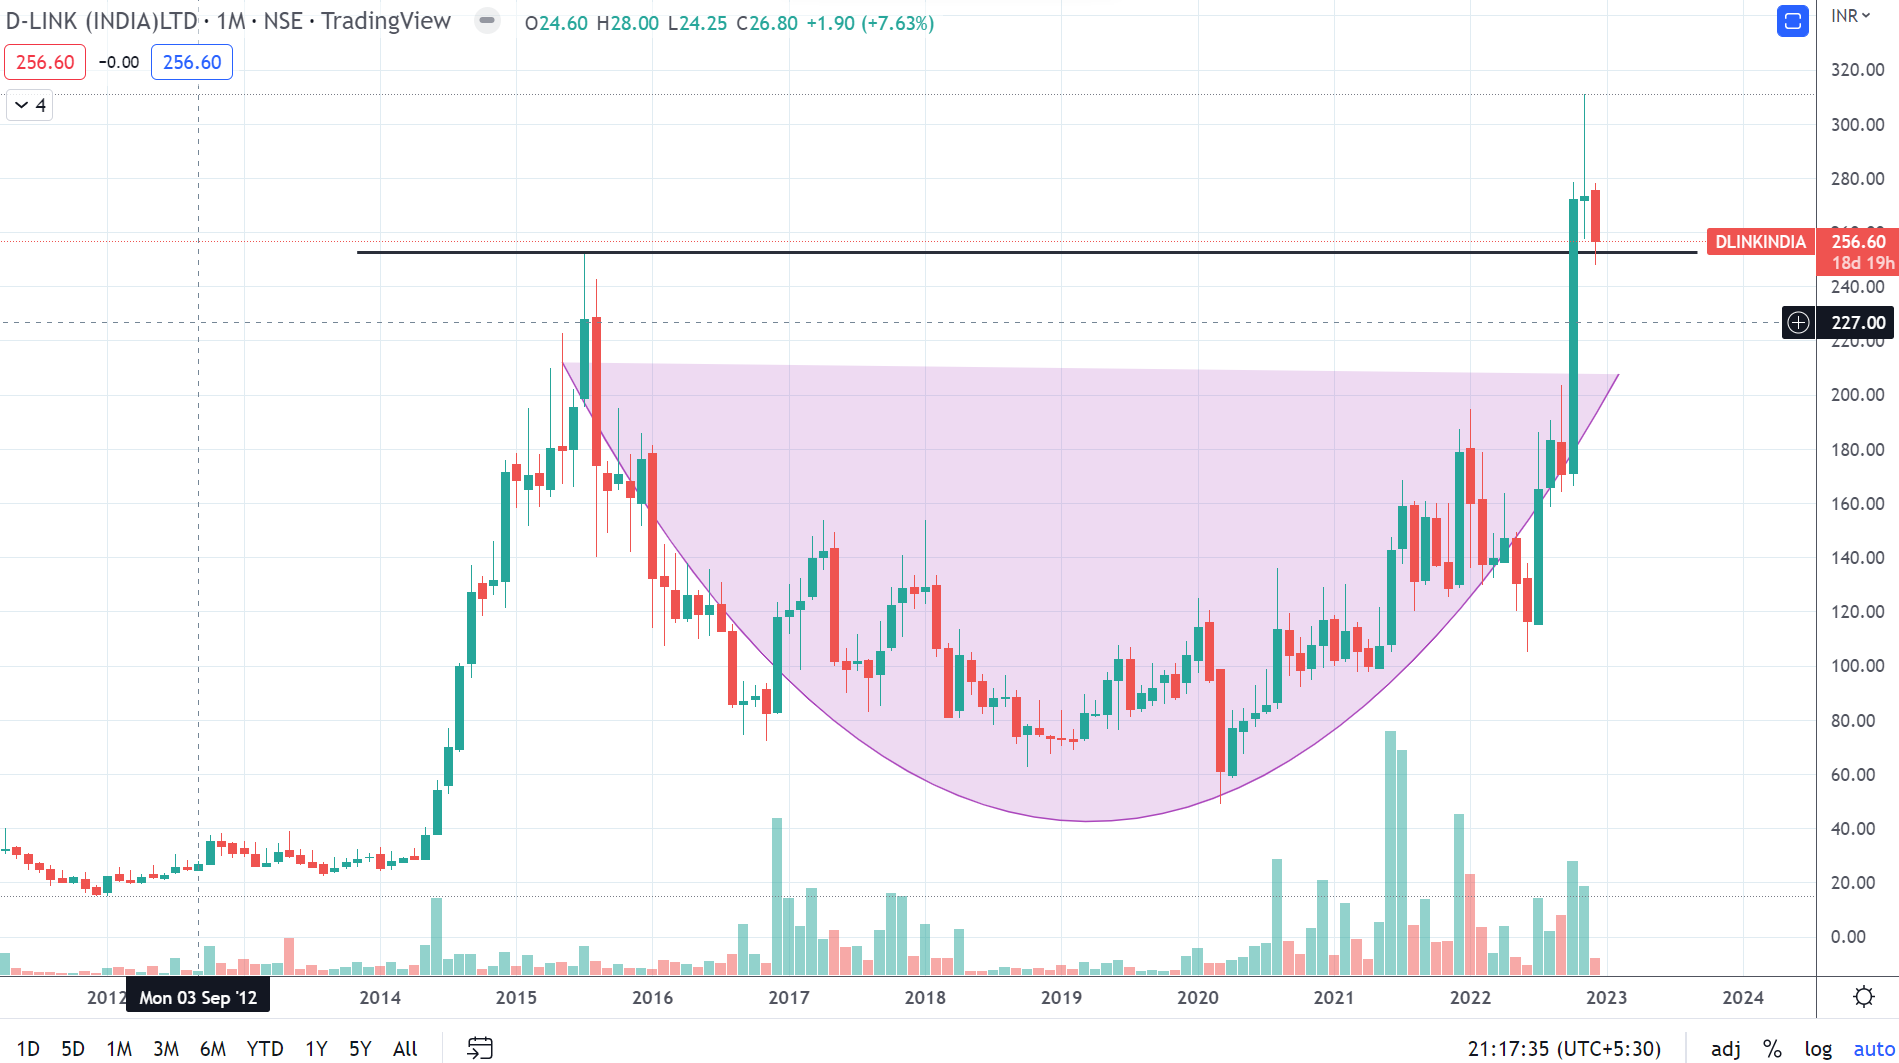
Dlink - ATH breakout and retest. Q2 numbers were solid and space is buzzing - besides general trends of healthy demand of end products, PLI is keeping some excitement for some players(still unclear if Dlink has qualified, AR does mentions key focus on mfg in India via contract mfg ) , Anti china makes Taiwan an ally for world and probably for India too given sensitive nature of products. Stock has broken out after 7 years, significant upside potential. Valuations comfort vs Peers like Tejas network etc.
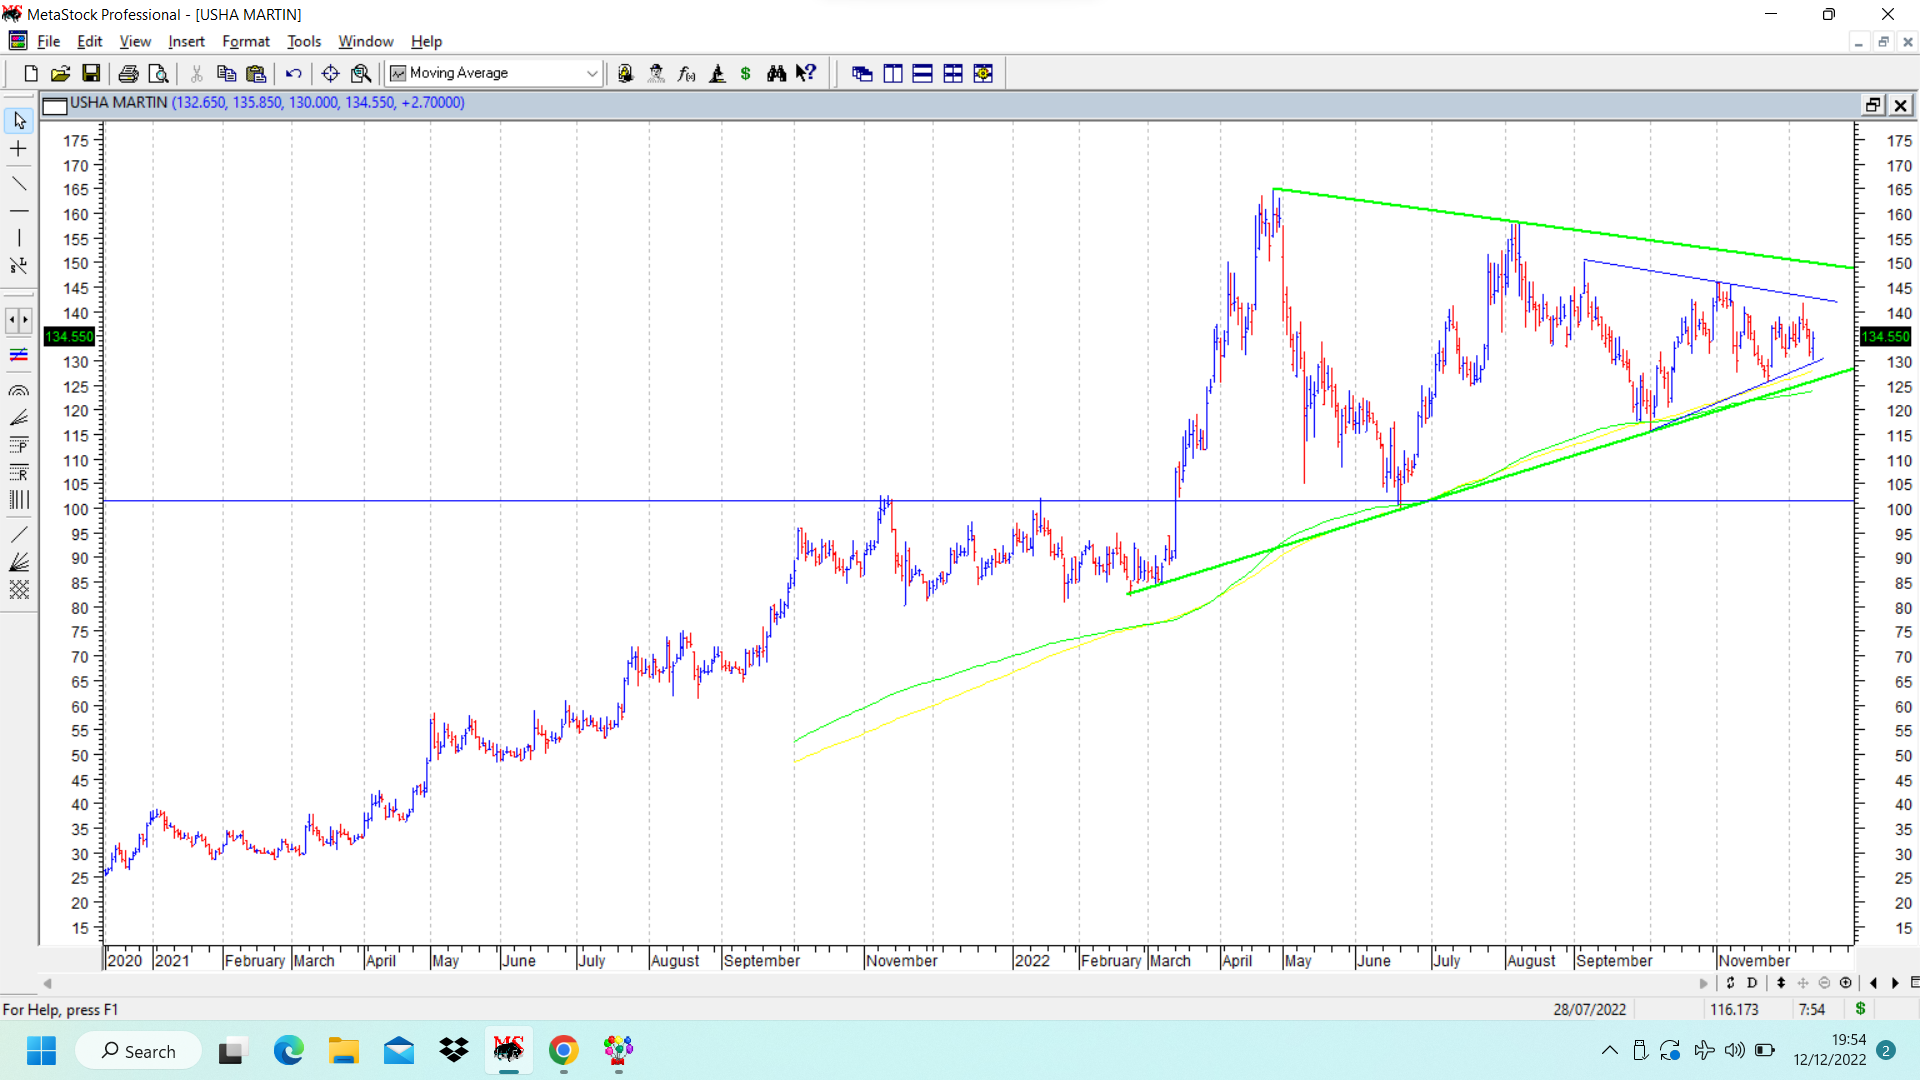
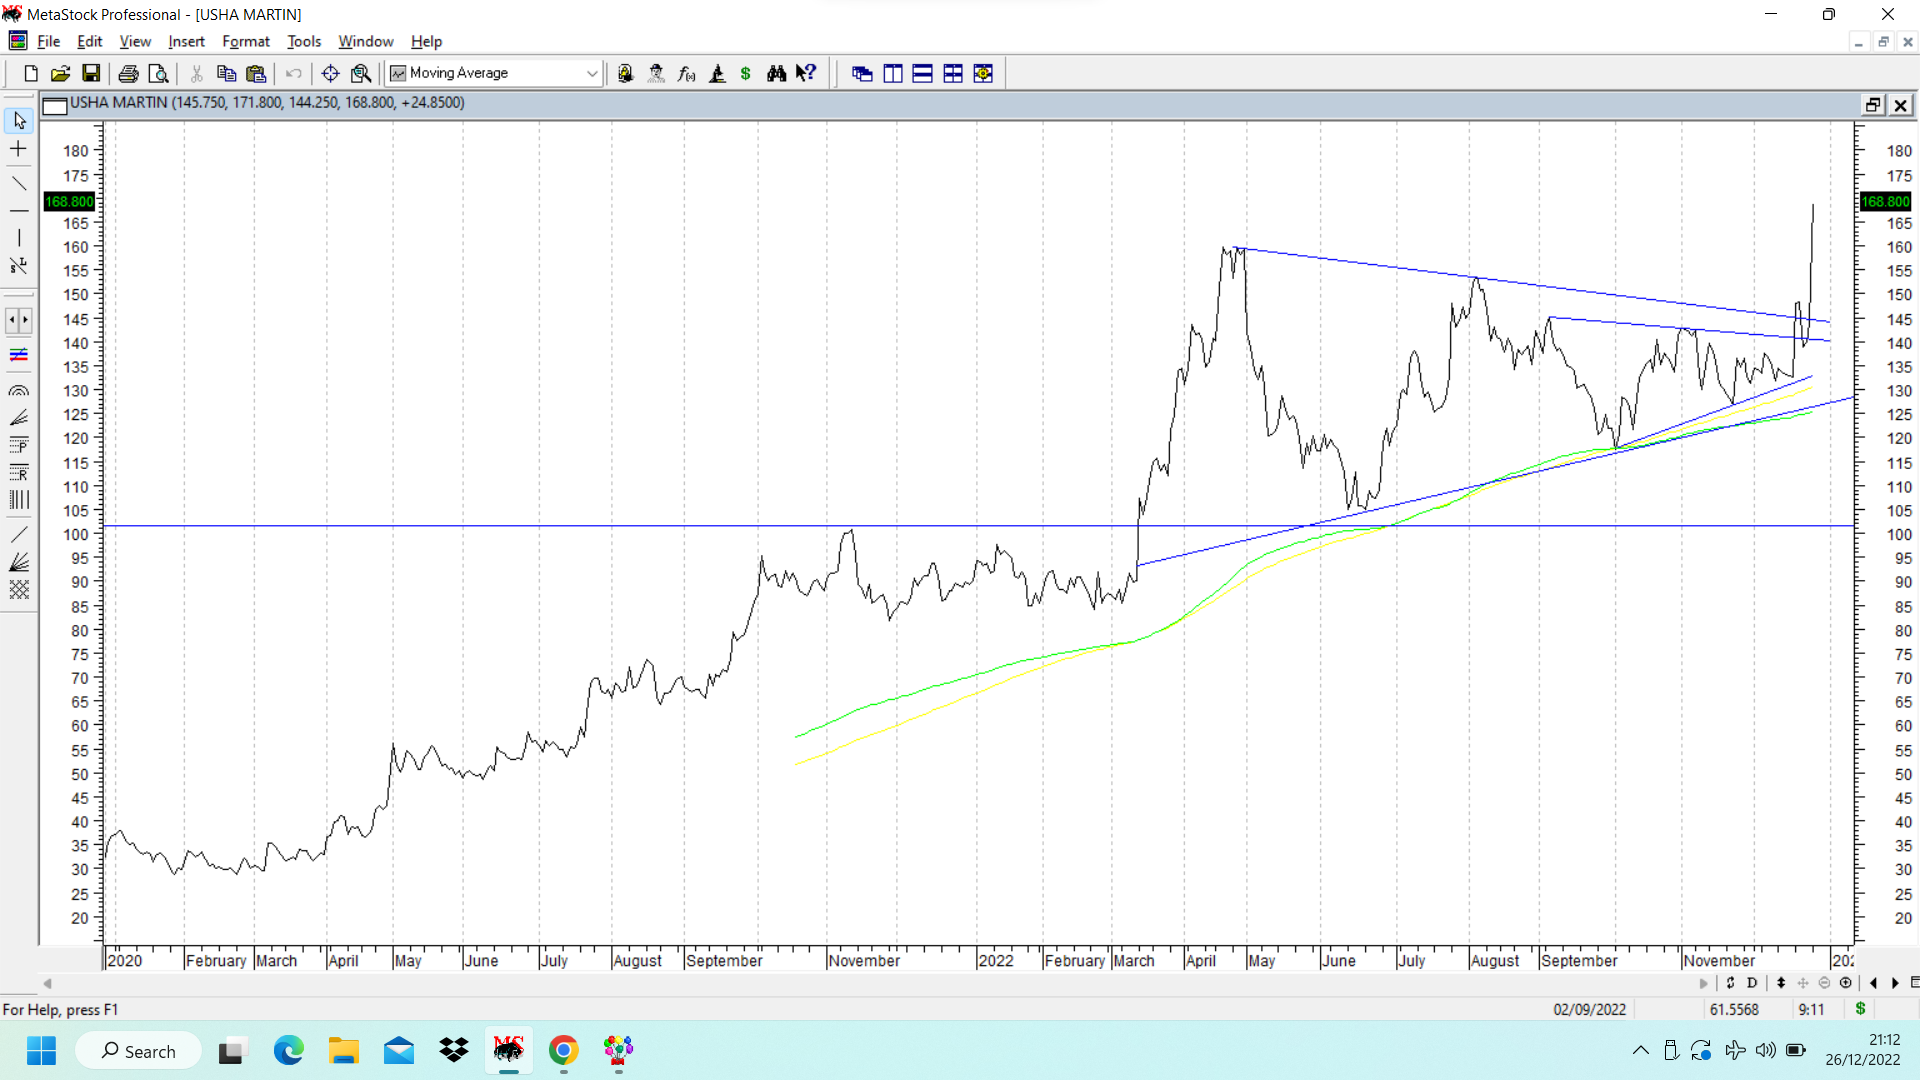
Usha Martin chart continues to show the symmetrical triangle and breakout is still awaited. Contracting triangles indicate a contracting nature of prices and volatility and this pattern has been forming now for over 9 months, since March 2022, ever since the stock price broke out of a strong 12 year high of 100. After this breakout stock price hit a high of 165 and has gone into consolidation. It has also tested the 200 dema twice in the past few weeks, once in June 2022 at 99 and then in Oct 2022 at 120.
Fundamentally speaking, with the sale of the commodity steel business, it has now become a steel converter business, which is relatively insulated from volatile steel prices. Debt burden has also come down drastically. All in all, it seems quality of the business seems to have improved. It can be an interesting “India manufacturing” story going ahead if its plans to attain global status as a supplier of its products fructify.
Within the larger contracting triangle marked in green, a smaller contracting triangle is now forming (marked in blue lines) whose breakout is above 143-145. If it breaks out above the latter levels, it could be the first sign of strength and finally we have to look out for major breakout above 150. Triangles are tricky structures and require a lot of patience as an investor/medium to long term trader.
disc: continue to remain invested, with a bullish view.
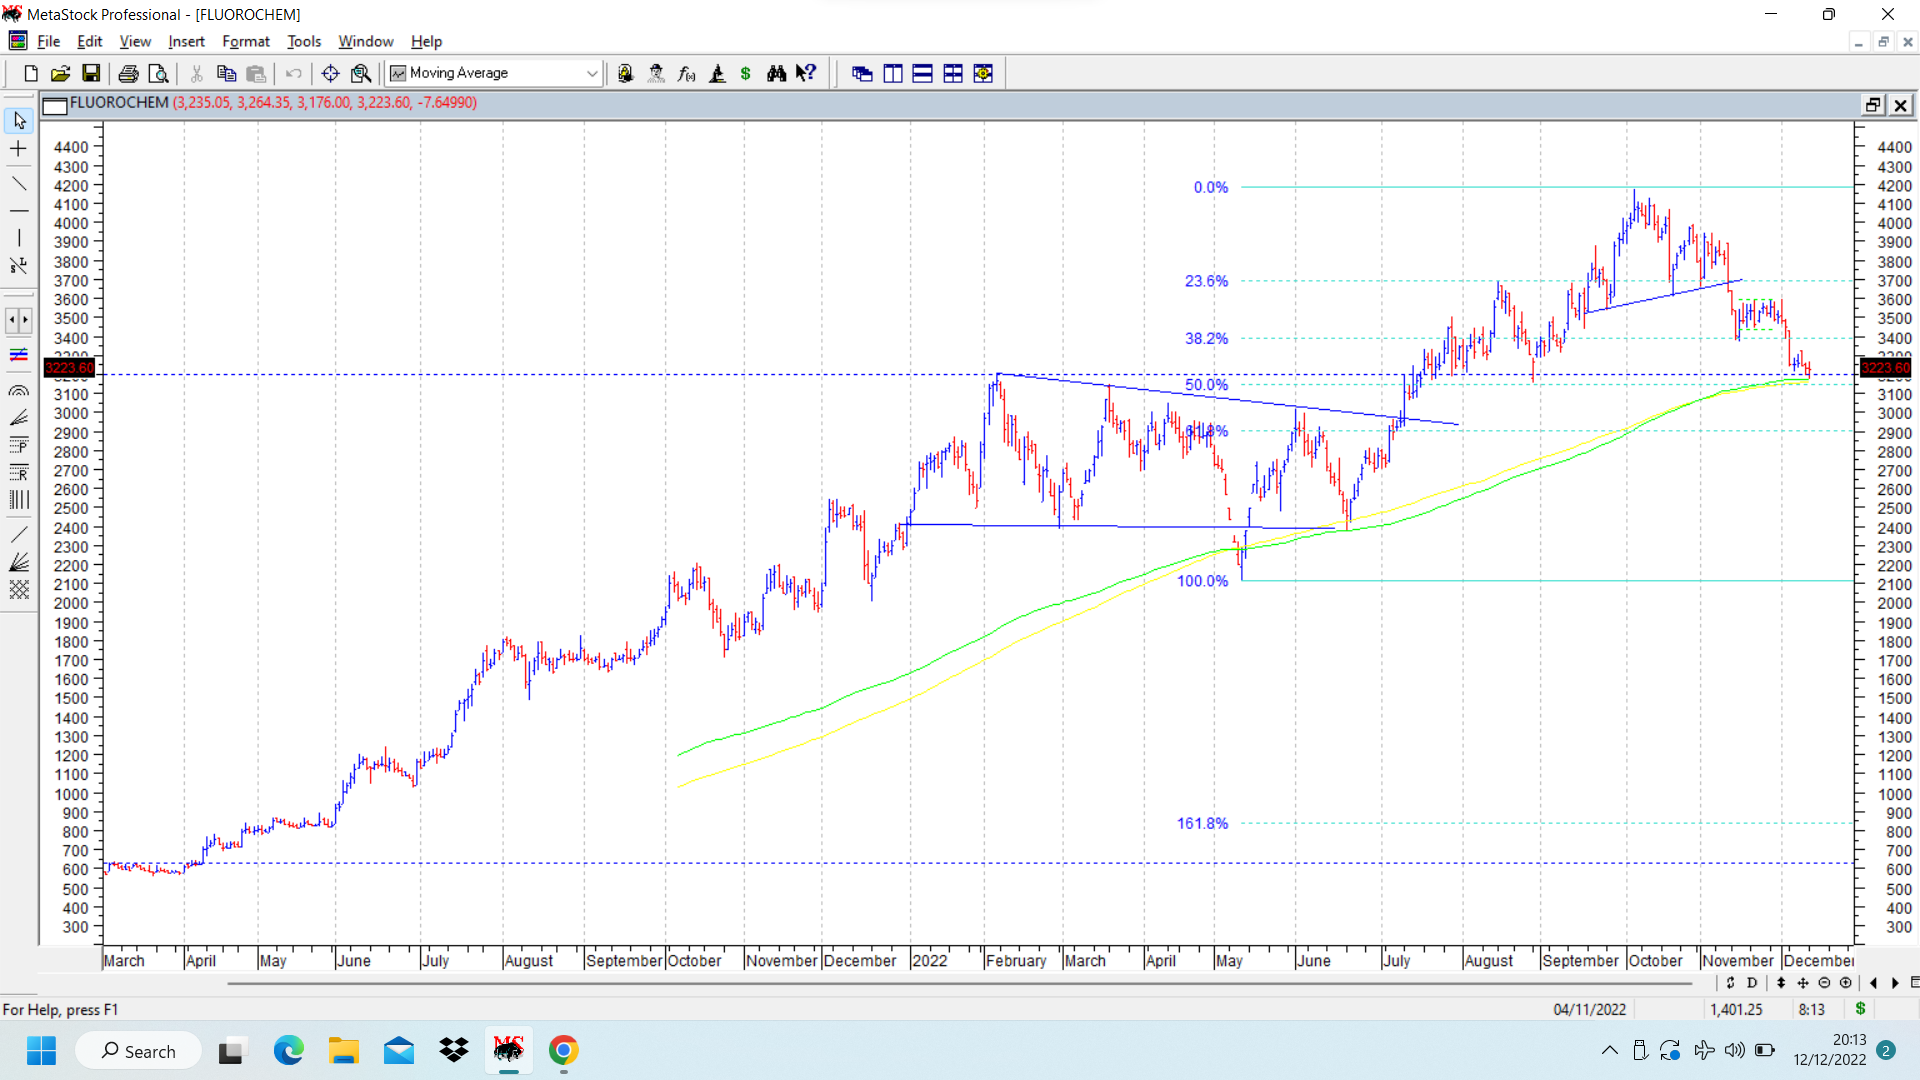
Fluorochem has been under sharp correction ever since its q2 fy 23 results. Results have been quite decent and post results research reports all indicated higher prices. But once all the good news is out, and most investors and analysts start getting bullish, stock prices have a way of confounding everyone.
From a high of 4174 in Oct 2022, stock price has corrected to a low of 3176 today, and managed to close above 3200. Now there are certain interesting observations to make on the chart and the importance of the levels of 3170 and thereabouts.
Firstly, the above level is at 50% retracement to the entire previous rally from 2112 to 4174.
Secondly the above level is close to the previous major peak of 3198.9 posted in February 2022. Since the high posted in Feb 2022, the company has posted to back to back stellar quarterly results in the form of June and Sep 2022 quarters and the commentary related to demand environment and capex remains strong.
In the past there have been major supports between 3100-3200. The targets of a bearish head and shoulders breakdown marked on the chart have almost been achieved.
The current level of correction is not new to this stock. But it follows a very unique context - the promoter sold their ~3.5% stake. As of now, there is lack of any downside reversal pattern on the chart. Only positive aspect is that price is resting at 200dema.
Anticipated good business performance is known for sometime and shall be already in the price.
What kind of price action would make you to switch from ‘hold’ with bullish view to ‘sold’ with bearish view?
Which type of daily chart you will use to base the above decision?
I ask the above from the perspective of anyone who might be considering this as a crucial juncture to initiate a new position. This will also help to understand your approach to decide on liquidating a position since you do not practice a mechanical (formula based) approach.
Fluorochem for me is more of a fundamental story and that’s how I view it. The results till now have vindicated that view.
However if it breaks down and starts closing below crucial levels for a few trading sessions, I would consider reducing my position and adding back on signs of strength. So I would like to view for next few trading sessions how the stock behaves and how the support zone holds out. Then I would take a call.
Its precisely because of situations like the current situations that I prefer to follow my own methods of multiple inputs while trying to use stop losses in positions, rather than use absolute numbers or mechanical formulae.
If I had followed daily charts closely, my exits would have been on breach of the head and shoulders breakdown, but that’s something I missed. But then as an investor I do not have to act in haste and do anything rash. Idea is to take things as they come and first see how things pan out and then decide a course of action.
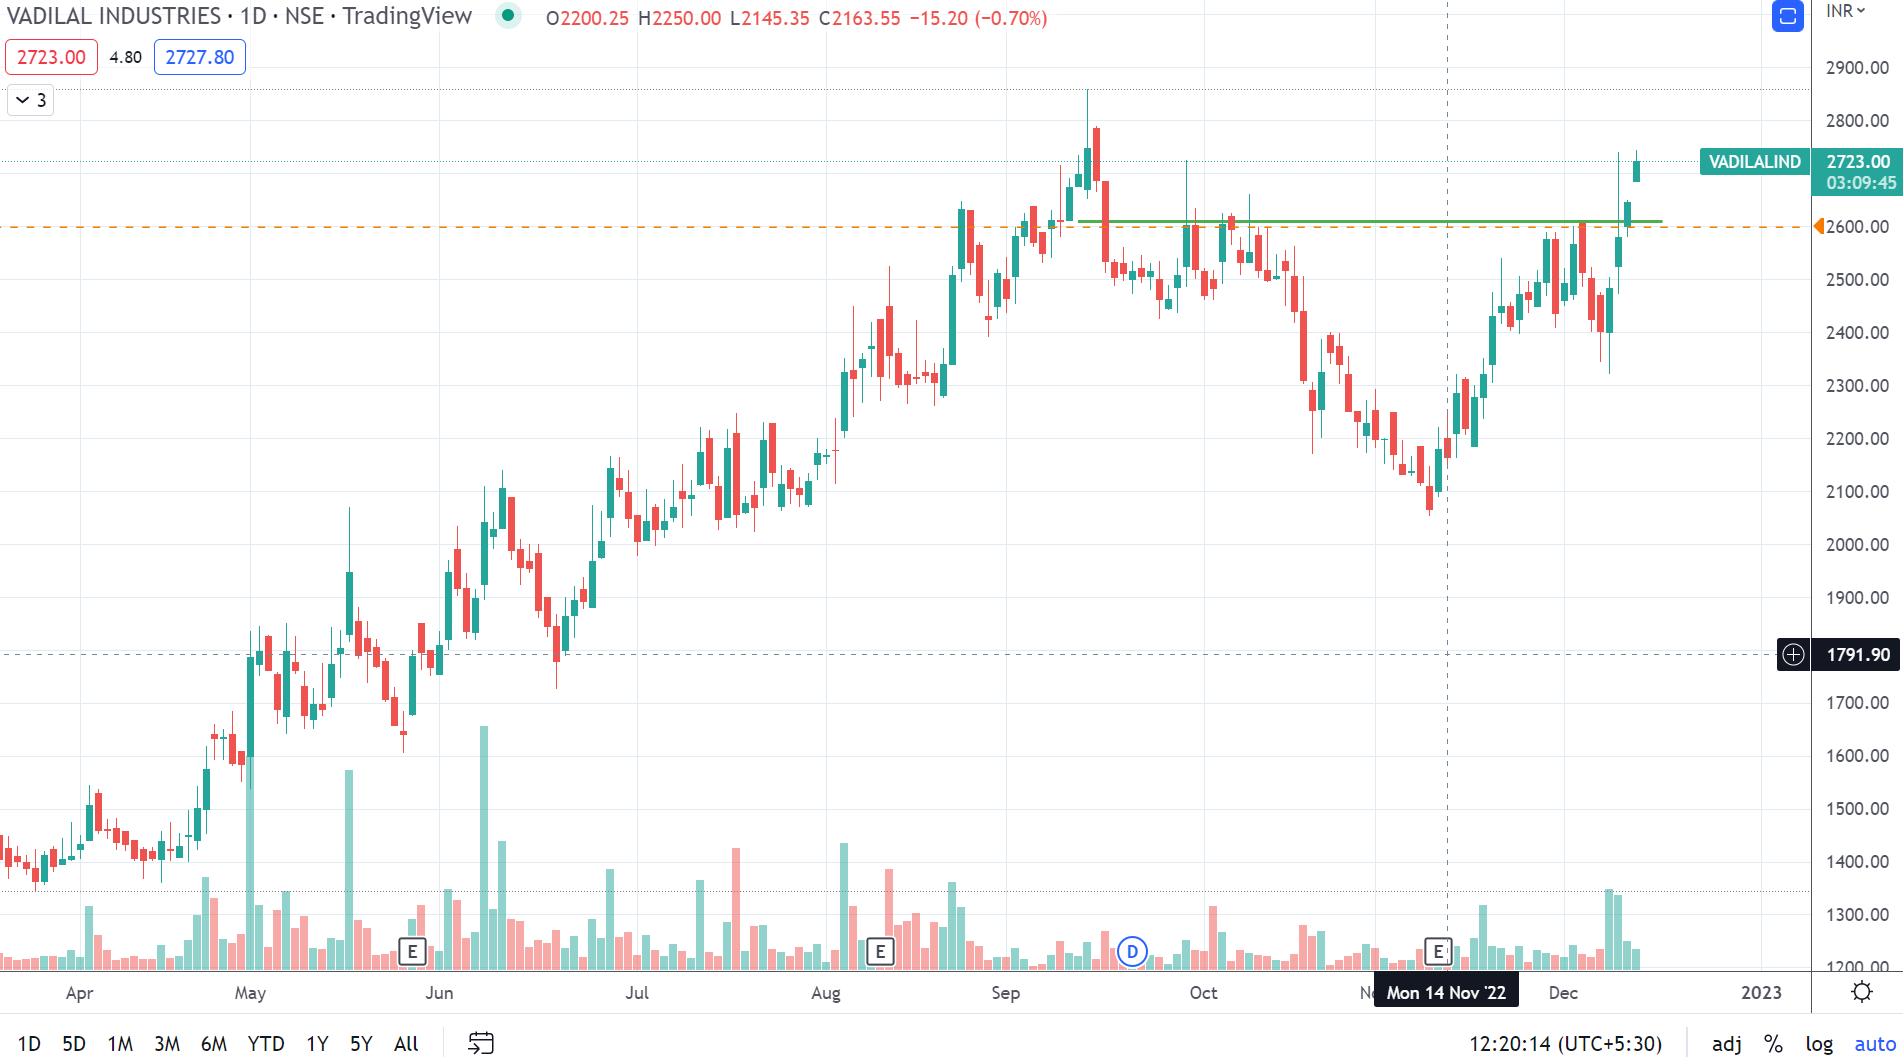
Vadilal Ind - IH&S visible with good volumes, decent consolidation of last few months, kind of special situations case - more details in Vadilal thread.
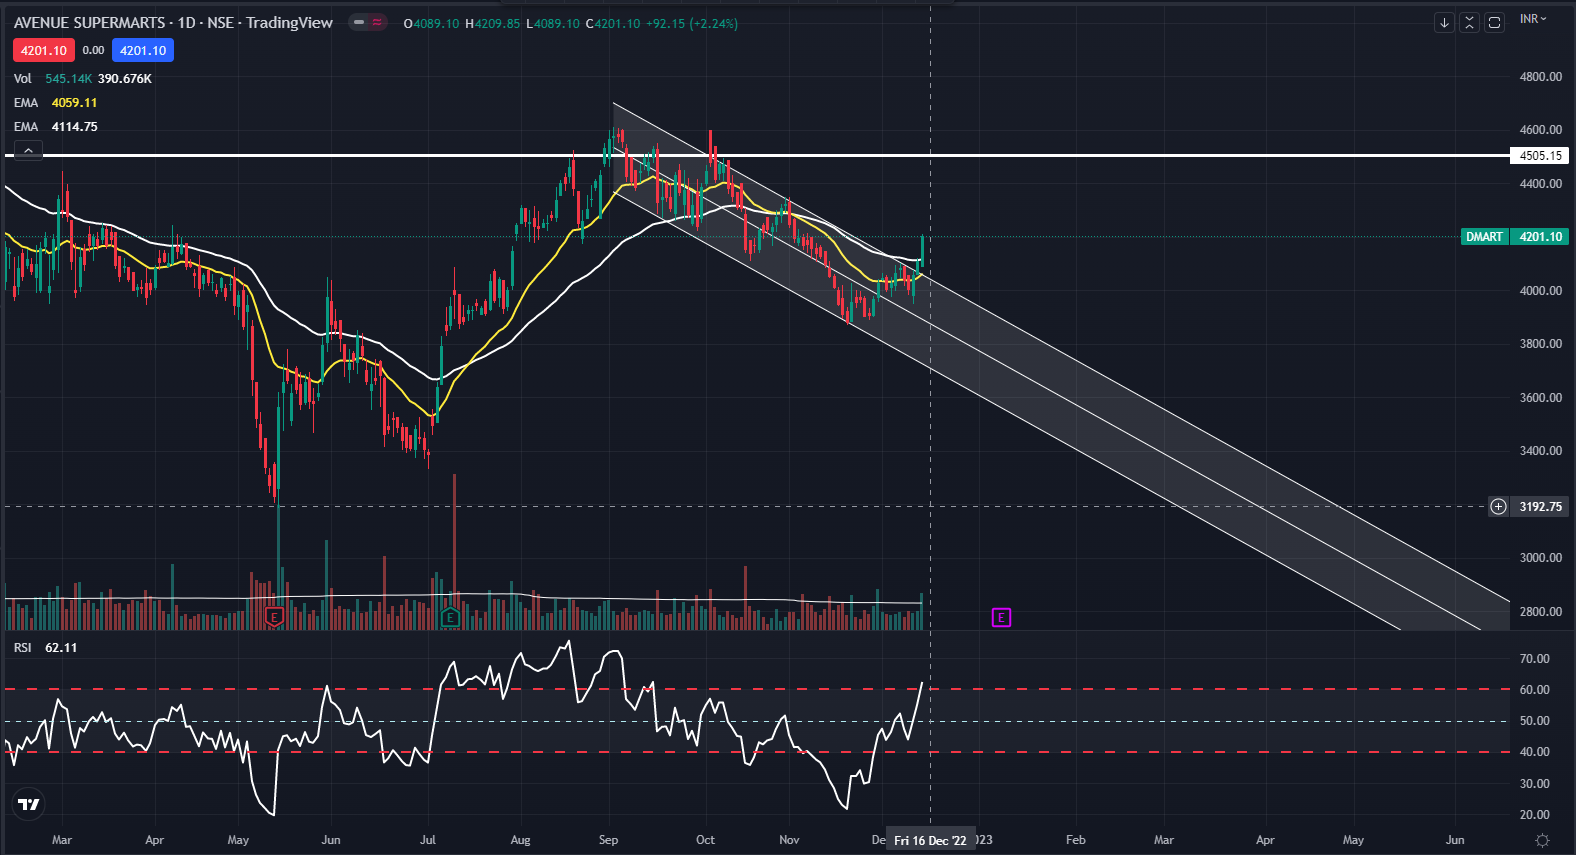
Dmart formed a downward channel and broke out recently. An entry on the 20dema or 50dema can be good opportunity. Recent high of 4500 is very possible.
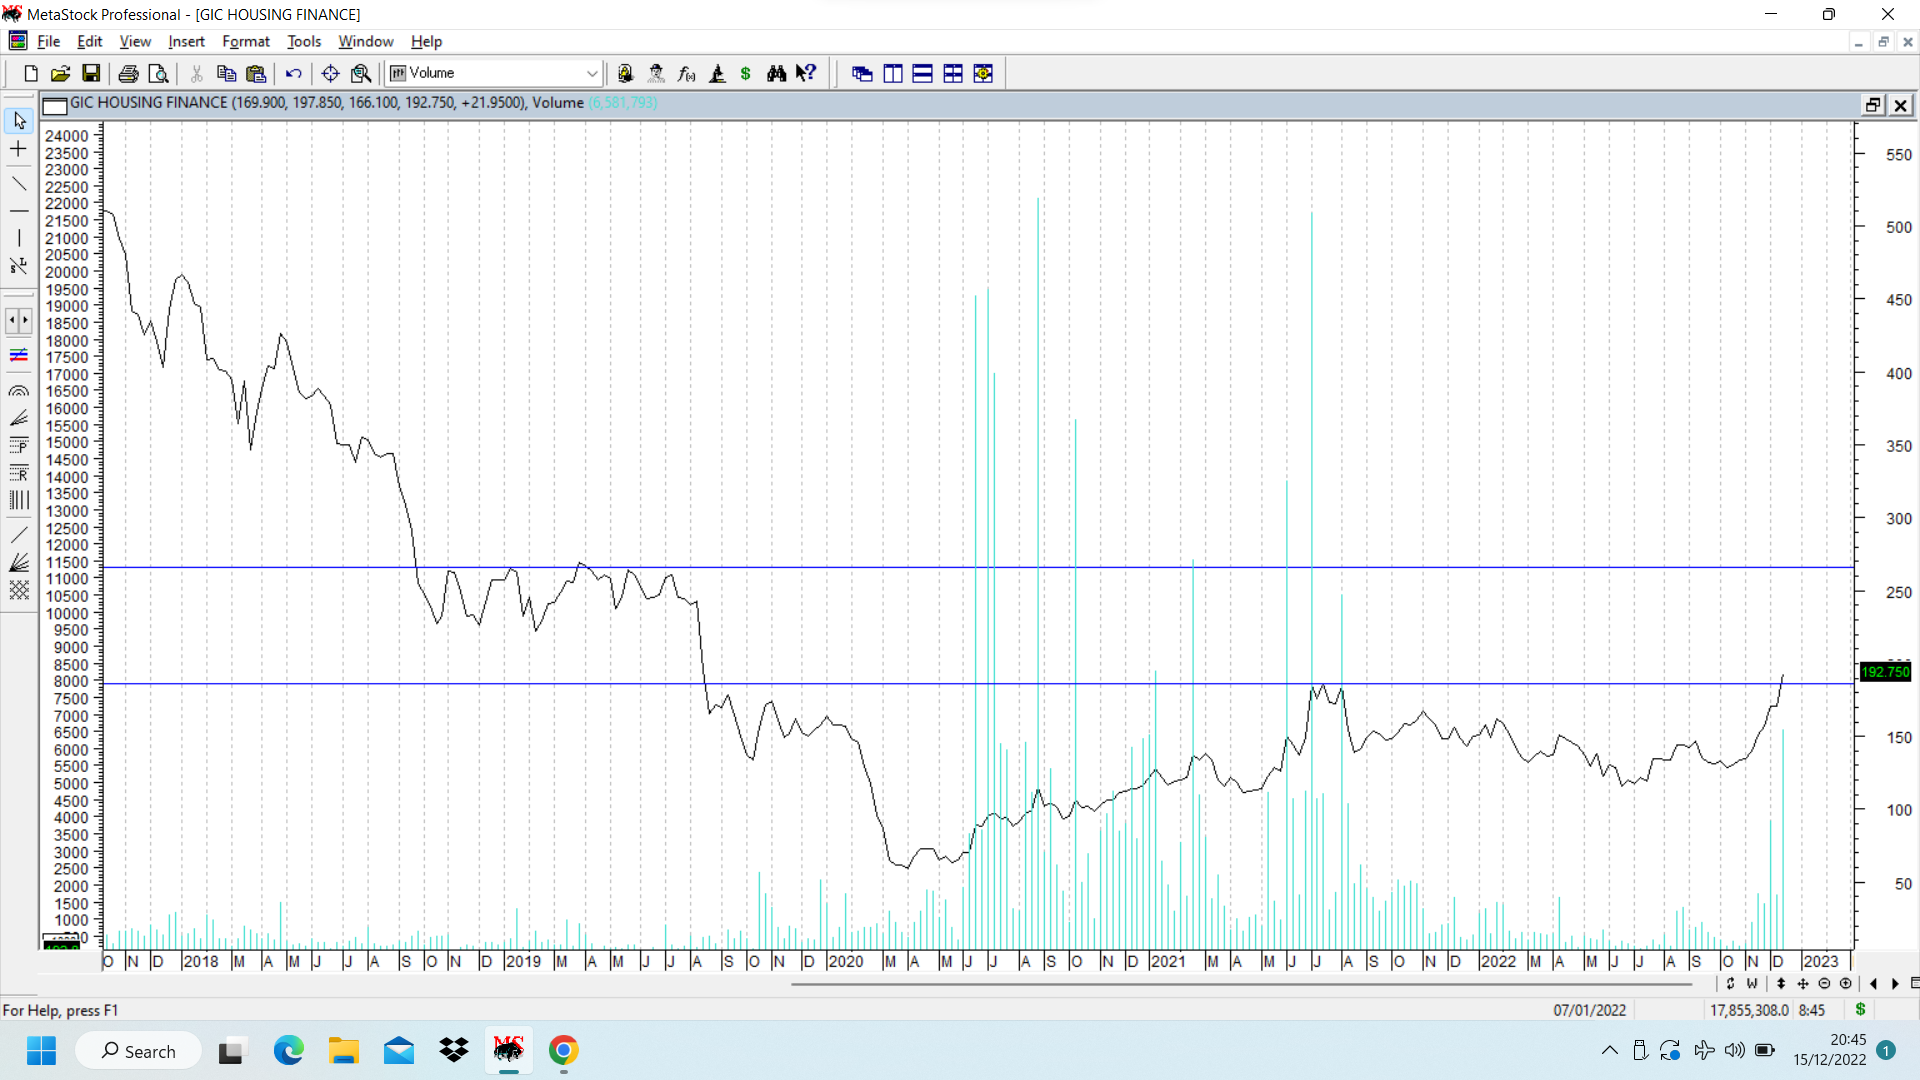
GIC Housing finance chart was discussed a few days ago, when it managed to cross its 52 week high. It has shown strong moves this week and managed to close above 190 today.
Coming to its weekly chart, if it manages to close this week above 186, it will be highest weekly close for 3 years. Volumes this week have been very high along with the strong upmove. Next imp resistance on weekly line chart would be 265. disc: invested as disclosed before.
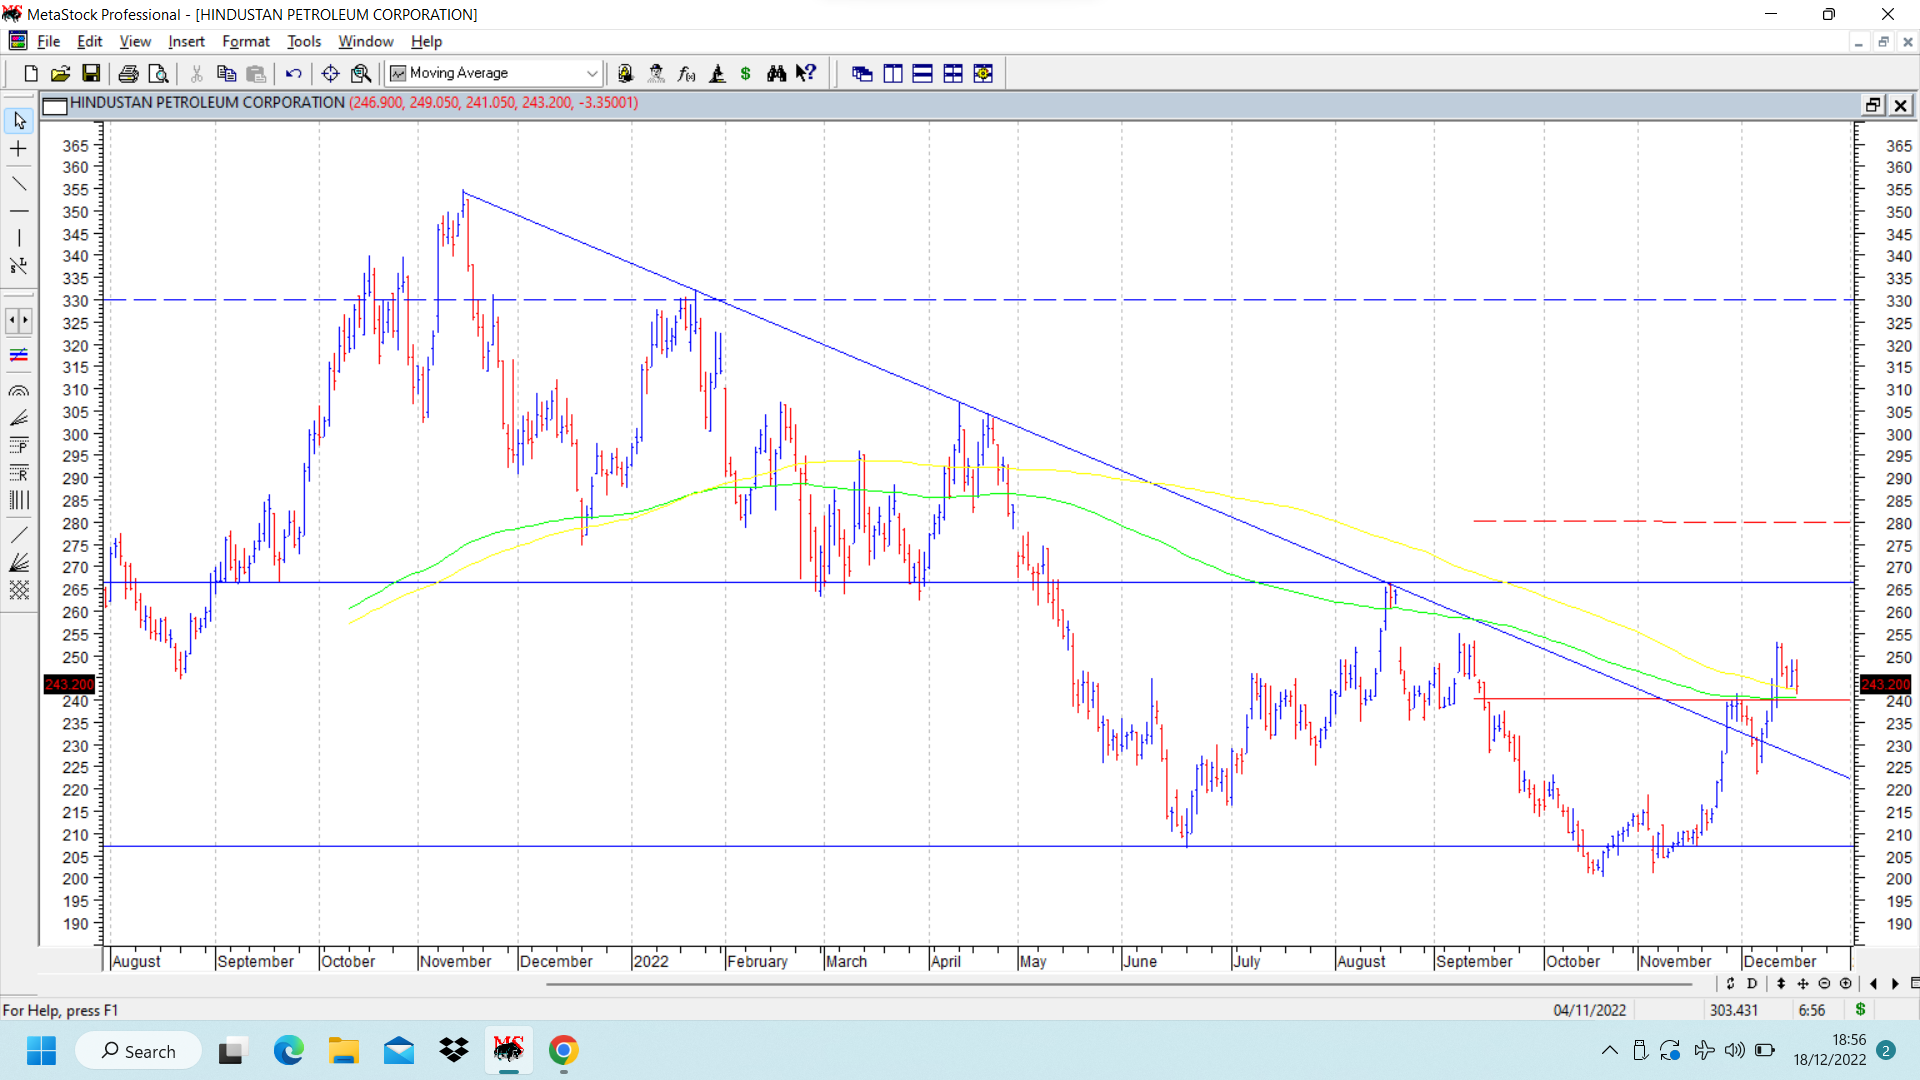
Hind Petro chart is a very interesting chart which is showing a confluence of various patterns in the same daily chart. In the chart displayed below, following technical events have happened to warrant a closer look at the stock . CMP 243.
First is a breakout from a falling trendline. Almost all the touchpoints are perfectly touching the falling trendline.
Secondly, there is a small cup and handle breakout on daily chart (marked in solid red line) above 240. Stock price briefly went above this level and now is trying to retest the breakout zone of 240 which also happens to be the value of 200 dema. If pattern plays out then target for the pattern can be 280 level (marked in dotted red line) which will cause a breakout above double bottom pattern as discussed in next paragraph.
Thirdly, there is a double bottom at levels of 200-205, and its breakout gets confirmed on a move above 265-270. If this happens successfully and pattern plays out, the stock price target based on this pattern will be 330.
I do not have any position in the stock, but for such a pattern my buying equation would be buy and accumulate at around current levels, with a stop loss of low of cup which is 223, (so to avoid any whipsaws I would prefer to keep a stop loss at around 220) and aim for sequential targets of 280 and 330. The stock remains on my watchlist.
Many a times guys new to technical analysis do not know how to take technical breakout positions with clear cut levels. Above is not a recommendation, but since the chart shows very clear levels based on patterns discussed, I have put up this chart for academic purpose.
Fundamentally the crude prices have corrected significantly of late and the marketing margins will improve a lot for these oil marketing companies. ( This has to be taken in the backdrop of fall in refining margins looking at higher priced crude inventory they might be carrying. )
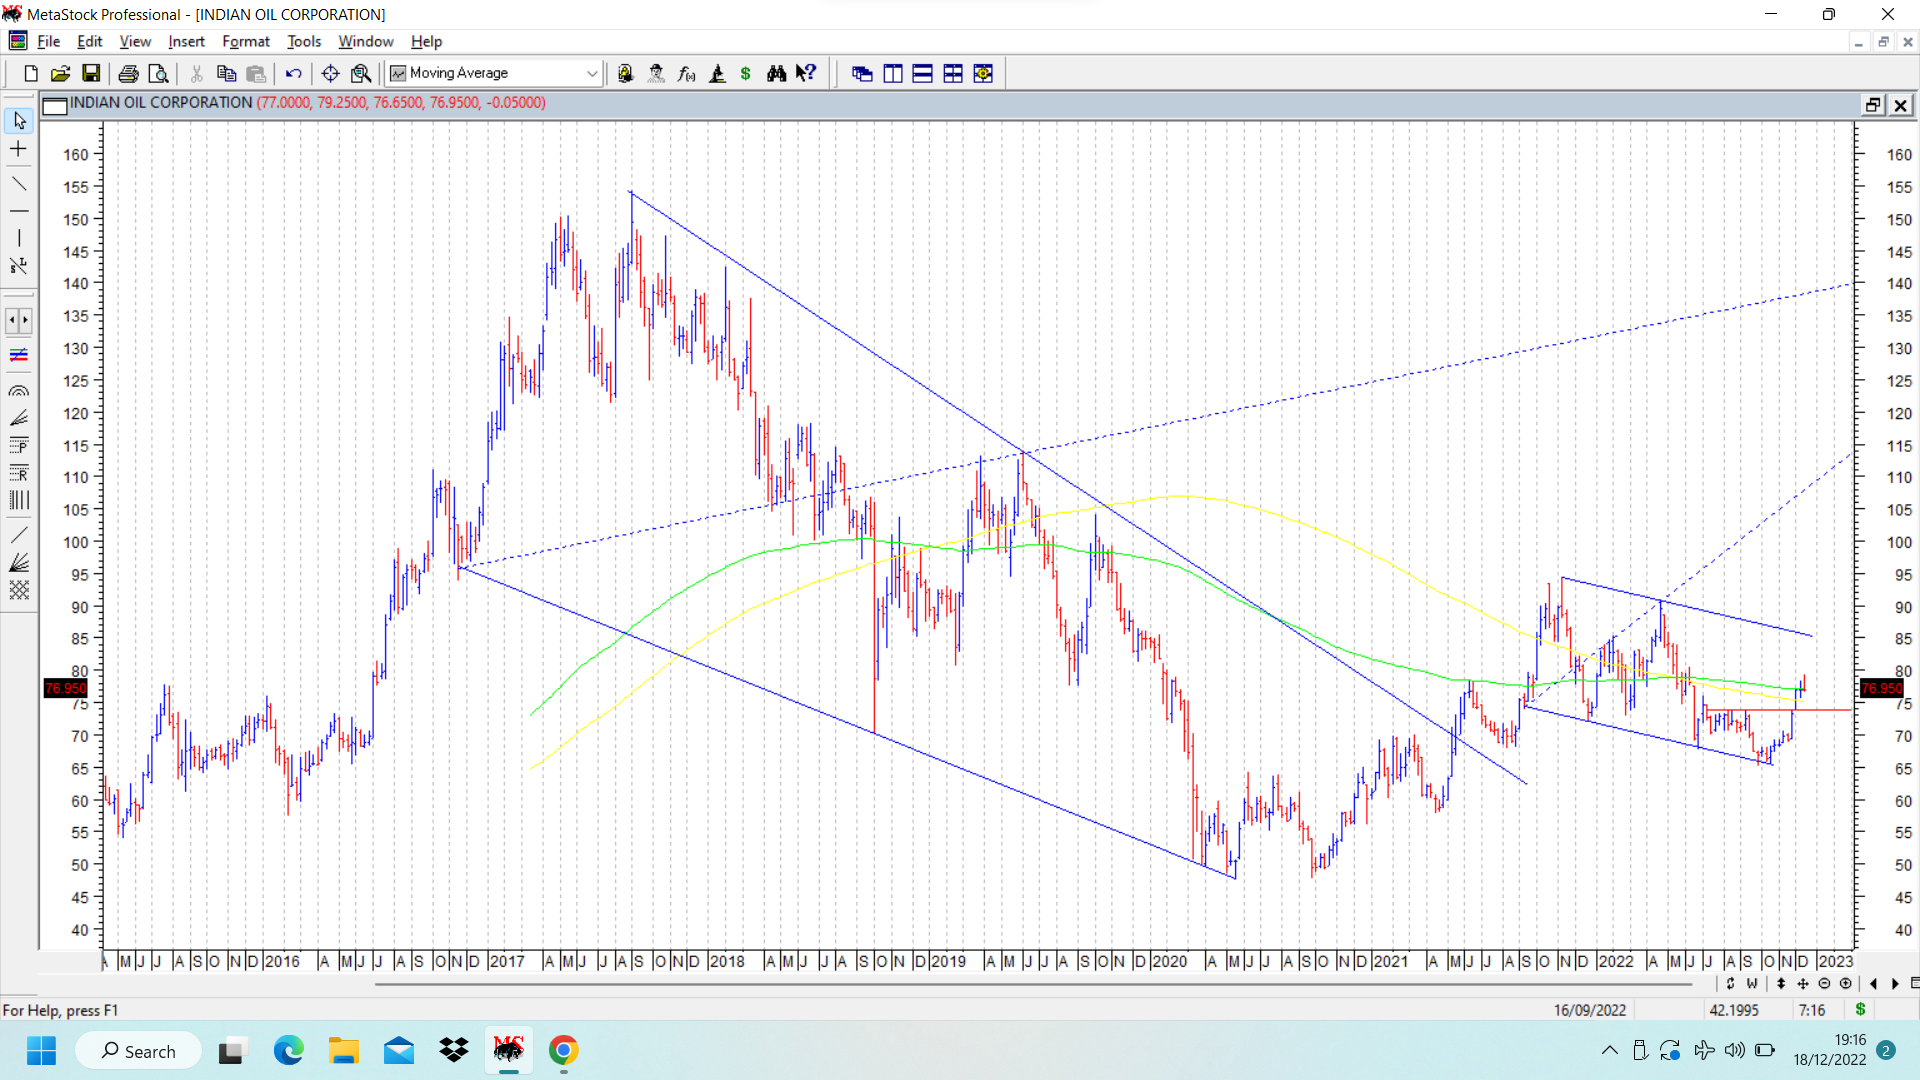
Indian Oil corporation chart put up below shows two Wolfe Waves, one on longer term time frame and the other on right, on shorter term time frame, both depicted on weekly charts.
cmp 77. An important level market on chart is that of 74, which previously acted as a strong resistance as shown by horizontal red line. Recently stock price crossed that level, and has been consolidating above that level. We need to watch out for support levels of 74 and below that, 70. 200 dema is also placed at 73.55 and moving up.
On the two weekly Wolfe Wave patterns marked on chart, targets are 115 and 140, which I am looking out for sequential targets in the chart. disc: invested as a techno funda bet. (Funda logic is simple, based on fall in international crude prices, which could lead to improvement in marketing margins, though affect refining margins)
@hitesh2710, Thank you sir for the charts on hind petro and iocl. Looks like OMC sector is getting the market fancy. Only issue is govt regulation though govt says it deregulated. Can Reliance be bought to ride this OMC up trend? Reliance is still oil and petro chemical major despite they diversifying into telecom and retail.
Reliance is too many businesses within a company and its difficult to play it as a simple OMC theme. When we have clear cut other options why try to complicate choices? The more simple we keep our style, the better it works.
Update on Usha Martin. As per the possibility mentioned in the post above, the stock price broke out from the 8-9 months long triangular consolidation and in the process posted a new all time high above 170 with huge volumes.
Symmetrical triangle or contracting triangle is a pattern where there is price compression for as long as the prices stay within a triangle and once breakout happen, price expansion is expected. We now have a stock that has broken out of a triangle with volume expansion and at all time highs. As with most stocks crossing all time highs, upside targets cannot be restricted to any levels. One can attempt to use fibonacci extensions, or some patterns providing targets to arrive at possible target. Otherwise its a blue sky scenario. Elliot Wave guys sometimes provide targets based on ratios of various waves. But irrespective of all these possibilities, idea should be to ride with appropriate stop losses. If any parabolic move happens, one can think about profit booking partially or fully. As of now, idea should be to ride with an open mind. (disc: invested as disclosed before. )
Worth noting is the fact that a brief attempt at a breakout from smaller triangle plotted within the bigger triangular pattern was made and stock price corrected along with overall market carnage, and retested breakout levels. Friday provided the first hint of bullishness when inspite of weak market sentiments, the stock price closed strong.