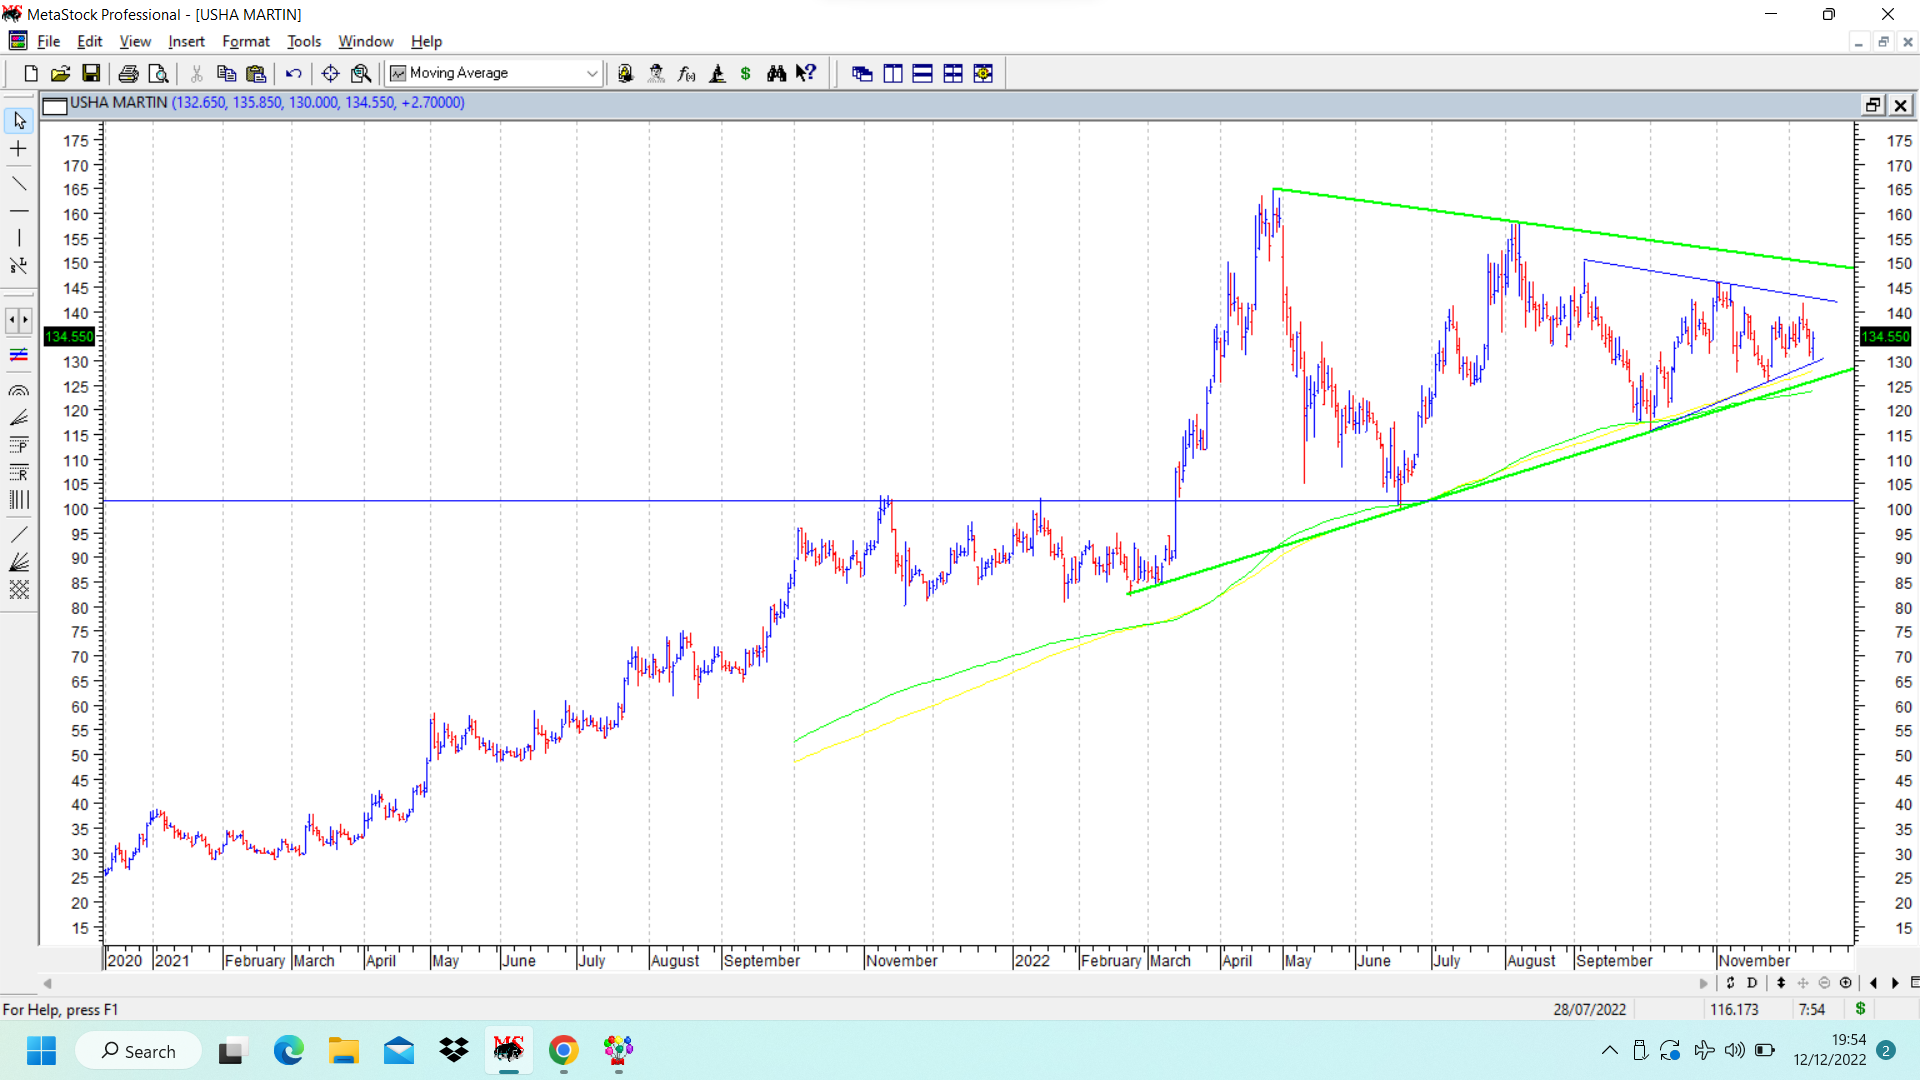
Usha Martin chart continues to show the symmetrical triangle and breakout is still awaited. Contracting triangles indicate a contracting nature of prices and volatility and this pattern has been forming now for over 9 months, since March 2022, ever since the stock price broke out of a strong 12 year high of 100. After this breakout stock price hit a high of 165 and has gone into consolidation. It has also tested the 200 dema twice in the past few weeks, once in June 2022 at 99 and then in Oct 2022 at 120.
Fundamentally speaking, with the sale of the commodity steel business, it has now become a steel converter business, which is relatively insulated from volatile steel prices. Debt burden has also come down drastically. All in all, it seems quality of the business seems to have improved. It can be an interesting “India manufacturing” story going ahead if its plans to attain global status as a supplier of its products fructify.
Within the larger contracting triangle marked in green, a smaller contracting triangle is now forming (marked in blue lines) whose breakout is above 143-145. If it breaks out above the latter levels, it could be the first sign of strength and finally we have to look out for major breakout above 150. Triangles are tricky structures and require a lot of patience as an investor/medium to long term trader.
disc: continue to remain invested, with a bullish view.