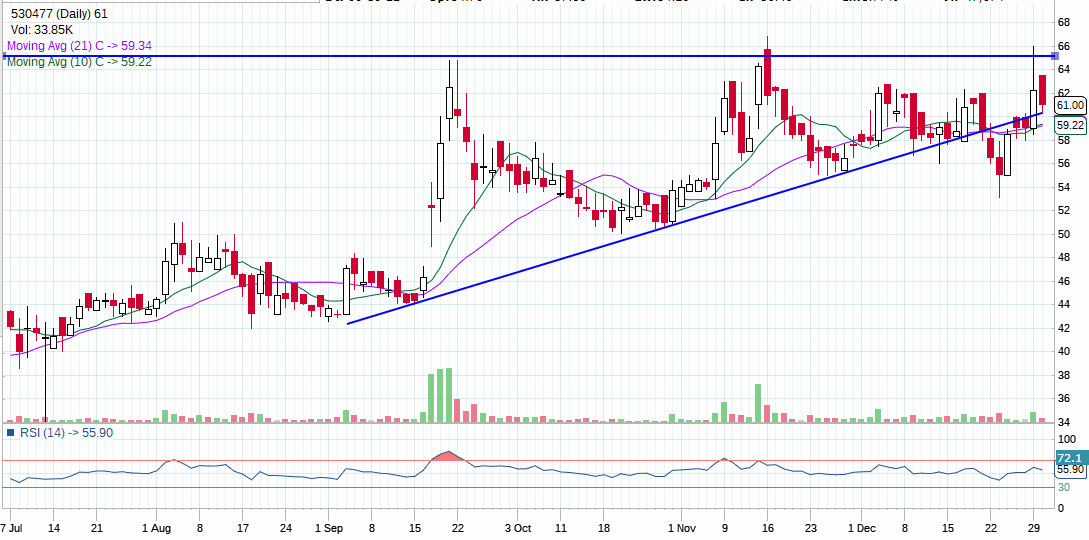
Vikram Thermo may break out from an ascending triangle above 66. It is hovering above the 60 mark in the past few sessions.
In the carnage that took place in the start of the last ten days of december it just went down till 53 from 58 levels and bounced back to the same level again. It is consolidating in the ascending triangle for 9 months. Any breakout above 66 should take the stock swiftly to 90 as it has been a long consolidation.
There is a good thread to understand the business on the company. To give you a gist it is an import substitution play in the perfumery and the pharma business. It is a manufacturer of diphenyl Oxide (DPO) and Drugcoat for pharma companies. It claims to have 80 percent market share in the pharma industry for its products.
It did take a significant capex in the year 2022 whose results are now visible in the of the past two quarters. It seems to be a good business with 25%+ OPM for the past two quarters with volumes kicking in.
The chart indicates in the past few sessions price does not want to go down. If the level of 58 sustains and a breakout happens it should be a swift move.
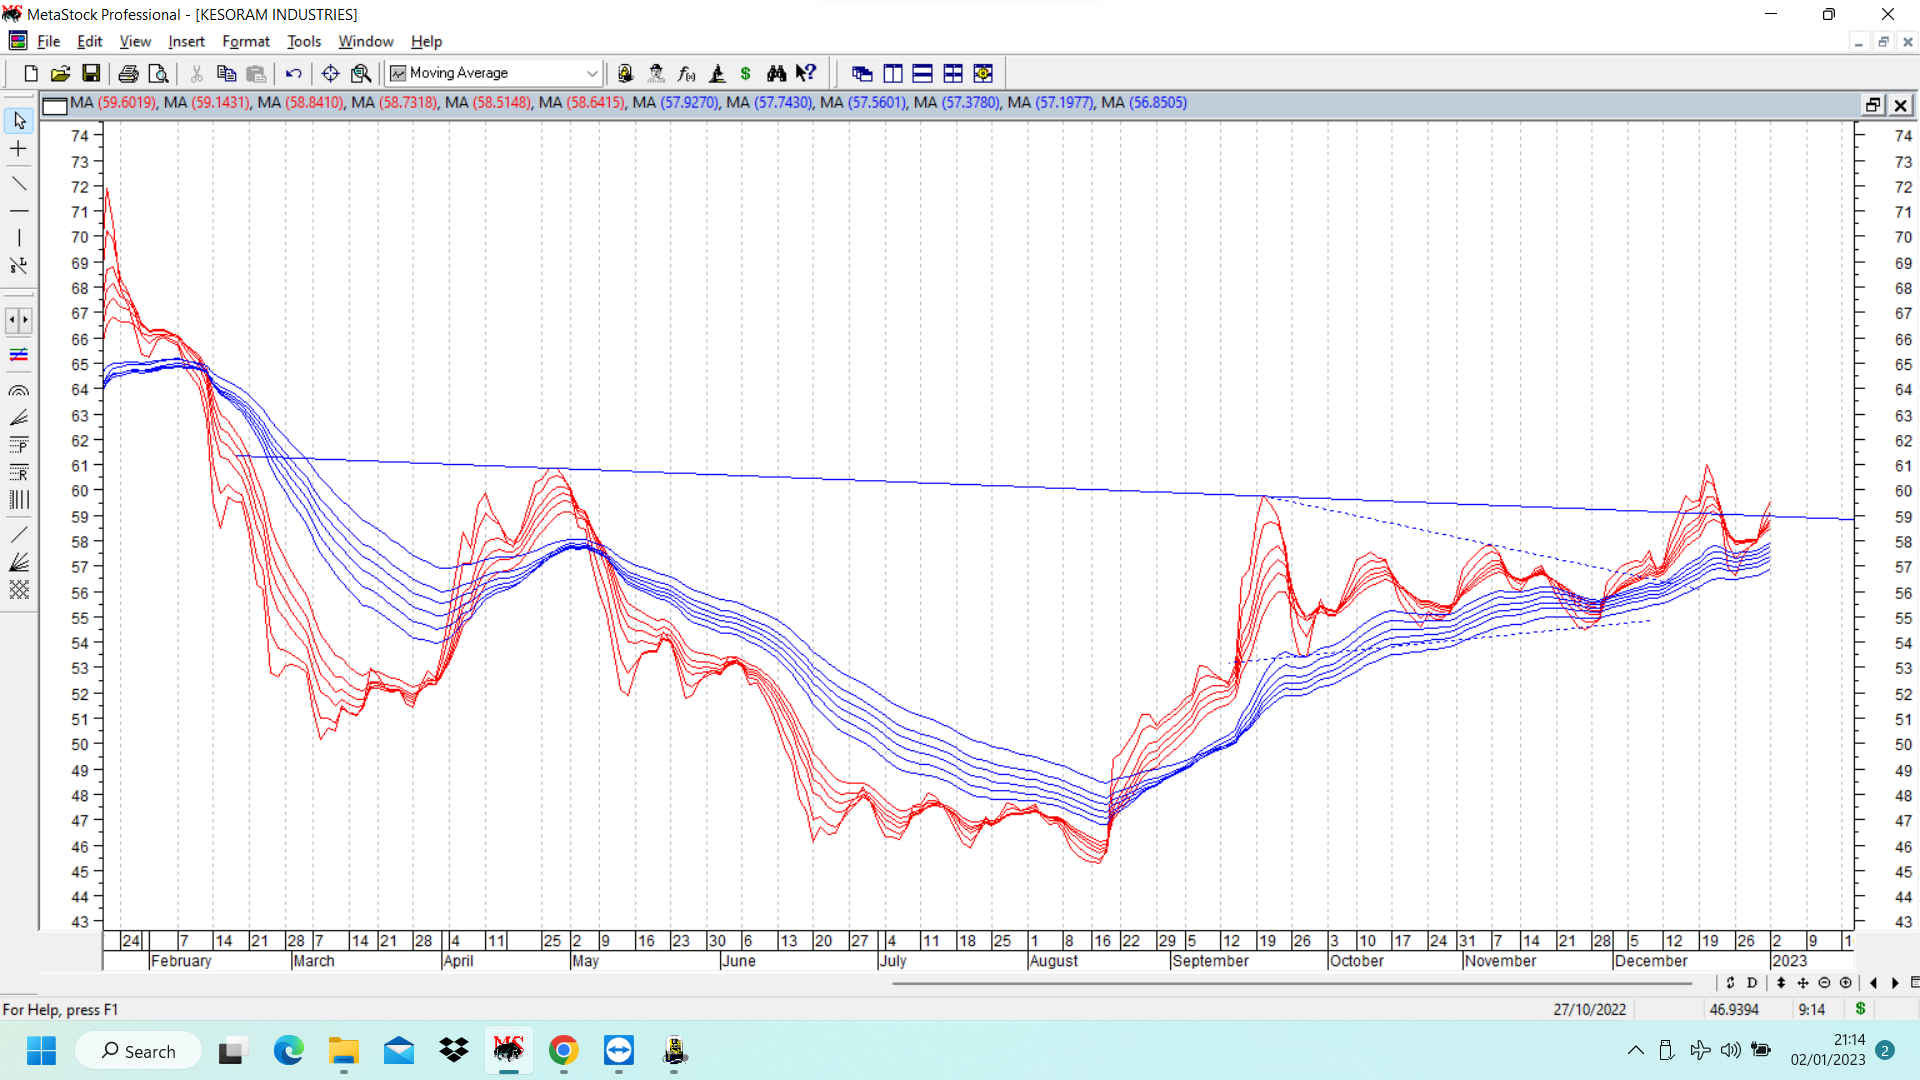
Kesoram Industries has been a rank laggard as compared to the markets. On the fundamentals front, the company demerged its tyre business into Birla tyres. Now main business comes from cement and small part of business from rayon etc.
On daily GMMA charts, a breakout from inverted head and shoulders pattern is visible. More interesting is the small symmetrical triangle within right shoulder, marked in dotted blue lines… There was a breakout from this triangle few days back, then a retest during the recent 2-3 days fall and then a rebound above the neckline of inverted head and shoulders marked in solid blue lines.
Inverted head and shoulders pattern if successful can provide targets of 75. cmp 60. The current market is one where a lot of laggards are trying to make a comeback or have already made comebacks… More of a mean reversion happening. Taking a punt on this theory, I took a small position in Kesoram. Rumours keep floating around of stake sale by promoters to potential suitors, but nothing till now has come out of these rumours. Company is mentioning about debt reduction and more focus on profitability
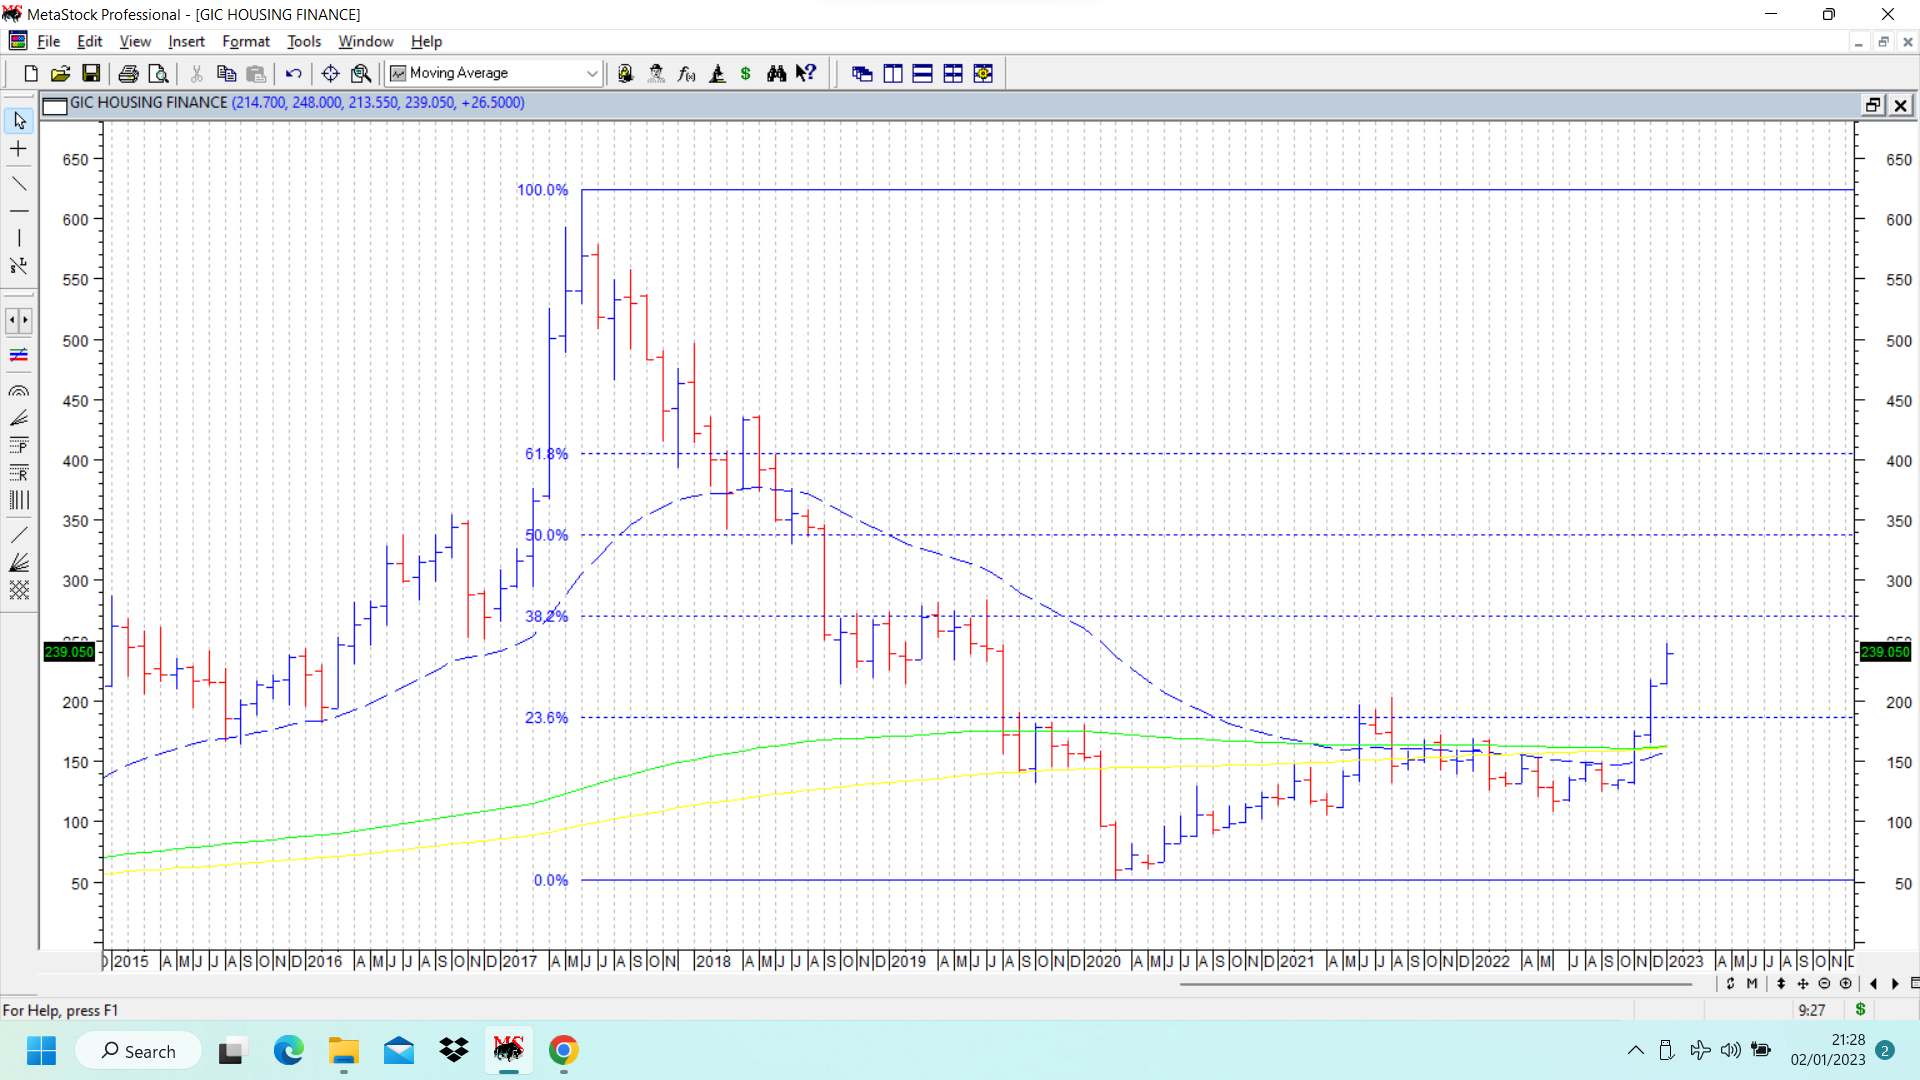
GIC housing update. The stock today gave a strong move and closed closer to 240. Now if we put a Fibonacci retracement on its monthly chart to look out for potential targets/resistances, two key levels to watch out going ahead are 38.2% retracement at 270 and 50% retracement at 337 . Above that is 405 which is 61.8% retracement.
On charts, near term resistance is visible at levels of 270-280, where previous major resistance was faced. Fundamentally book value is at 294. TTM EPS is 41.
I would be on the look out for any signs of exhaustion of rally nearer to retracement levels of 270-280, and if it goes higher around higher retracement levels as mentioned earlier.
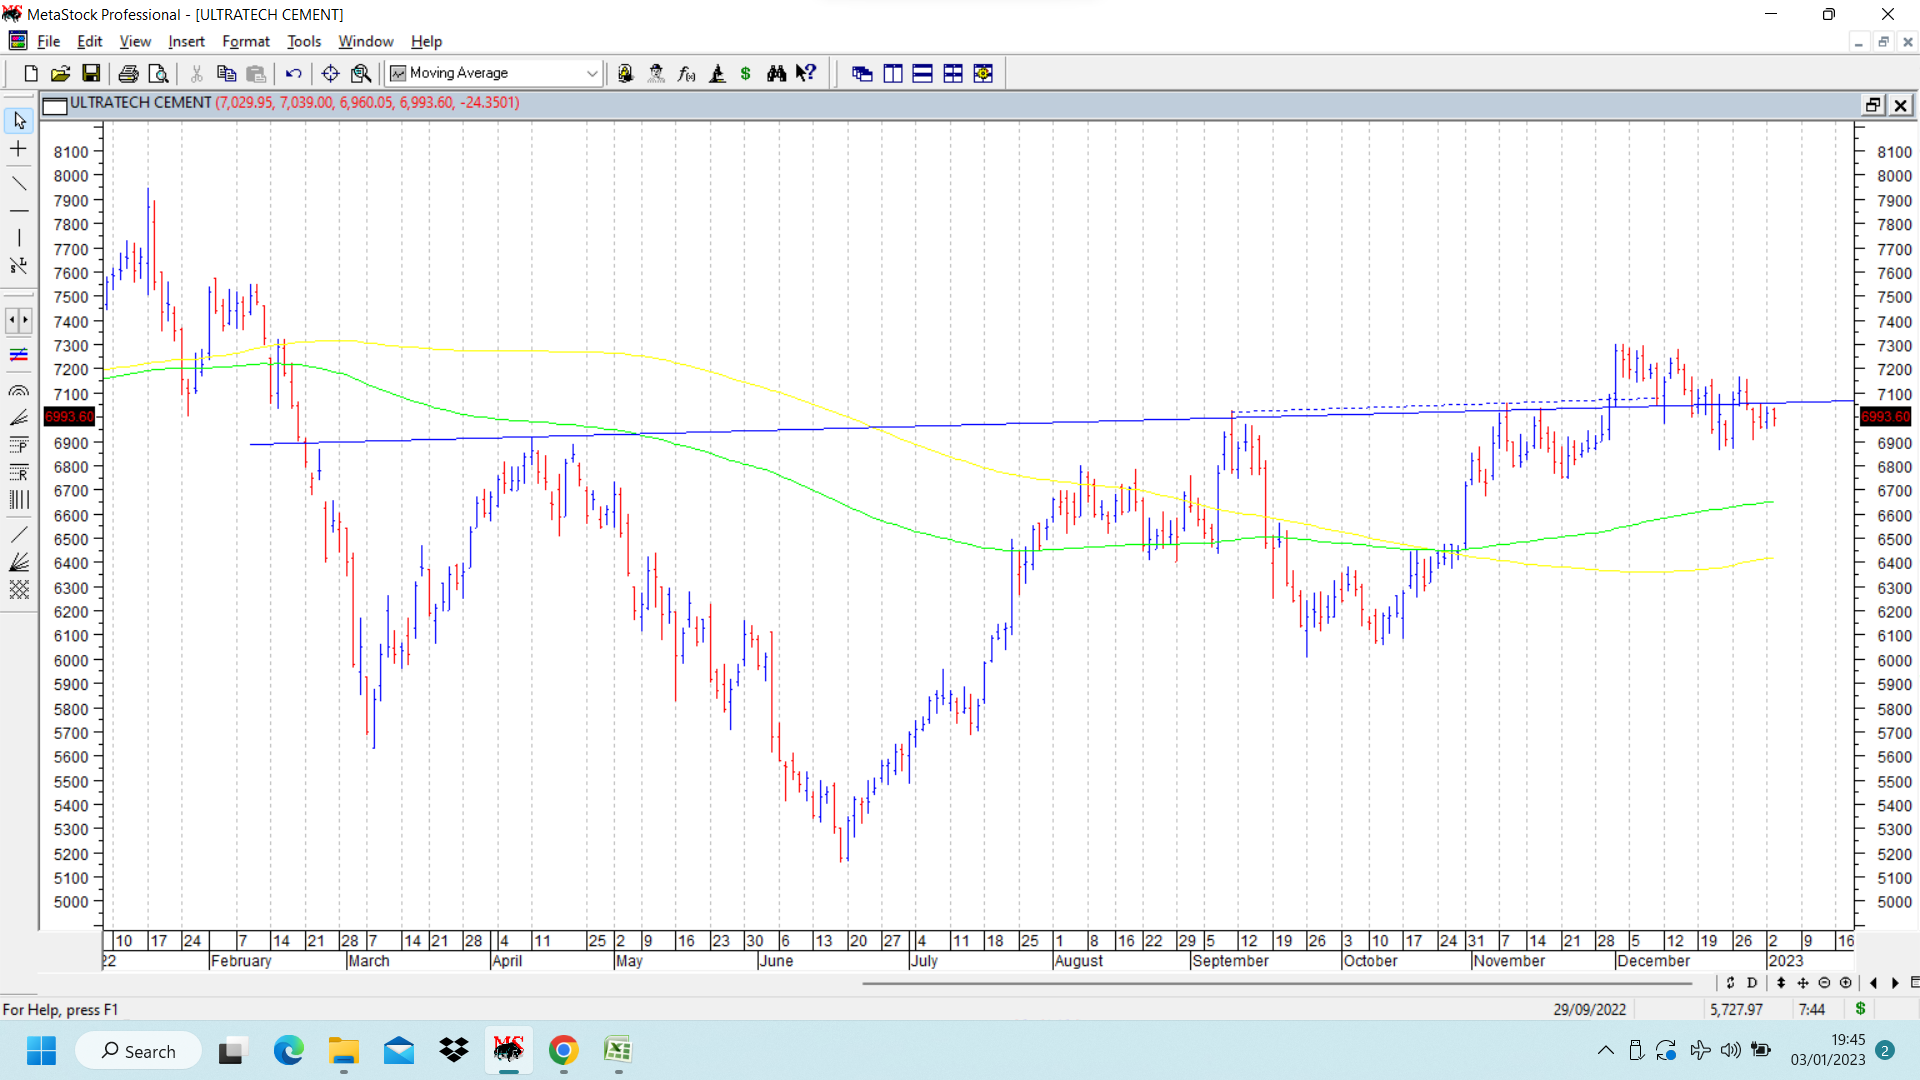
Ultratech Cement cmp 7000. Medium term charts show an inverted head and shoulders breakout and retest of neckline currently going on.
Interesting to observe that the right shoulder has a small cup and handle pattern (marked in dotted blue line) within it, sort of pattern within pattern.
If the pattern plays out, targets can be in range of 8000-8400. Posted only for academic interest No positions.
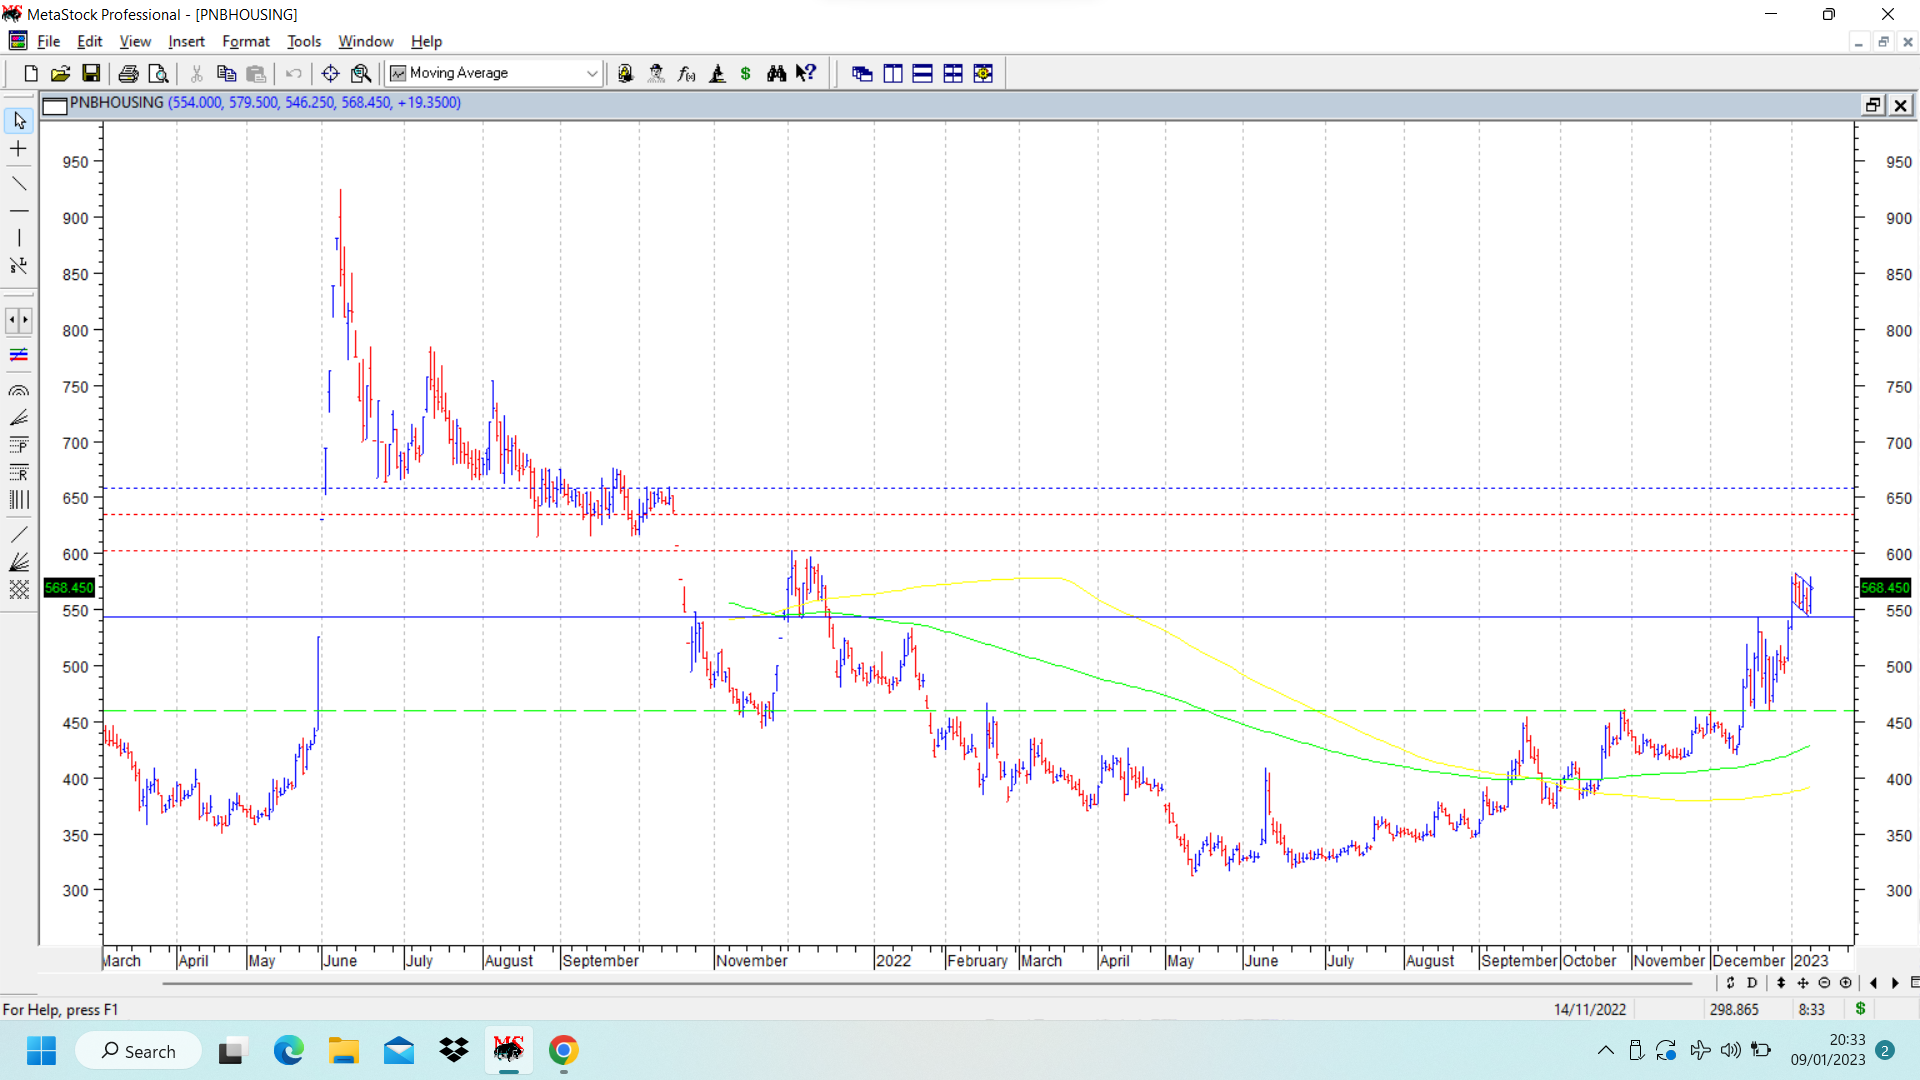
I had earlier posted a chart of GIC housing. Putting up chart of PNB Housing finance. cmp 568. This is a very interesting chart to learn how to spot and benefit from recognising early stage of a rounding bottom formation. In the past this kind of chart has been seen in Pricol, Usha Martin etc.
In case of PNB Housing, in the daily chart attached, the fall began from a swing high of 925, and stock price went down to a low of 315. The last part of the fall from 460 to 315, marked below dotted green lines was left half of the rounding bottom. We do not want to catch stock at absolute bottom.
But once the stock bottomed out and started moving up in a gradual rounding pattern, it crossed important pivots joined by green dotted lines which were intermediate peaks at 460. The rounding bottom formation early phase was visible to the practiced eye. Another important aspect of this kind of formation is that stock price tends to go above 200 dema and and slope of 200 dema also starts moving up. ( one can use 30 week moving average on weekly chart and get near same picture) The whole chart is punctuated by higher tops and higher bottoms in a rounding formation. The stock price starts crossing 1 year high, 2 year high and so on. Usually the target to aim for is the beginning of the rounding bottom formation, which in this case is 925. (looks far fetched as of now, but can happen as seen from previous examples of stocks like pricol) Many a times pattern fails and we have to cut our losses, or book premature profits and move out. (this is usually something that guys following technical analysis have to learn and respect. there is no place for ego.)
In recent past, stock price hit a swing high of 533 which was 52 weeks high at that time and immediately cooled off to retest the pivot zone of 460 and took support in form of consolidation above it. On 2 Jan 2023, it went above the swing high and posted another swing high of 583 and seems to be forming a flag like consolidation. If breakout from flag happens and pattern targets are achieved, it can reach 658 marked in dotted blue lines. The region marked in dotted red lines between 602-634 is a potential resistance on the way up as it is an unfilled falling gap. Such a large gap needs a huge upmove with big volumes to overcome strong resistance. If and when happens is anybody’s guess.
Two important things here is discount to book value, and similar strength seen in comparable peers like Gic housing finance and to a lesser extent in repco home finance. disc: invested in both pnb hf and gic hf as techno funda bets with strict stop losses.
The main aim of sharing this chart is to try and learn to pick up early stage rounding bottom formations to get entry points where risk reward equation is extremely favourable. There will be plenty of examples for someone who wants to look at scores of charts. We are looking at a live example here and would like to follow through on how things pan out.
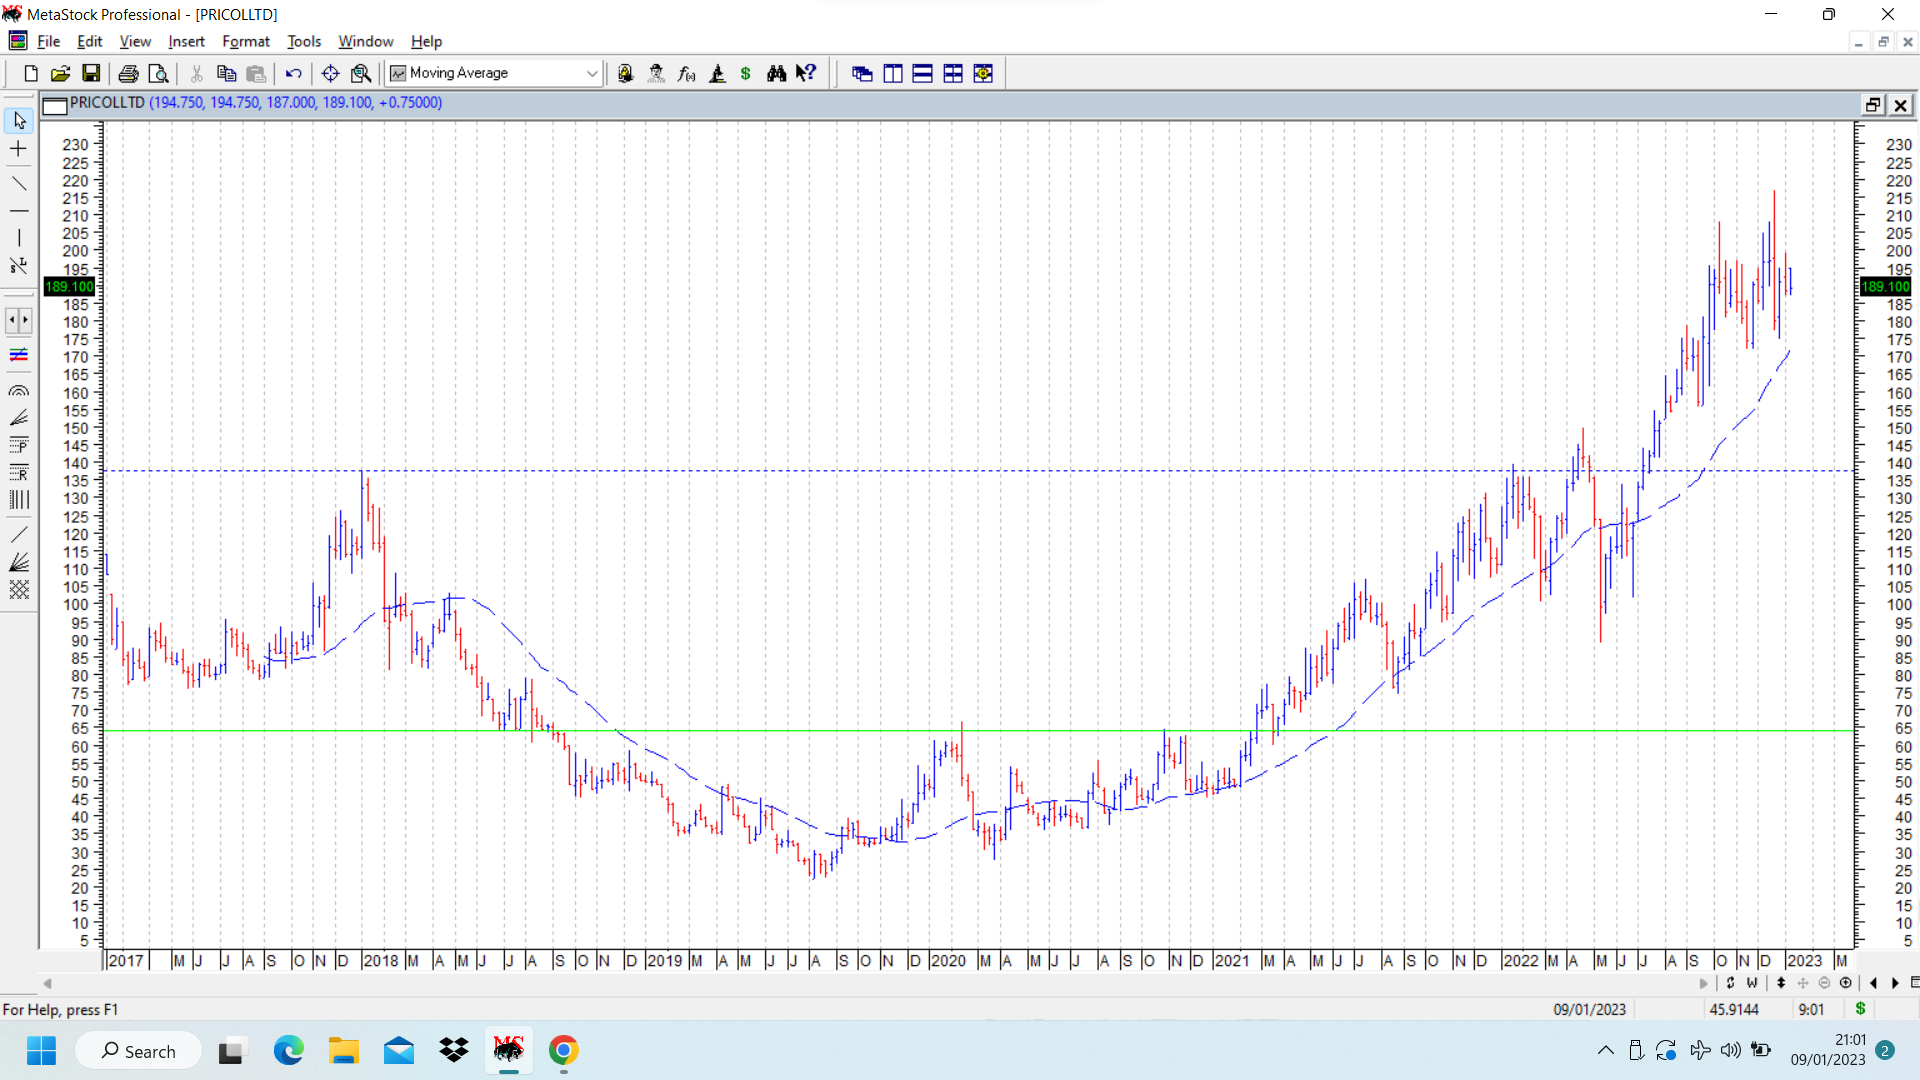
Just for the sake of quick reference, posting chart of Pricol which I mentioned in previous post. The important pivot marked in green line is 64, below which early stage rounding bottom is visible. Also visible is 30 WEMA in dotted blue line, which turns up strongly once stock price breaks out above 64. And subsequent crossing of previous all time highs of 137 and then stock price going on to hit a new all time high of 216 before cooling off to current levels of around 189.
HCC: This looks like Rounding bottom formation. Any expert opinion?
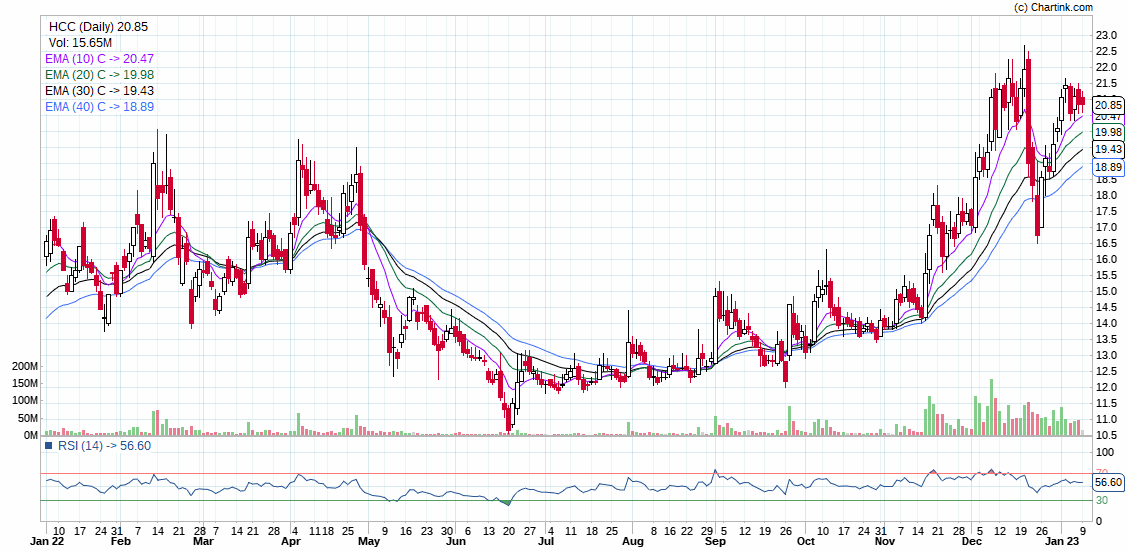
It recently crossed 3 year High also, though moving around the same levels with high volatility.
Regards,
Nikhil
Disc: Invested
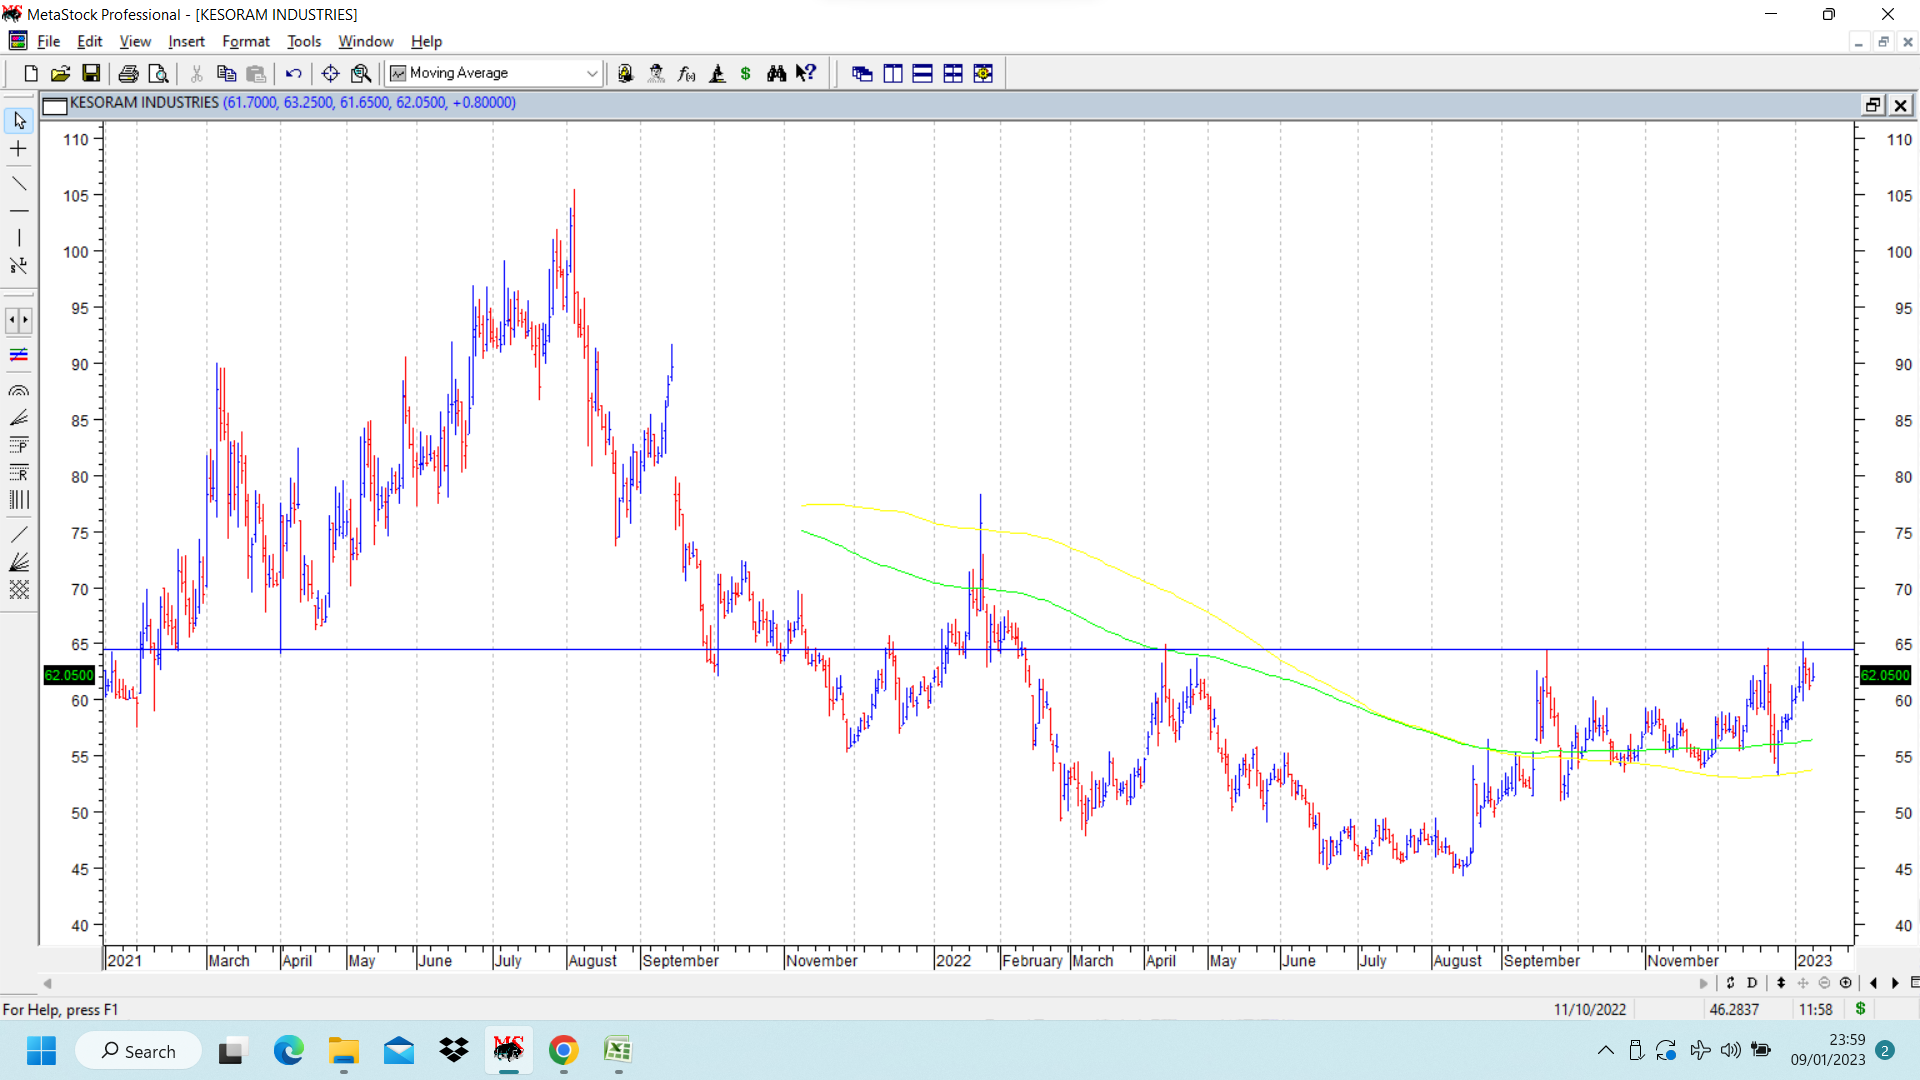
I had put up the guppy multiple moving avg chart of kesoram where an inverted head and shoulders breakout happened. On looking at bar chart, we can see an example of early stage rouding bottoms similar to the one I posted earlier in charts of pricol and pnb hf. Here, 64.50 is the crucial pivot and current price is around 62. The stock price is above the 200 dema and the 200 dema is flattened and just about moving up. The high of the rounding bottom, from where the whole fall began is 105.50. disc: invested as mentioned before.
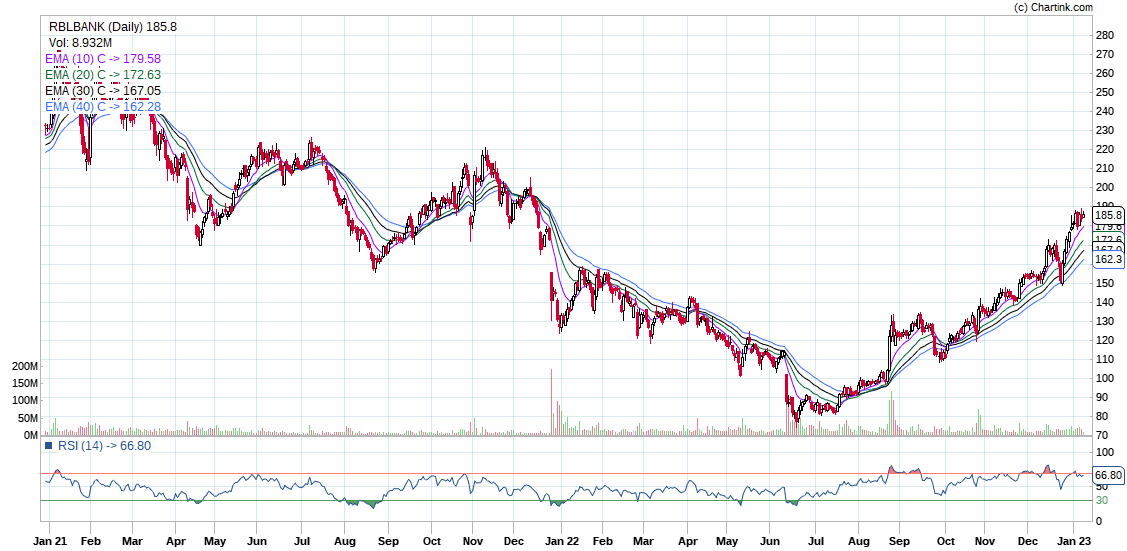
RBL Bank: This seems to be another one which has broken past 155-160 and forming the rounding bottom on a 2 year basis
Regards,
Nikhil
Disc: Invested - Small Position
Sir - have a beginner question. What is the time horizon to be considered for rounding bottom formation? In whatever little i learnt, I was told it is usually 4-5 plus years time frame on charts.
Rounding bottom formations will be visible across all time frames, Daily, weekly, monthly any time frame. Even intraday on minutes or hourly charts… But since we are investors and want to invest on short to medium term time frames, we should look at daily and weekly charts…
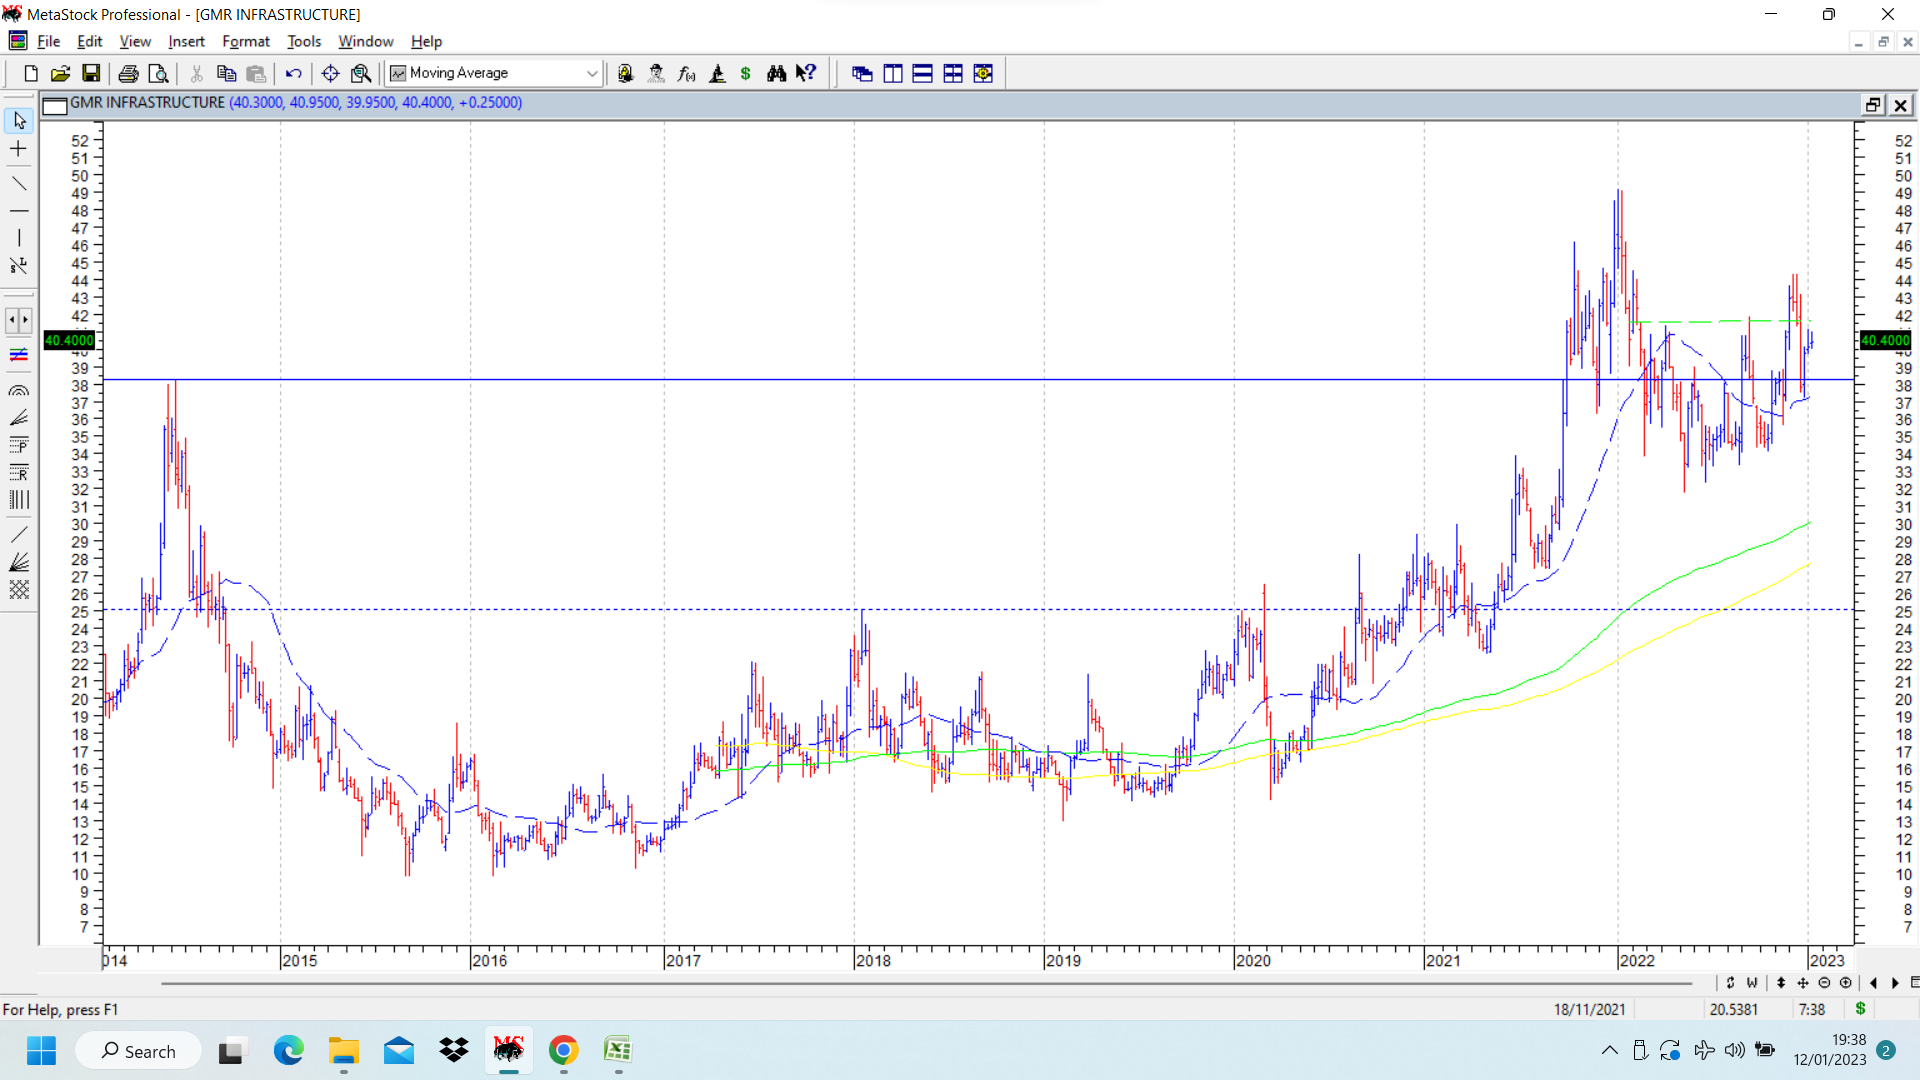
GMR Infra stock price broke out above 8 year high of 38 in Oct 2021 and went on to hit a swing high of 49, before correcting with the overall markets. It went down and hit a swing bottom of 32, before resuming uptrend.
Some interesting observations:
Early stage rounding bottom was visible at price of 25 when it crossed important pivot resistances marked in dotted blue horizontal line. The wavy dotted blue line represents the 30 WEMA which is used for purpose of stage investing had turned up then. The whole rise from levels of 12 to 38 was in form of a rounding bottom.
Subsequently stock price went up to 49 and corrected to 32, nearly 30% correction from top. The 30 WEMA had turned down briefly but once the uptrend resumed, it also has started moving up and now is placed at 37.
The weekly chart on extreme right also shows a rounding formation below small dotted green line which is placed at 42 on bar chart and on line chart the resistance is at 40. Stock price has shown some resilience in the recent market correction.
disc: invested as a technical bet.
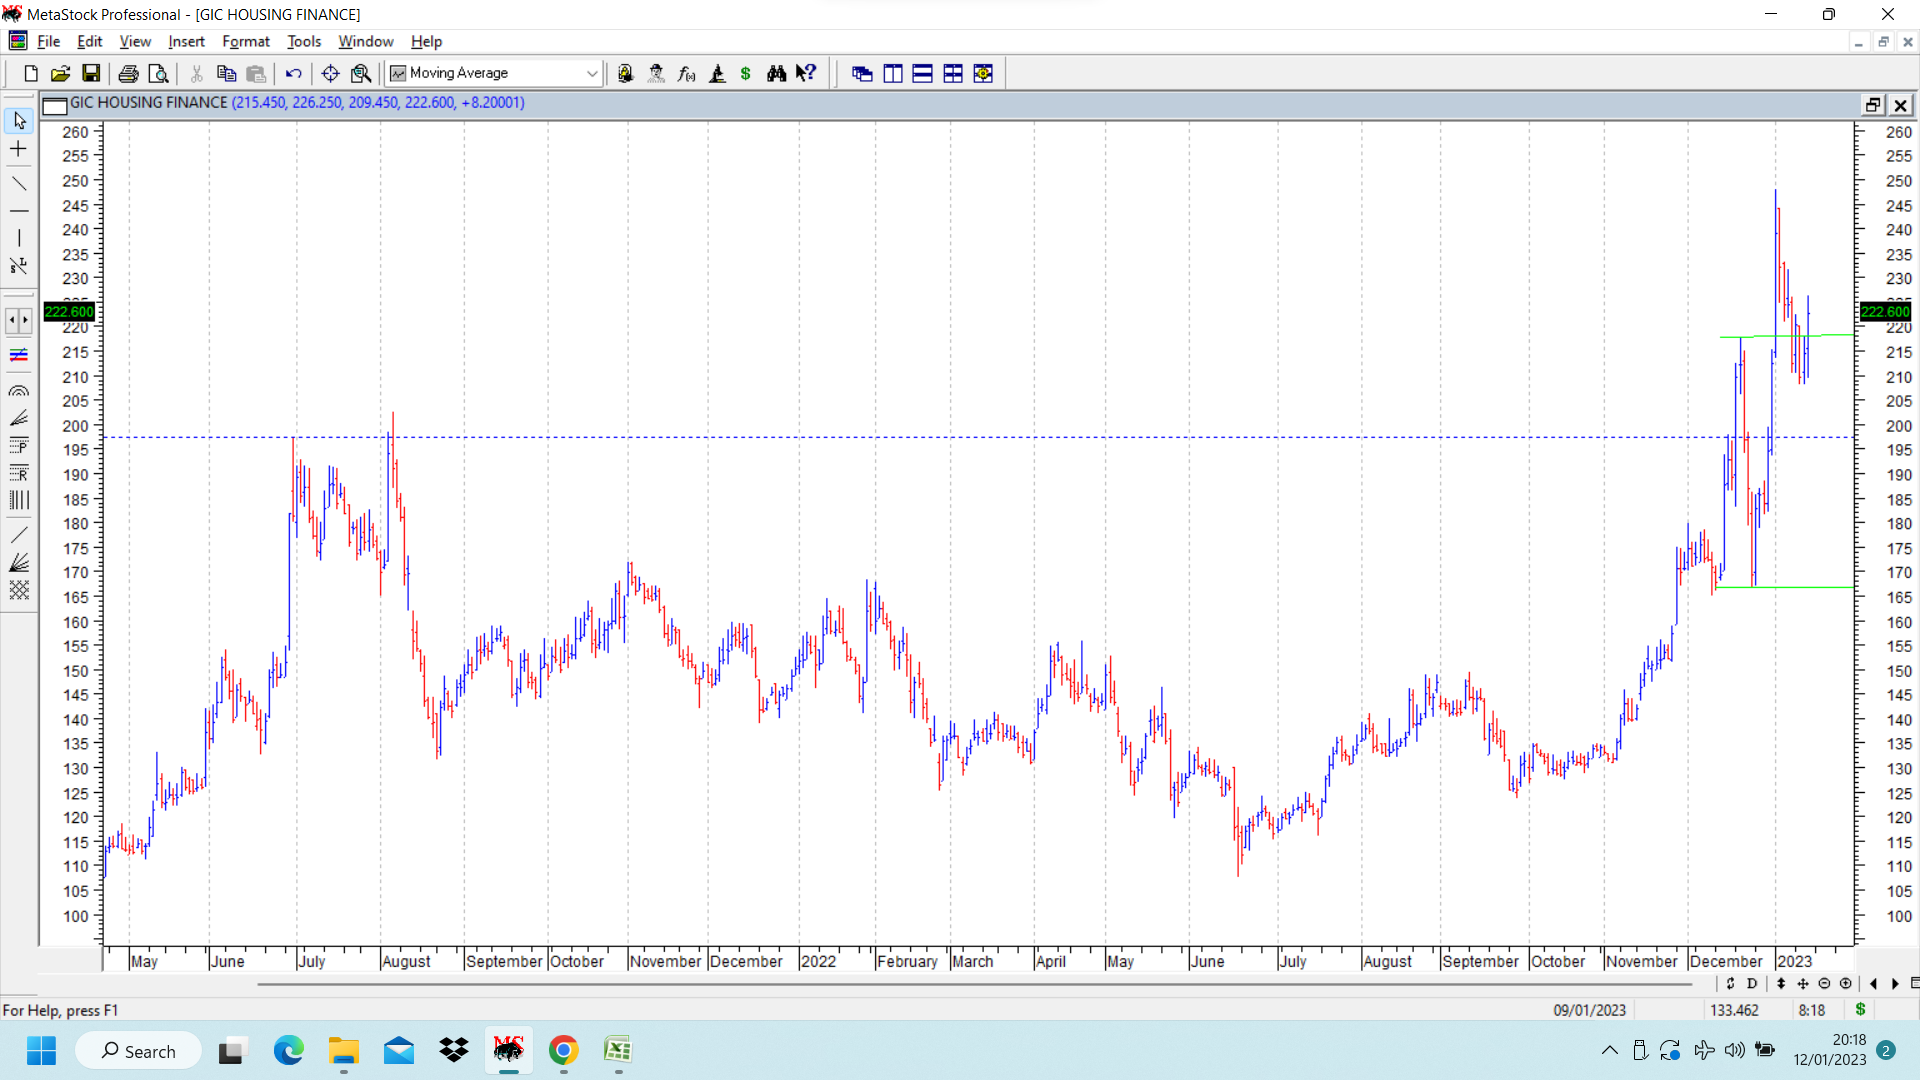
GIC Housing chart update. As shown in chart, stock price broke out above 52 weeks high above 202 as mentioned in a previous post. After that stock price hit a swing high of 217.80 and promptly corrected to 166. Here it formed a double bottom and stock price resumed uptrend to post another swing high of 248, before again correcting with overall markets and posted swing low at 208. This was a retest of breakout zone and as often happens, stock price tends to go slightly below exact levels. After a few days of range bound moves, stock price today again broke out above congestion zone and closed above 220. Target of double bottom pattern (enclosed in green horizontal parallel lines) could be close to 265-270. Housing finance companies like GIC hsg and PNB Hsg have been showing good relative strength in an overall weak market.
Not sure if you did this trade in GIC but if yes, how do you handle the swings after you take the trade? I mean, GIC had a 15% correction after the first breakout…wouldn’t you exit in that correction?
GIC hsg had a rally from around 170 to 210 and then a quick drawdown to 170 again… These are the kind of volatile moves we have to learn to bear in the current markets, where volatility is high. A lot of patterns do play out and targets are achieved, but in between there are a lot of unexpected volatile moves… So for someone like me, who had initial targets of 270 plus (as mentioned in initial post) sitting tight is the way to go.
If someone is nimble enough, then there can be a case for trading in and out with a small portion of holding to bring the buying costs down. Sometimes I do that, but not too frequently.
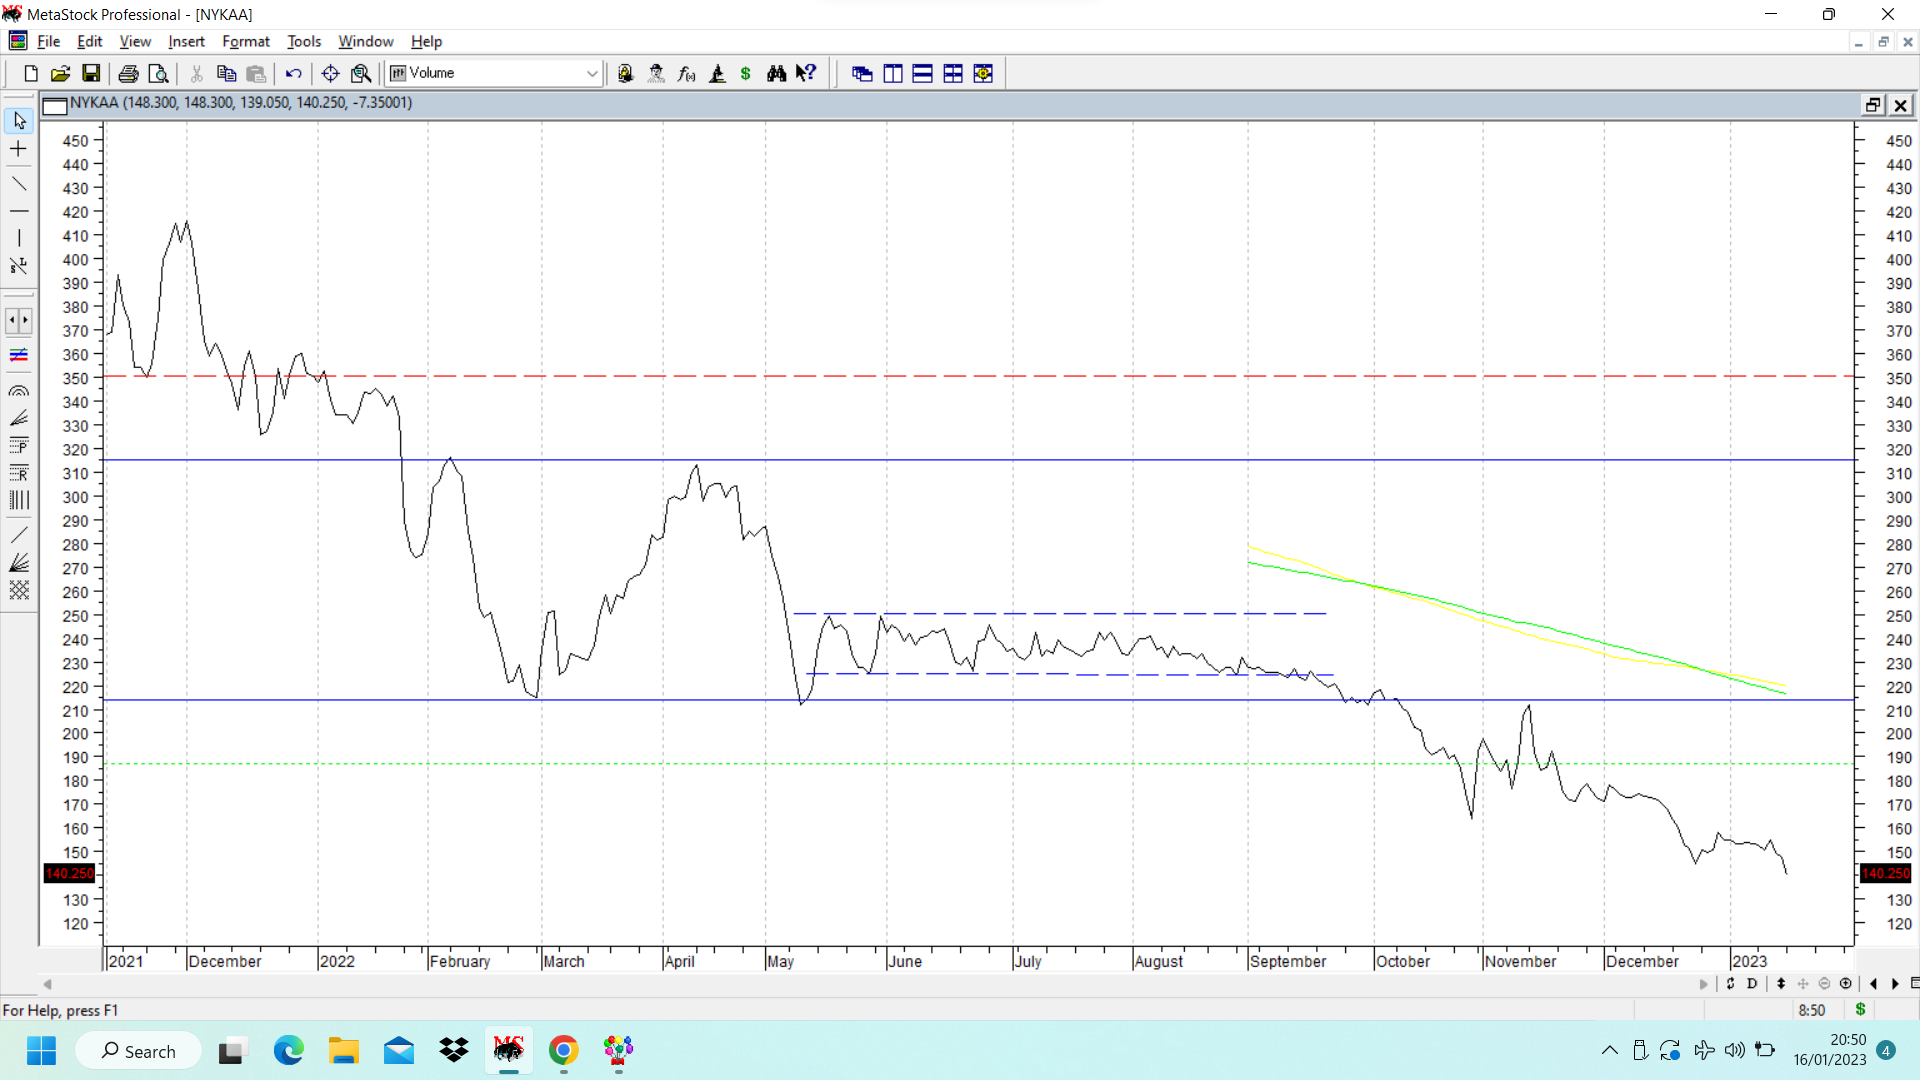
Nykaa IPO was priced at 1125 per share. (before it split from 1 to 6, and now adjusted price of IPO is 187. ) Post IPO it was bidded up to nearly 2500 (428 ajusted for split) and this fanfare lasted for only a few days (around 22 trading sessions) after which stock price broke its post IPO listing lows of 350 (marked in dotted red line) Since then the journey has been painful for those holding the shares.
The chart put below depicts typical story of a very fancied IPO carried to even fancier valuations by markets and gullible investors being trapped with silky stories. As mentioned above, post IPO, just within a few days, stock price broke below its post listing lows and started its downward journey.
One of the models one can use for stocks post listing is to watch out for post listing highs or lows being taken out. There are some examples of post IPO highs being taken out and stocks going on to become big winners before correcting. e.g Affle, Indiamart, are the immediate names that come to mind. Reverse logic can be applied to stocks breaking post listing lows.
After breaching 350, stock price formed a double top pattern at 315-320 and this pattern was confirmed on conclusive breach of 213. Double bottom pattern is marked in solid blue lines. Also note distribution for many trading sessions between two dotted blue lines. Price target for stock price following its double top confirmation would be around 110-115 depending upon which kind of chart we use. (bar chart or line chart etc). Current price is around 140 and there still does not seem to be any strengh in price.
IPO price of 187 is marked in dotted green lines.
One of the key lessons from this chart has been Peter Lynch’s lesson on “How low can this stock go” . It can go much lower than most people expect especially if numbers are not there to support the narrative Another one the famous learnings he imparted is full form of IPO… Its probably overpriced. It seems to be playing out here in Nykaa. (as also in a lot of other fancied IPOs that came in markets when markets and esp IPO markets were in party mode.
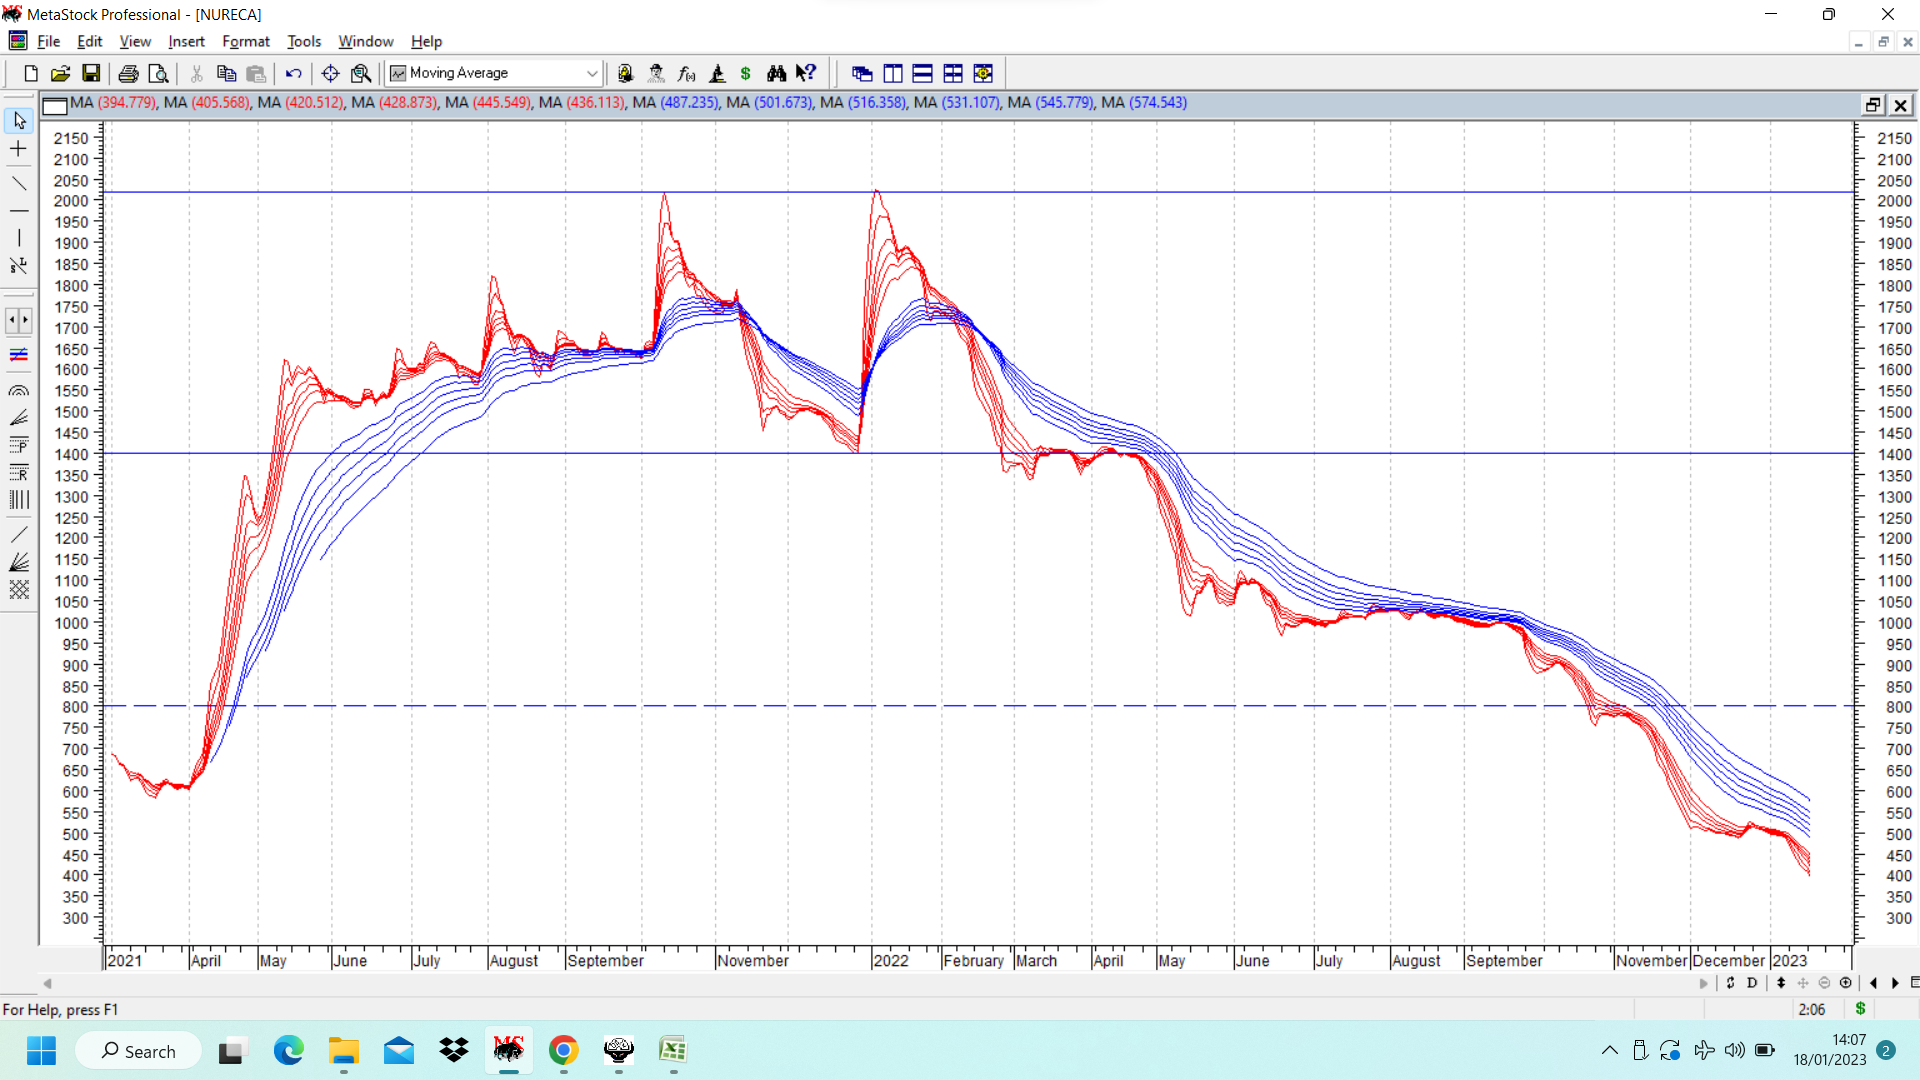
Nureca chart put up shows massive investor wealth destruction especially those who bought near the top of 2000 levels. On GMMA chart, a clear cut double top was visible at 2000 and pattern was confirmed once price broke below 1400. Target for pattern was 800. But seems stock price is falling into a bottomless pit with current levels well below 400.
Here too the post IPO story is typical. IPO Price was 400, but market craziness aided its rally to go up to 2000 levels before the cookie started crumbling. The Covid times helped this company with higher sales of commodity products like Pulse oxymeter, BP instruments etc… There are loads of companies making these kind of products and there is no moat in this line of business. One just needs to check on e commberce websites like amazon, flipkart etc to get an idea about the range of products available for this kind of products…
Key learning is to avoid getting sucked into hot IPOs post listing especially during IPO frenzied markets… This is one pattern that keeps on repeating every few years.