PATTERN FAILURES AND ITS RAMIFICATIONS.
Whenever a very clearly visible pattern occurs and gets confirmed and then it does not play out as expected, but instead stock price starts doing opposite to what is expected post pattern confirmation, we label that situation as pattern failure. Usually when a pattern failure happens, the move in opposite direction is quite strong and worth tracking (and riding if one is confident)
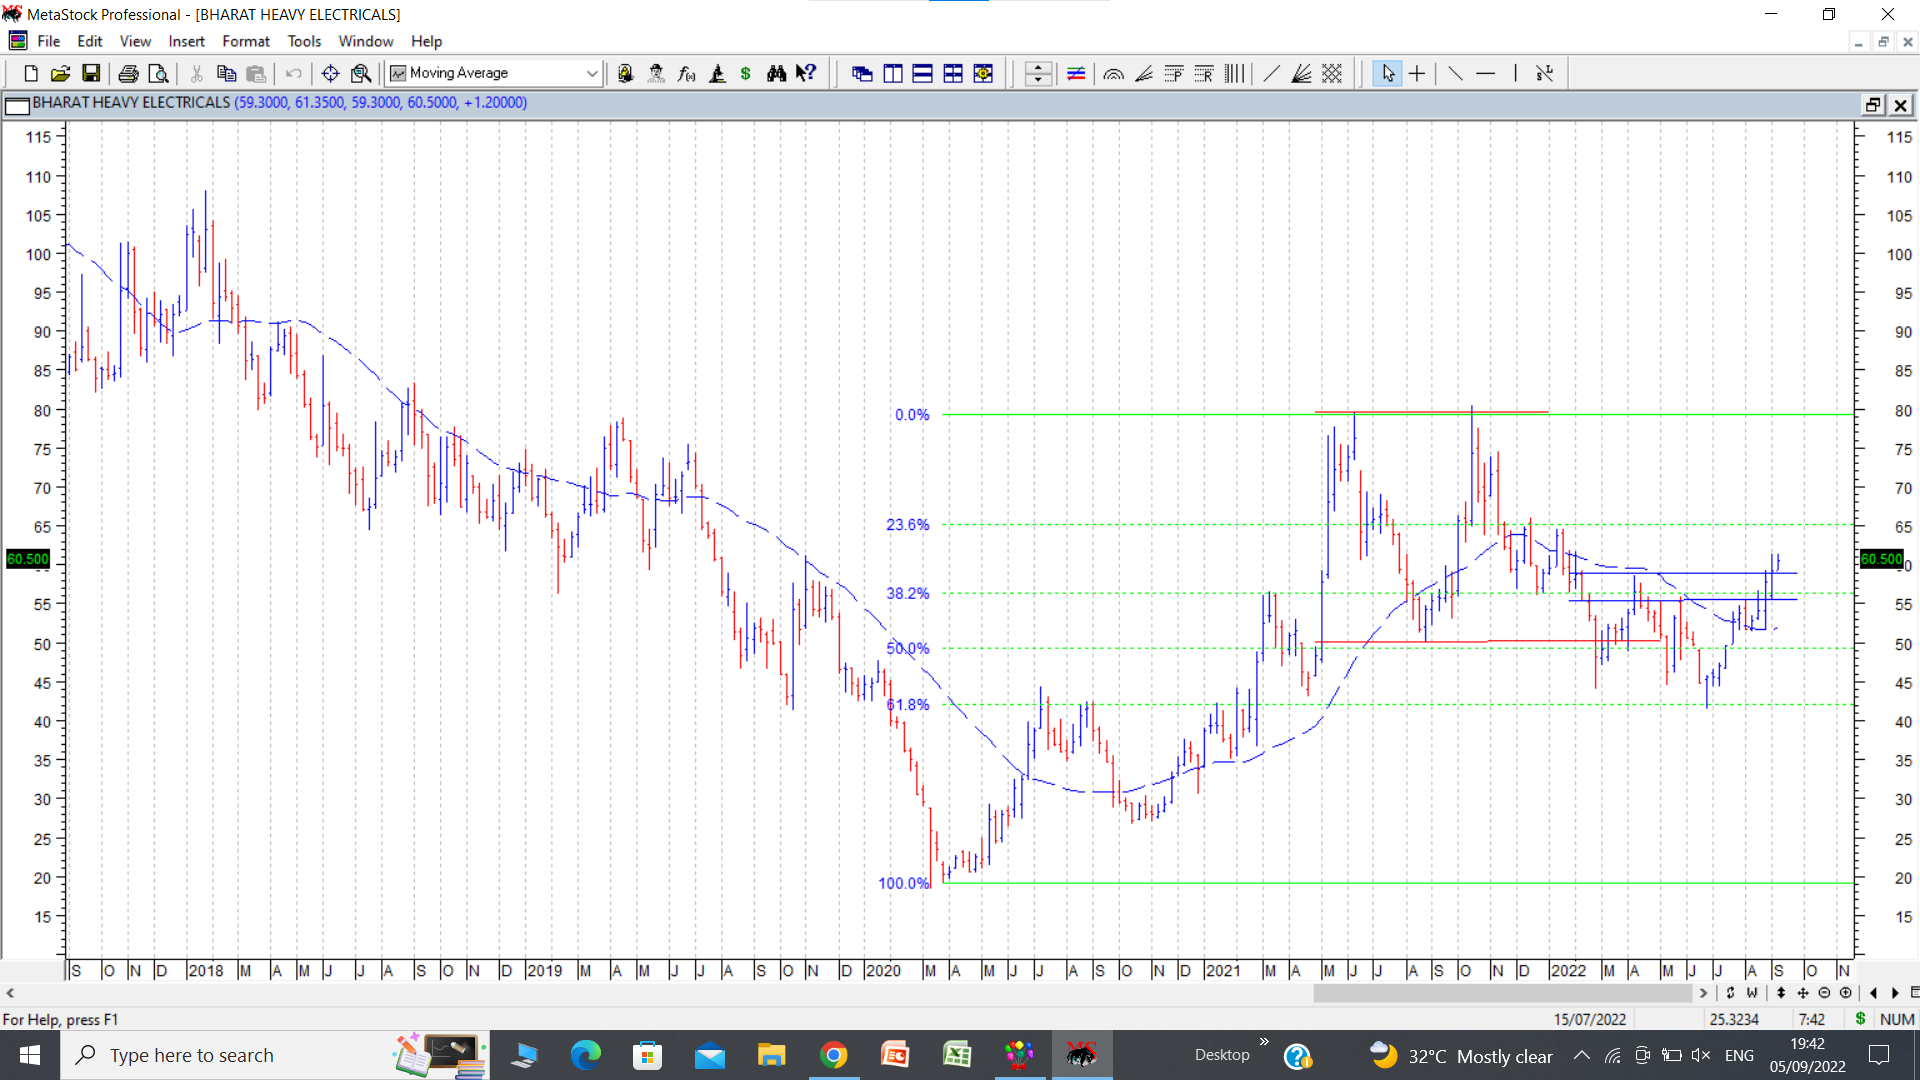
e.g In the example I have put up of BHEL weekly chart, stock price went up from Covid lows of 29 in March 2020 to high of 80 in June 2021. Then it went down to post a swing low of 50 in August 2021. Again it went up to post another high exactly at 80 (rounded off both tops for ease of visualisation) in October 2021. And started falling from there to break below the previous intervening low of 50 in Feb 2022. Now technically this double bottom breakdown (both tops and intervening bottom marked in solid red lines) should have led to targets of 20 in the stock price. ( double top at 80, intervening bottom at 50, so distance is 30 rs. If you subtract that from breakdown level of 50, we get target of 20) Instead, stock price bottoms at 41.40 and forms a weekly doji with a long tail with a bottom exactly at 61.8% retracement level to entire previous rally from 29 to 80. And reverses. Now it has crossed two important pivots marked in blue horizontal lines at 55-56 and 58-59 and is trying to consolidate above that level and is above the 30 week moving average in dotted blue line and the 30 WMA has started to turn up and is currently at 52.
Sectorally the cap goods/electrical equipment segment has been on a strong run and a lot of stocks from the sector like ABB, Siemens, Cummins etc have run up and posted very strong rallies. BHEL is a relative laggard. In sectoral bull moves, the laggards often move late on in the sectoral run, but often run the hardest and often end up giving spectacular returns.
Example of what I mean by run ups in sectoral bull runs… In sugar rally, Balrampur Chini was sector leader and went up above its all time high of 200 in March 2021. At that time Renuka Sugar was at around 9-10 Rs. Since then Balrampur chini posted a high of 525 and is currently at 362. Whereas Renuka posted a high of 63 and currently at 48. The laggard has shown better returns as compared to the leader. So I am often a fan of combining few stocks both leaders and laggards to ride a sectoral rally.
disc: I have a starter position in BHEL more as a technical bet based on above observations with low allocations. Trying to test the above hypothesis of pattern failure, and sectoral rally, all bunched up together. (this is not an investment advice, but shared as an example to illustrate a theory not practiced frequently, about pattern failure and its ramifications)