
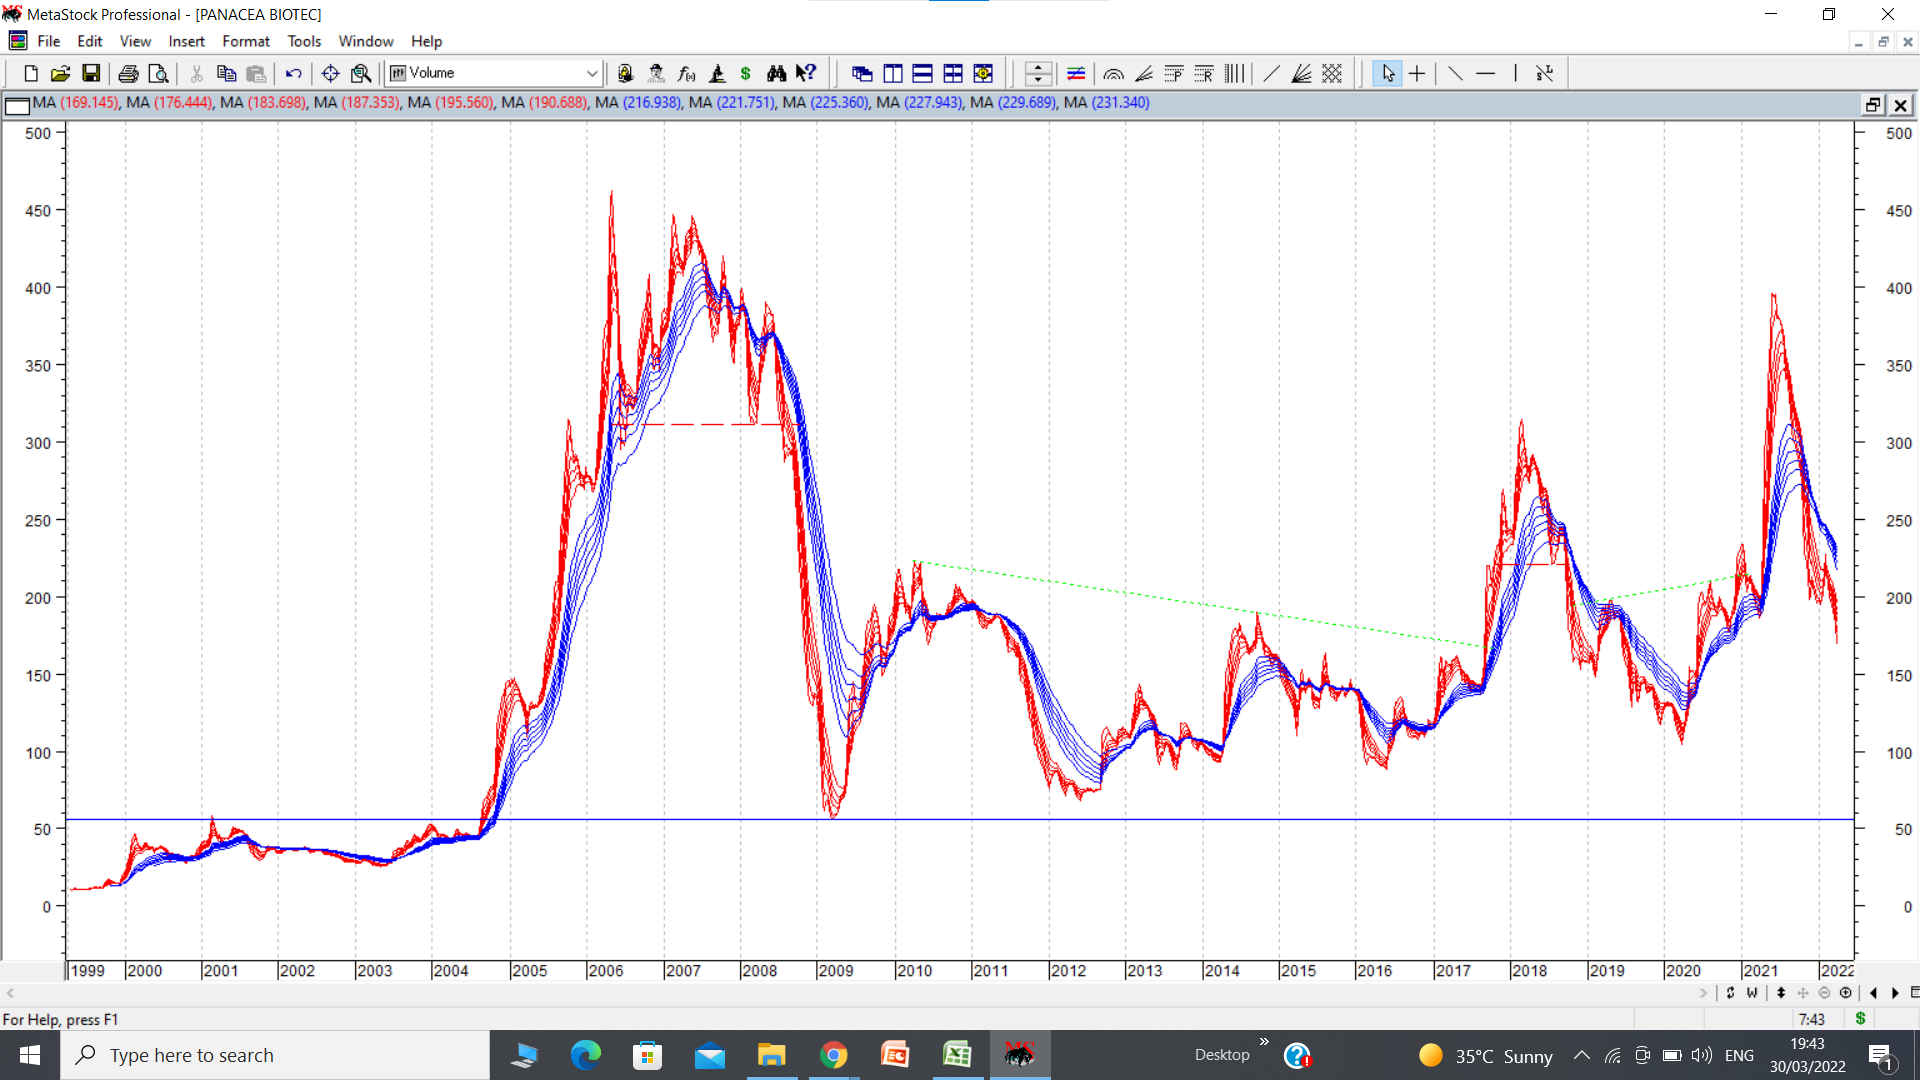
Another example of mountain chart is of panacea biotec. The exit signals are marked by dotted red lines and entry signals are marked by dotted green trendlines. Panacea seems to be prone to many mountains in its charts.
6 Likes
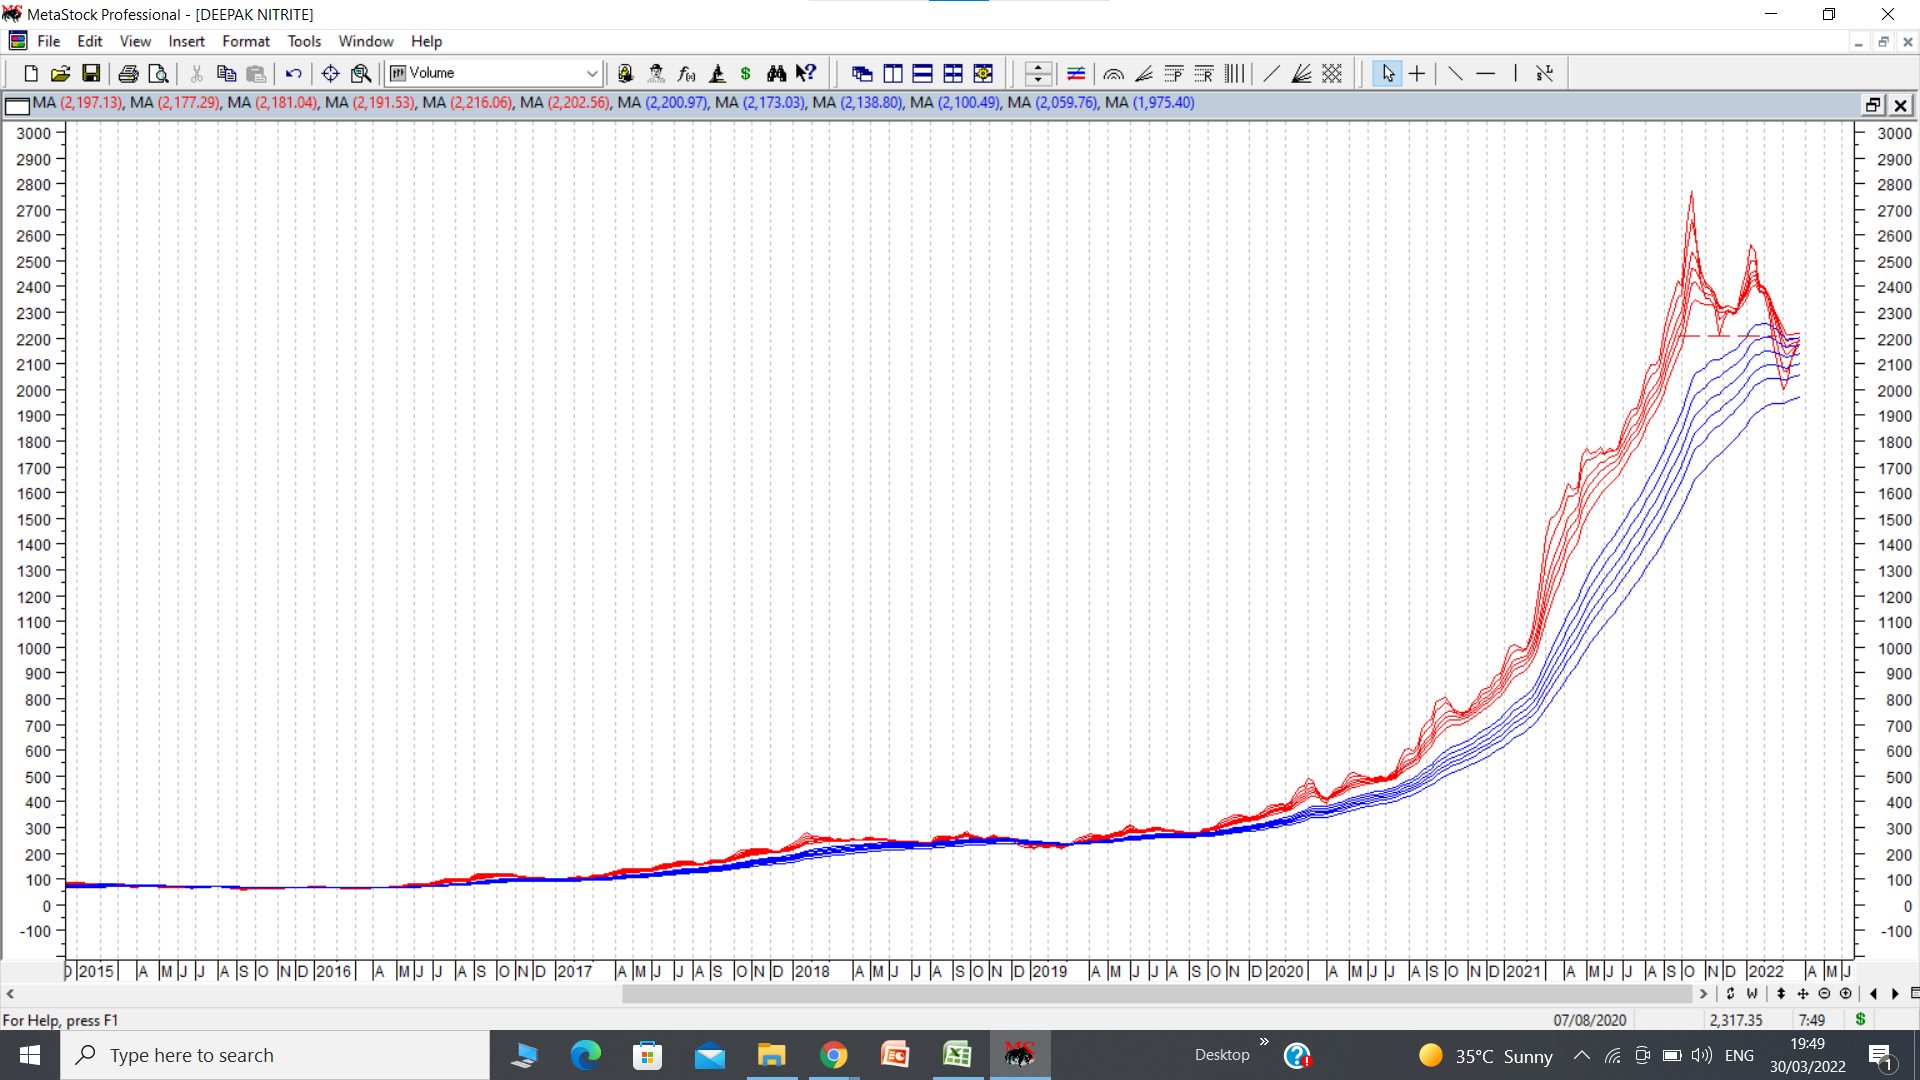
Deepak nitrite stock price went up nearly 10 times within 19 months beginning March 2020. The rise of the stock price is reminiscent of a mountain. However fundamentally it seems to be a very good company and with all the capexes lined up, there could be good times ahead. However here too an exit signal was generated on weekly GMMA chart as marked in dotted red line at 2250. Stock price seems to be hovering around about the same levels. I would watch this company and the stock price chart to see how it plays out. As of now it seems to be showing some signs of stabilising above its 200 dema at around 2120. But for someone like me, who wants to play techno funda breakouts, there are better stocks and sectors out there rather than take my chances with these kind of charts. disc: no positions, under watchlist. I have heard glowing recommendations about the company from a couple of friends who track the sector closely. I still hold my view that a sector that loses its fancy often finds it difficult to regain market fancy soon. Hence fingers crossed. ![]()
20 Likes
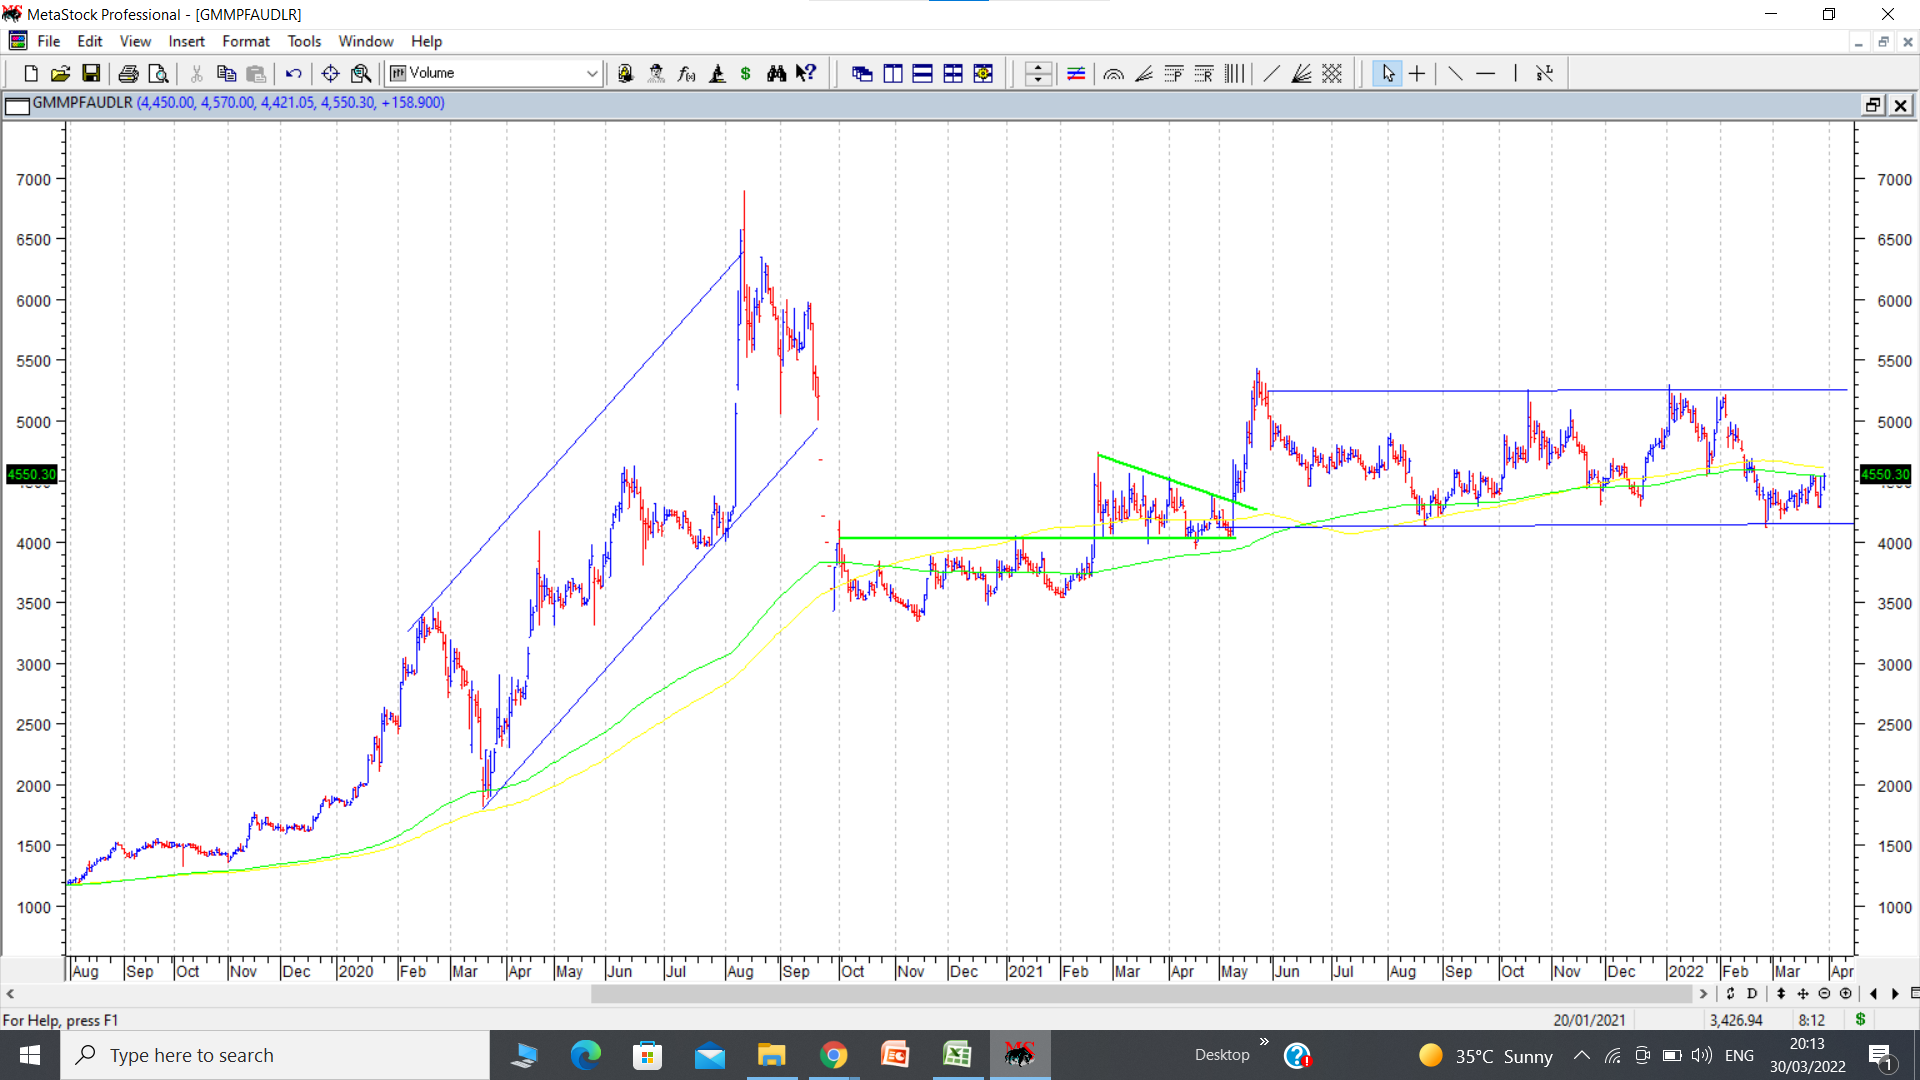
GMM Pfaudler went up nearly 4 times within a span of 5 months between March 2020 to August 2020 before shit hit the fan. Stock price went up from around 1800 to 6900 within 5 months. And then fell down precipitously to 3600 within a few days. And now its nearly 18 months and still stock price remains in range bound moves. Stock price is within a range of 1000 Rs since 10 months now.
So even if fundamentally the company is great, it takes a lot of time to digest these kind of rises and falls. There can be the odd exception to this pattern, but base rate of making big money from such situations where stock prices have fallen drastically after one way upmoves is low.
22 Likes
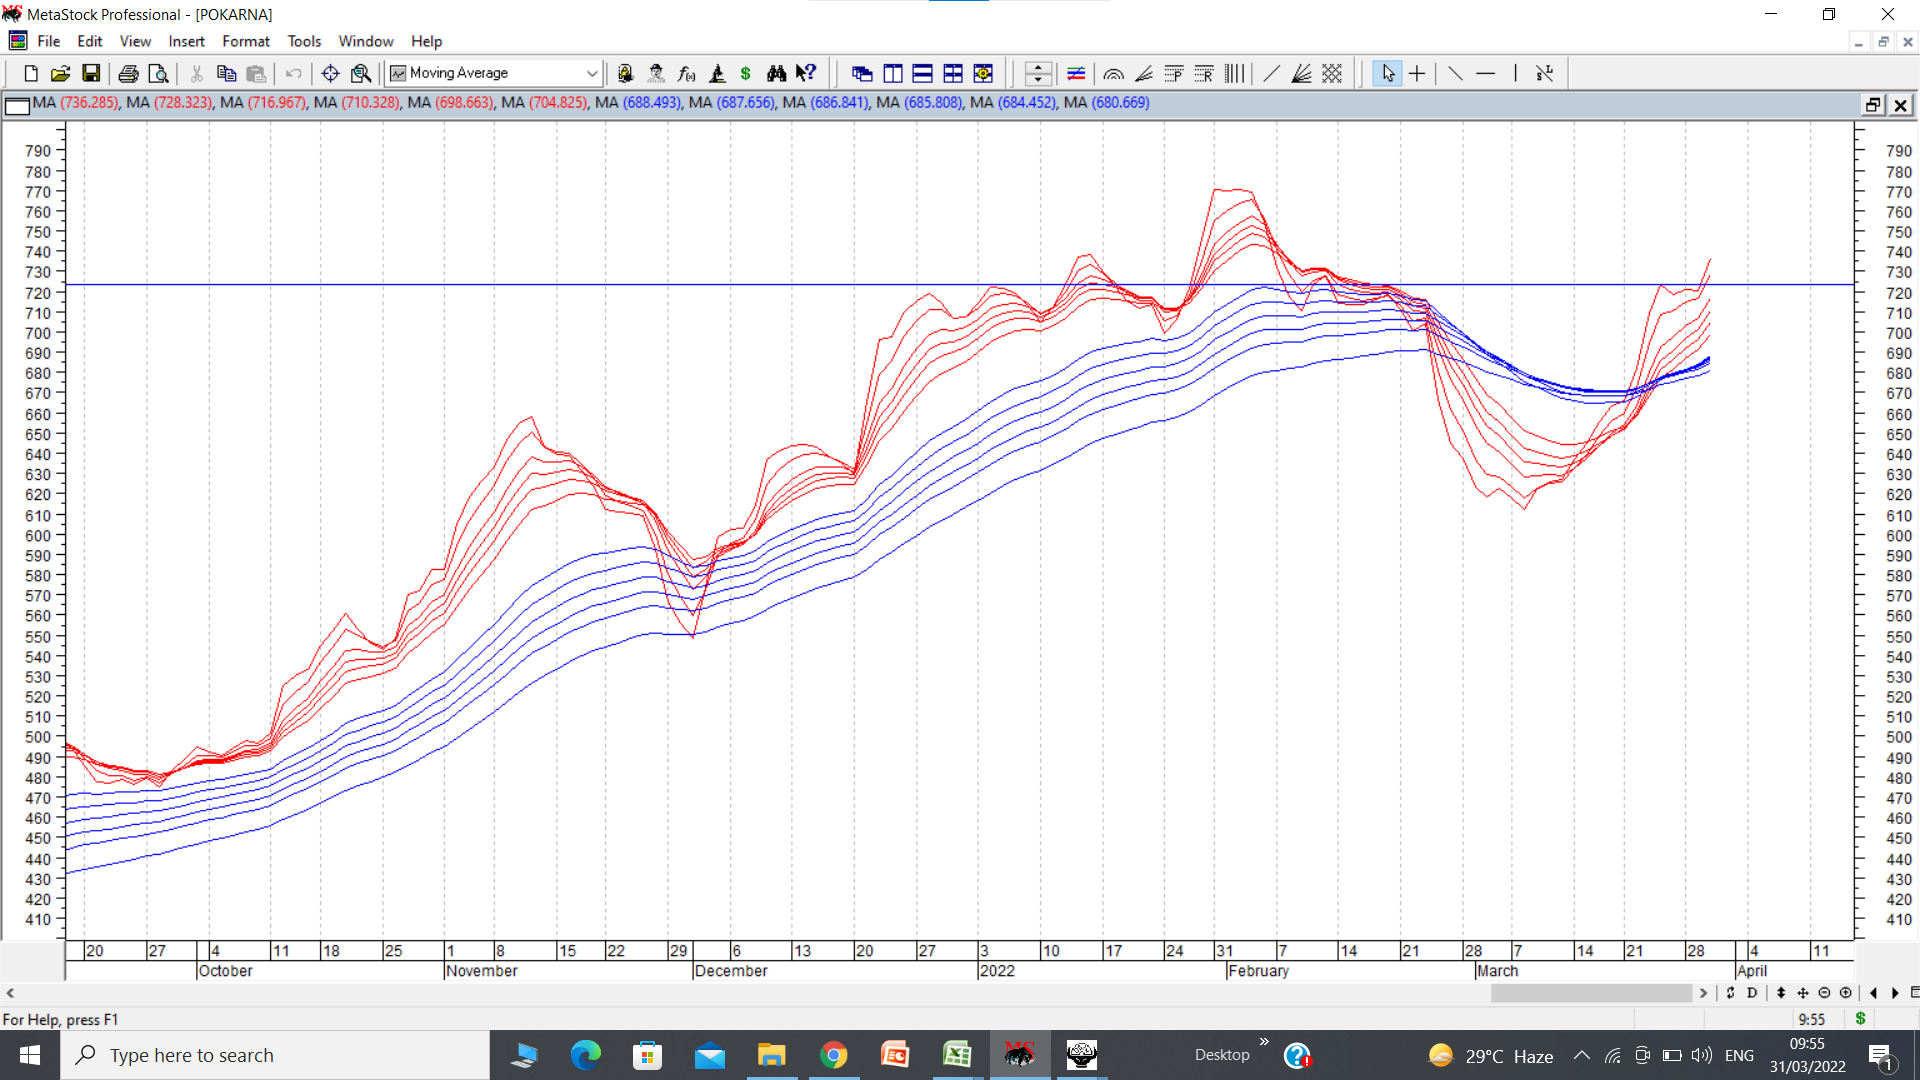
Pokarna had been under short term market correction along with overall market correction since Jan 22. It corrected nearly 30% from its all time high of 840 to post a swing low of 585 and reversed. It has shown strong upmove since then and recently seems to have broken out of a cup and handle pattern. On GMMA charts, targets are close to 830 and on bar chart targets are close to 900, if pattern plays out. cmp 750. disc: invested since a long time.
10 Likes
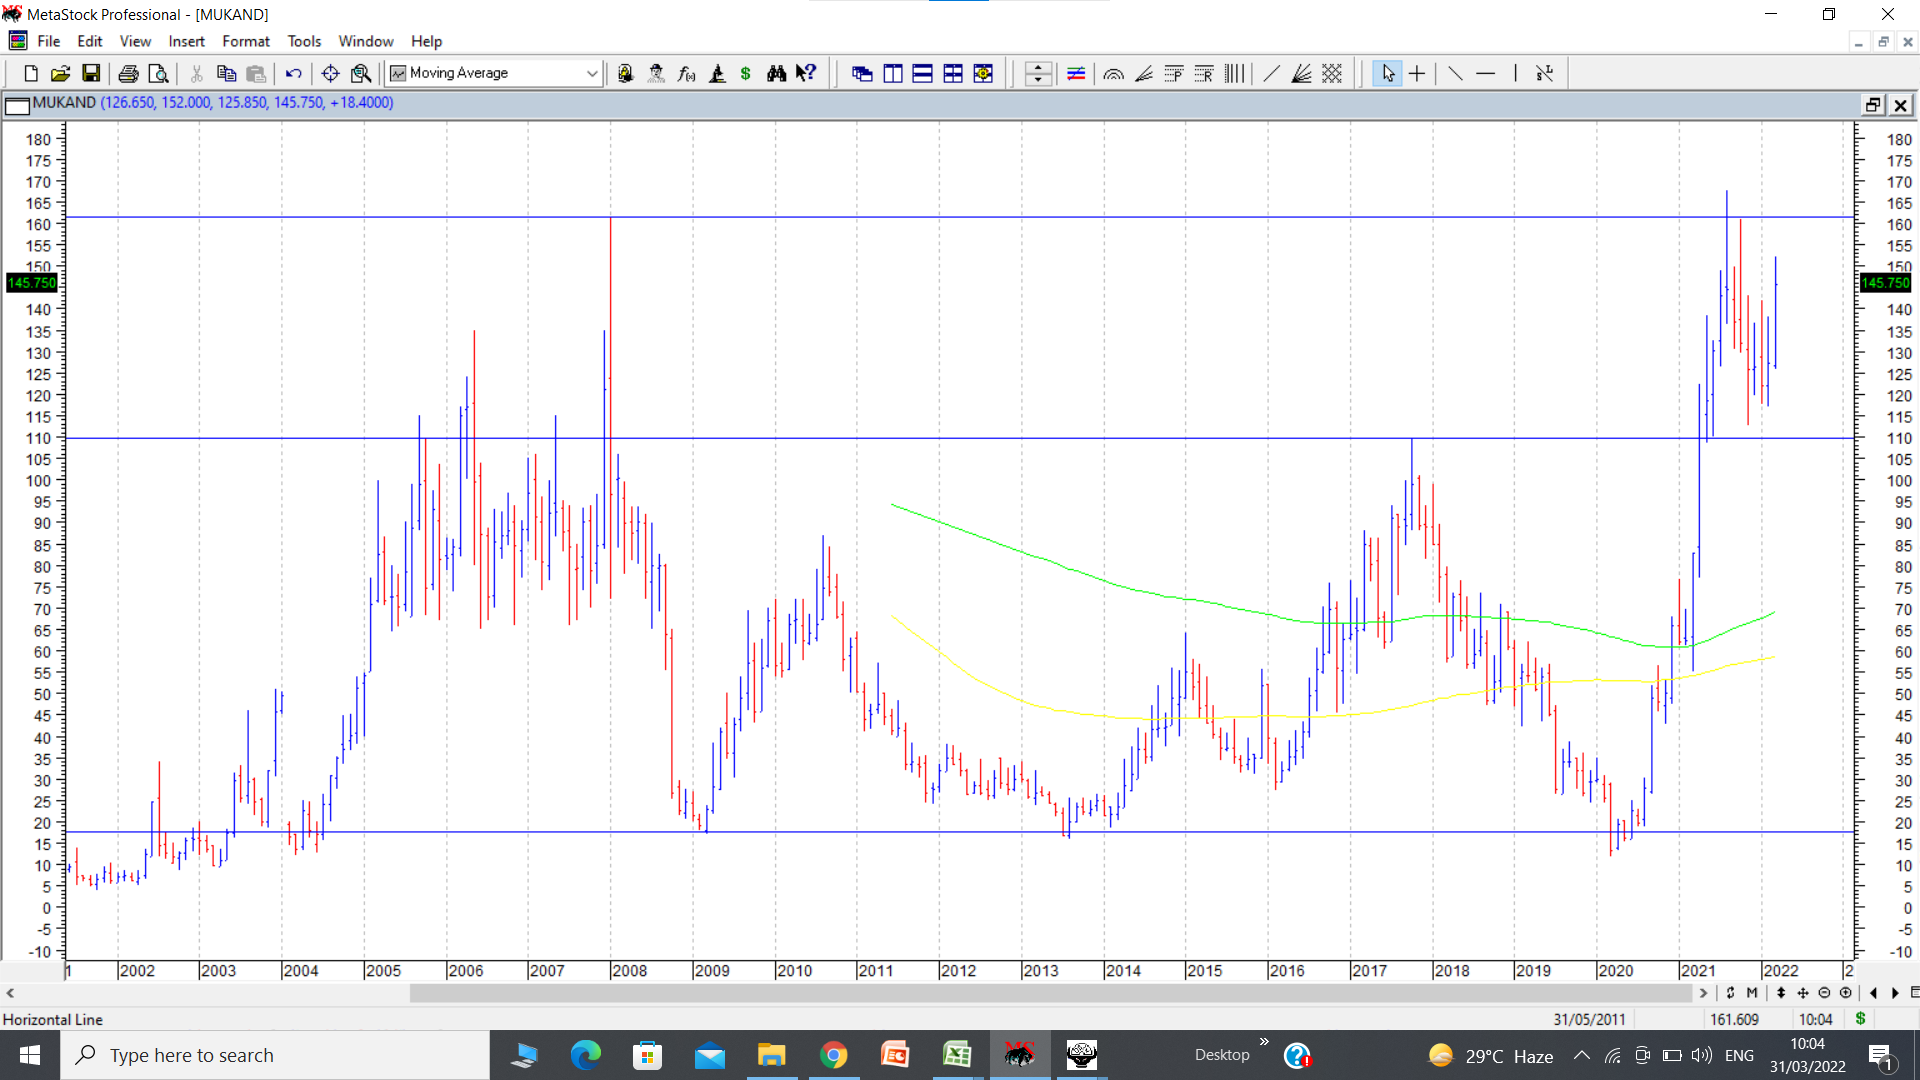
Mukand Ltd presents an interesting chart. Stock price crossed 13 year high of 109 in April 2021 and went up to post an all time high of 167.50 in August 21, thereby crossing previous ATH of 161.5 posted in Jan 2008. Stock price underwent correction since then and has been consolidating above its previous 13 year high of 109 and formed a flag like structure in monthly charts. On daily charts it seems to have completed its short term correction and seems to have begun an upmove. It it crosses 160 again and stays about that level, then it can target 200 plus which is pattern target for a big W (double bottom) pattern.
Fundamentally the big trigger is sale of part of the business and debt reduction, leading to clean up of balance sheet. Going ahead, it could be a steel processor. disc: invested as a techno funda bet.
14 Likes
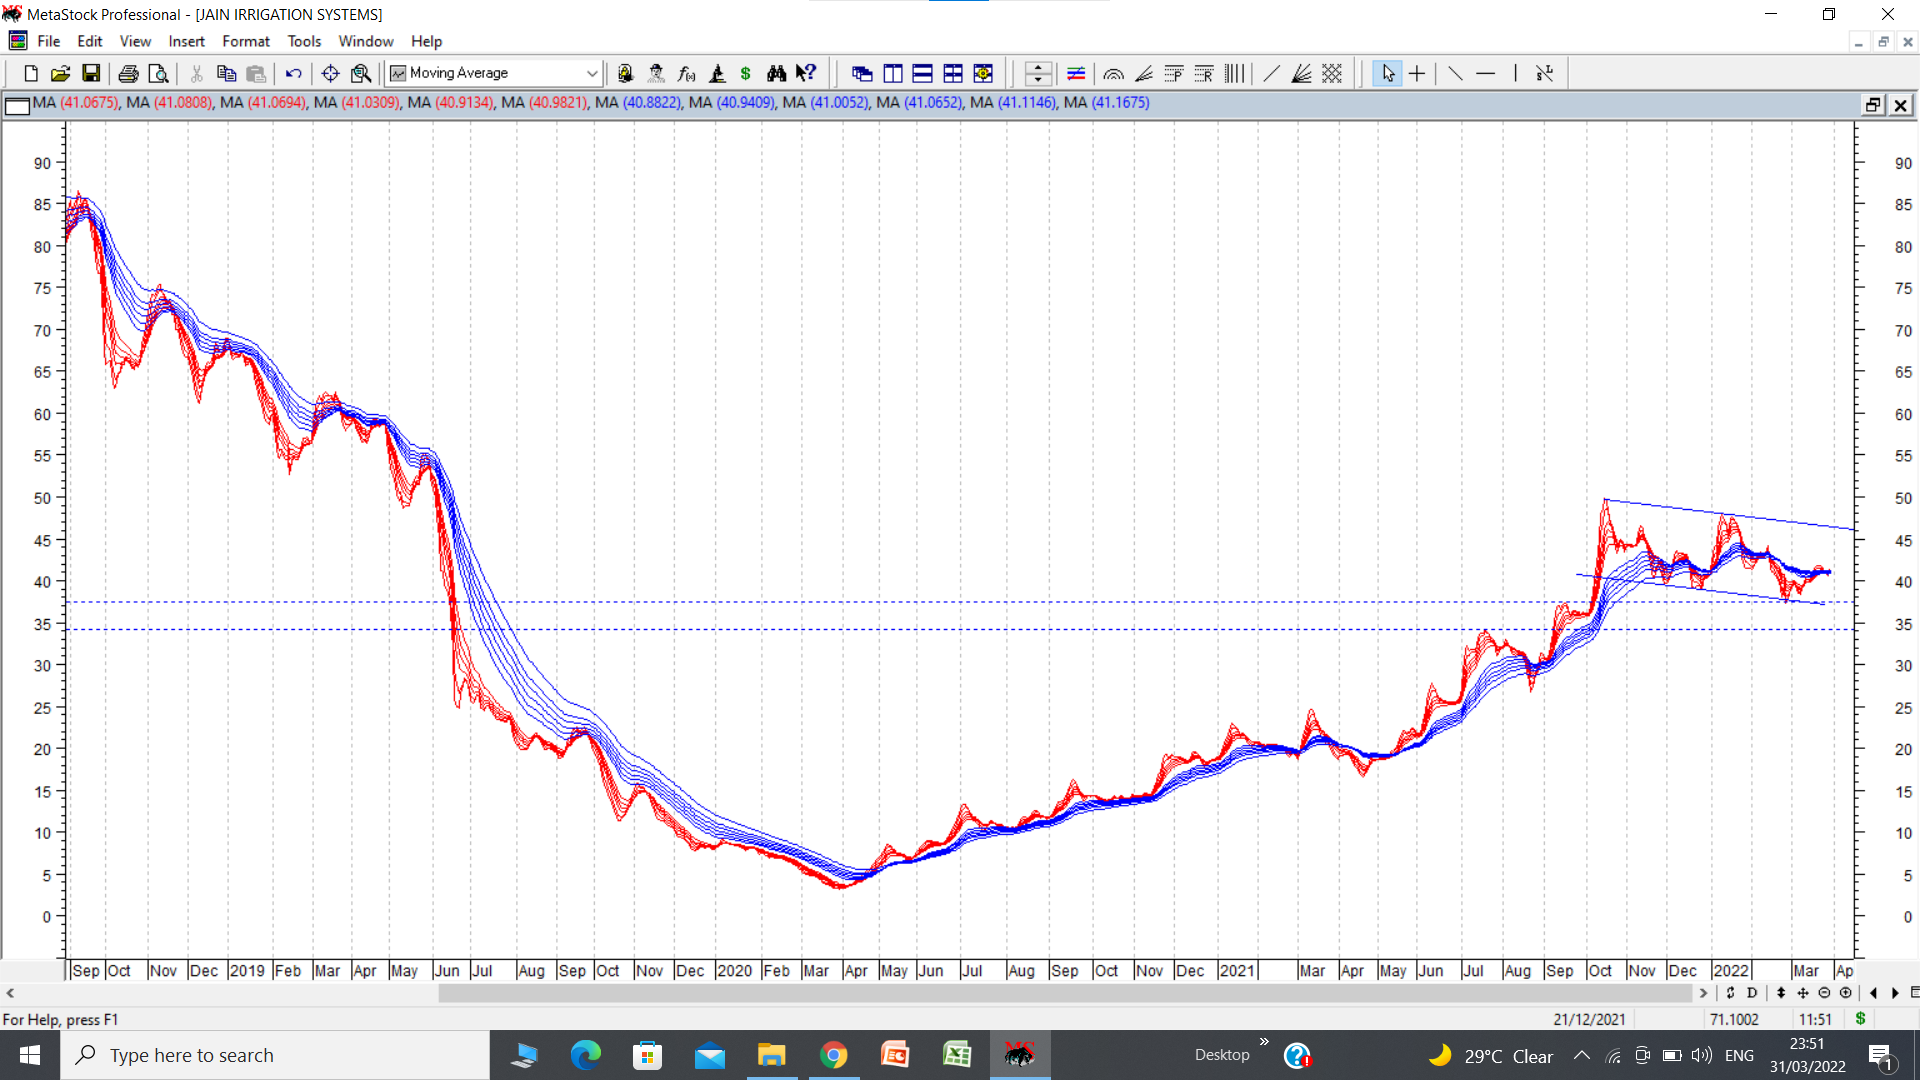
Jain irrigation chart shows a flag like consolidation above its 2 year highs. This consolidation has been going on since past 5 months and counting. Yesterday there was an announcement from the company related to debt resolution plan where the company has reached an agreement to restructure debt of nearly 3800 crores with the lenders. How this will impact the stock price needs to be seen. A breakout from the above mentioned flag would happen once stock price crosses 45-46 and consolidates or moves above that. Zones below which consolidation happened and ultimately were overcome were 34 and 37 and are marked by dotted horizontal lines on the chart. Please find attached document with details of debt resolution plan. disc: small starter position. plan to add more on successful breakout
jain irrigation debt resolution march 22.pdf (2.8 MB)
6 Likes
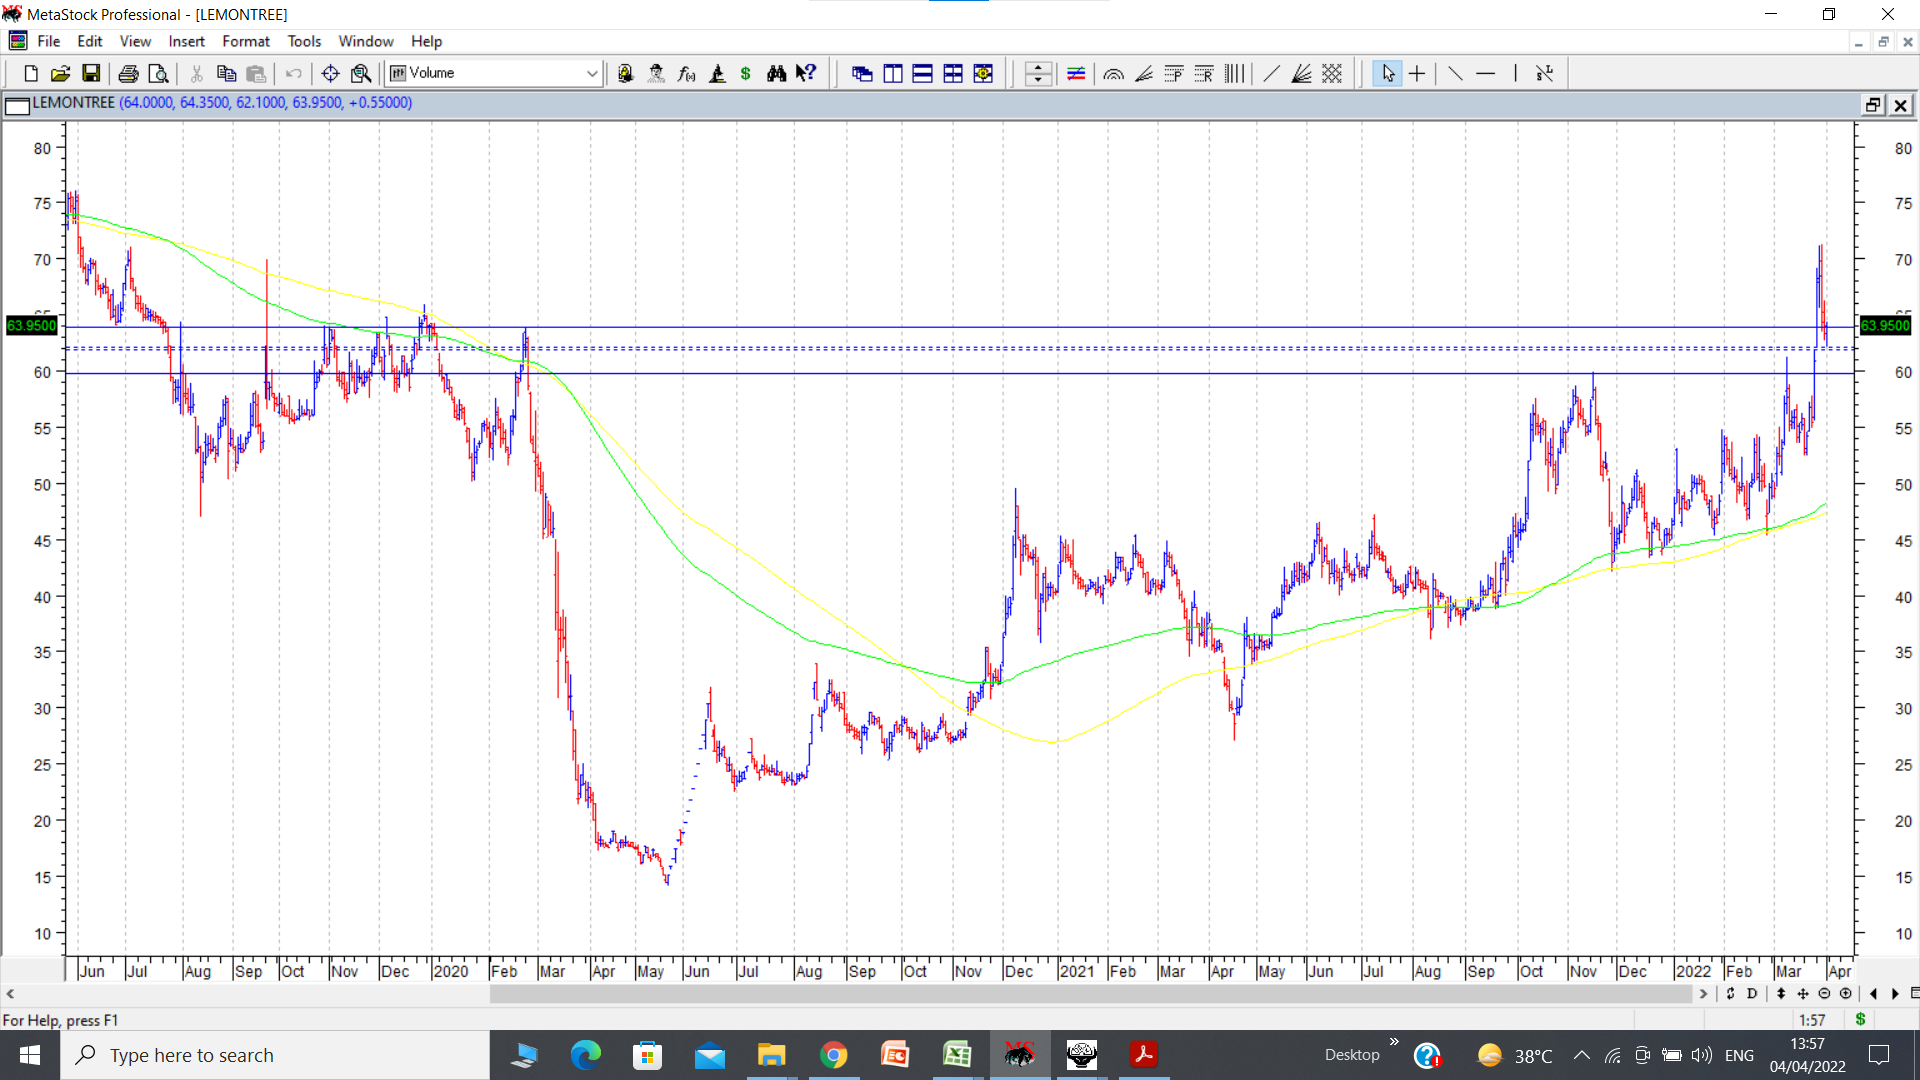
Lemontree (and a lot of other hotel stocks charts) shows a bullish breakout past 2 year highs of 64 and subsequent consolidation around that zone. A small gap up area between 61.90 to 62.10 has been marked on the chart in dotted lines.
Horizontal solid lines indicate previous major tops/resistances.
If pattern is successful, targets can be in the range of 90-100. (disc: invested as techno funda bet.)
8 Likes
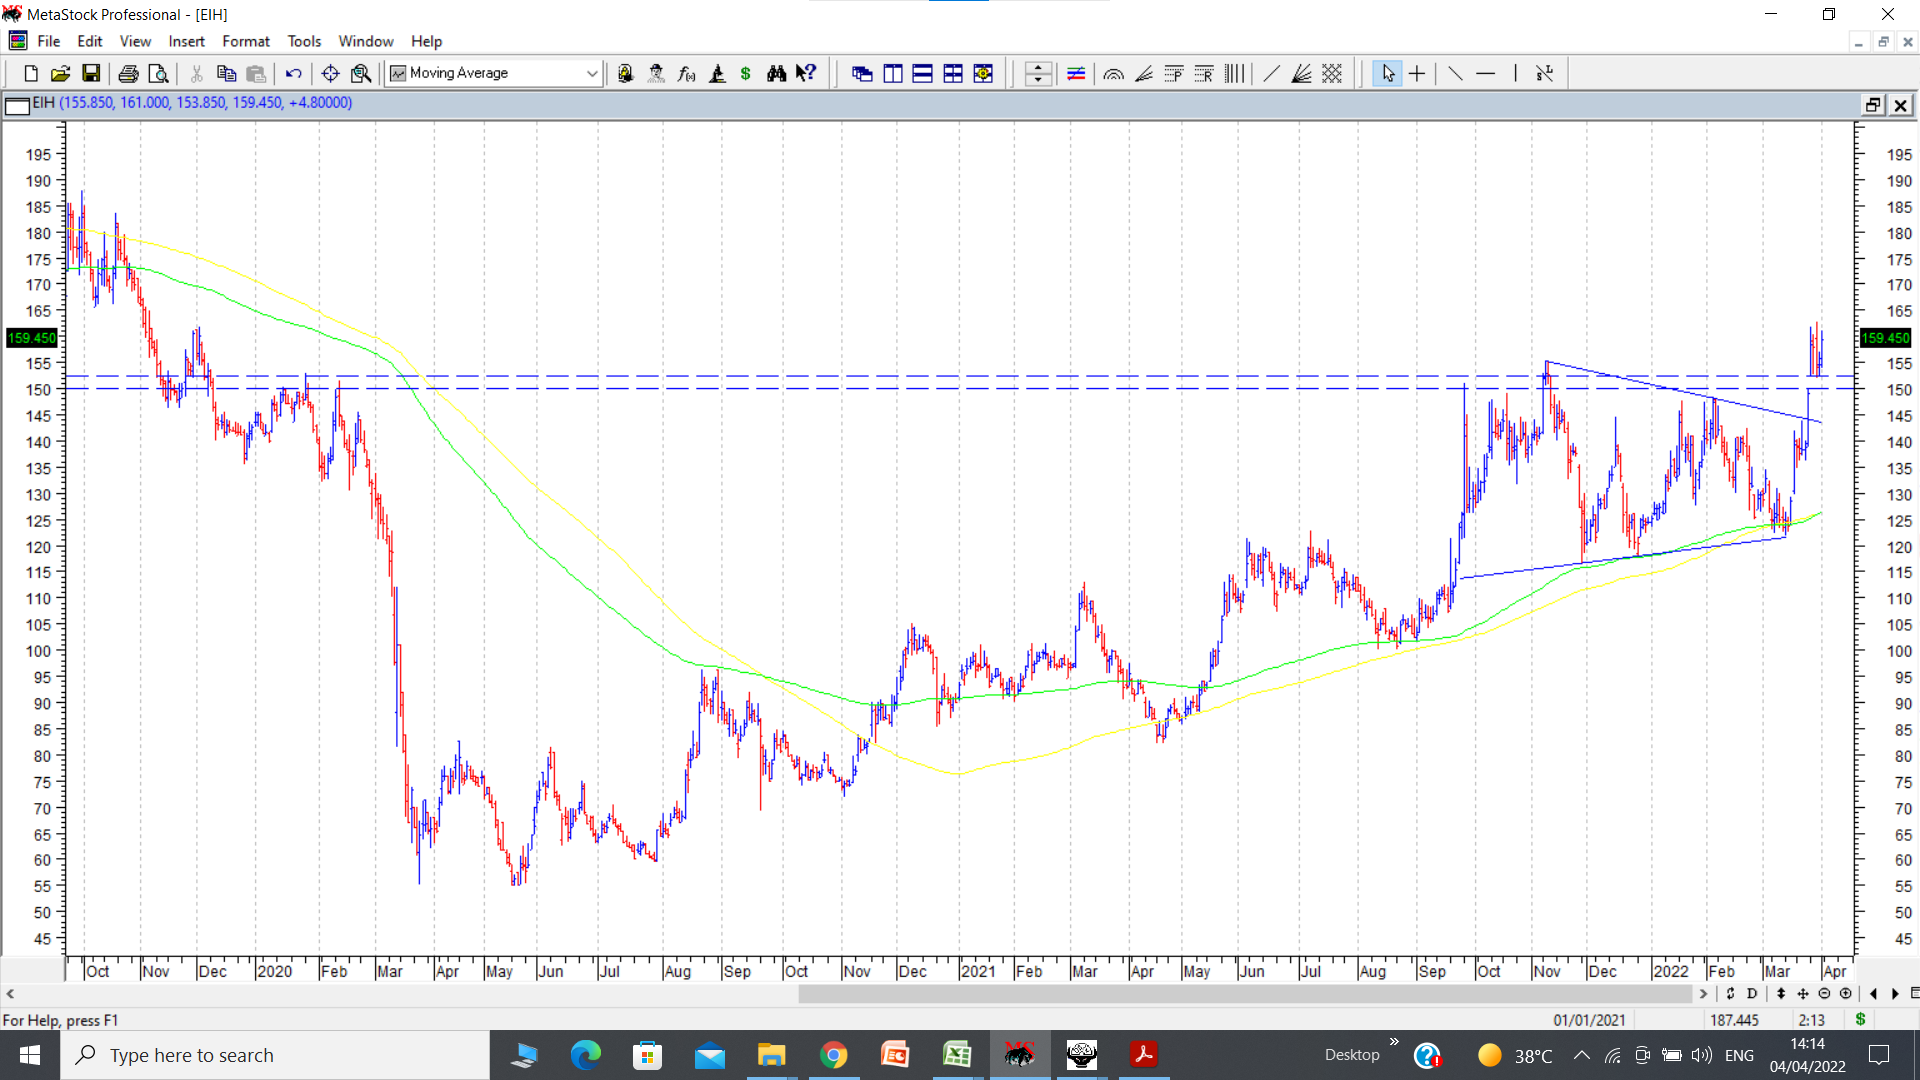
East India Hotels Ltd. (EIH) chart shows a 2 year high breakout with a gap up marked in dotted line. Chart almost similar to Lemontree posted earlier. If pattern plays out, target can be around 250. cmp 157.
Immediately before breakout there was a nice triangular consolidation perched above 200 dema. which provides a good launchpad for strong upmoves. (disc: invested as a techno funda bet. ) I have taken a basket approach to play the hotels sector.
7 Likes
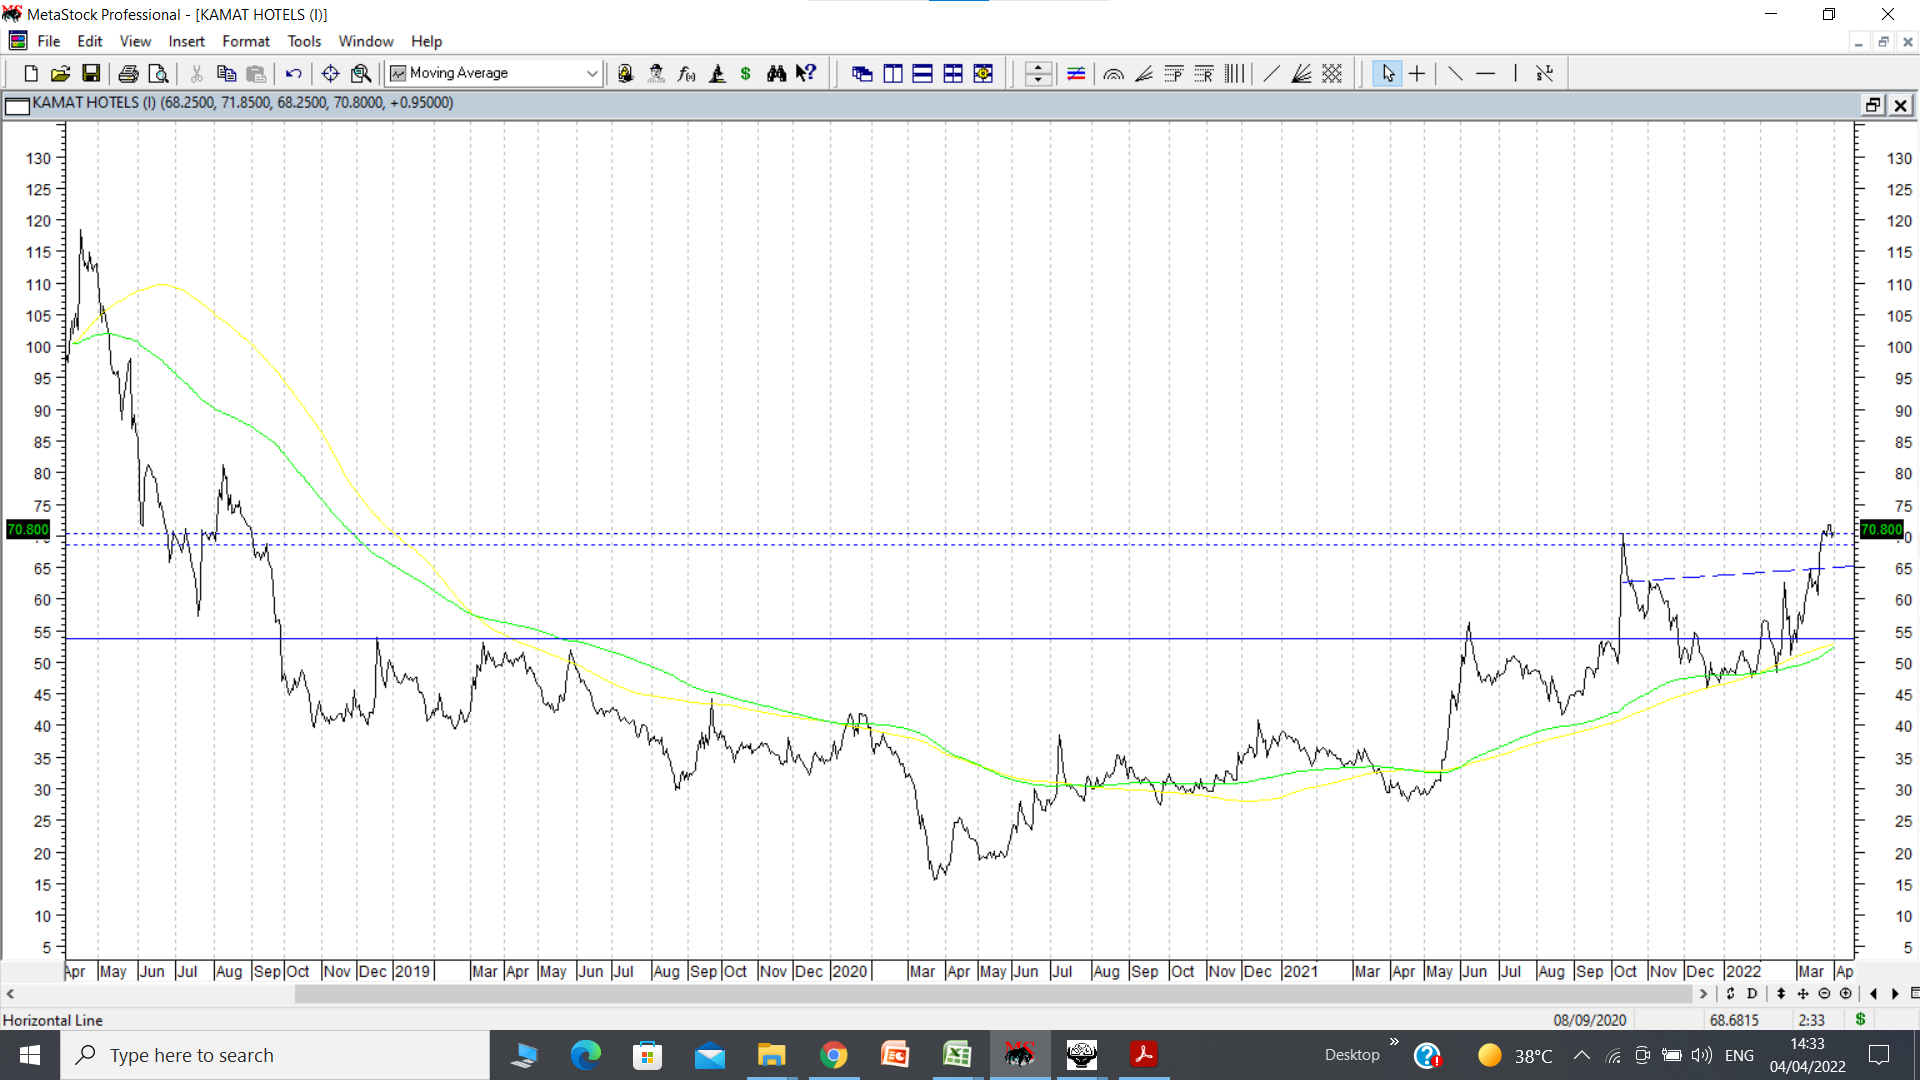
Kamat Hotels Ltd shows a bullish rounding bottom formation. and stock is now consolidating around its 2 year highs of 68. Note a rounding bottom/inverted head and shoulders pattern marked on the right corner of the chart, with neckline marked in dotted lines. If pattern is successful, target can be in range of 120.
disc: invested as a techno funda bet.
12 Likes
Rushil daily chart on year timeframe, a channel breakout at upper end is seen, volume are not high yet, 52wk high point. Next resistance at 650.
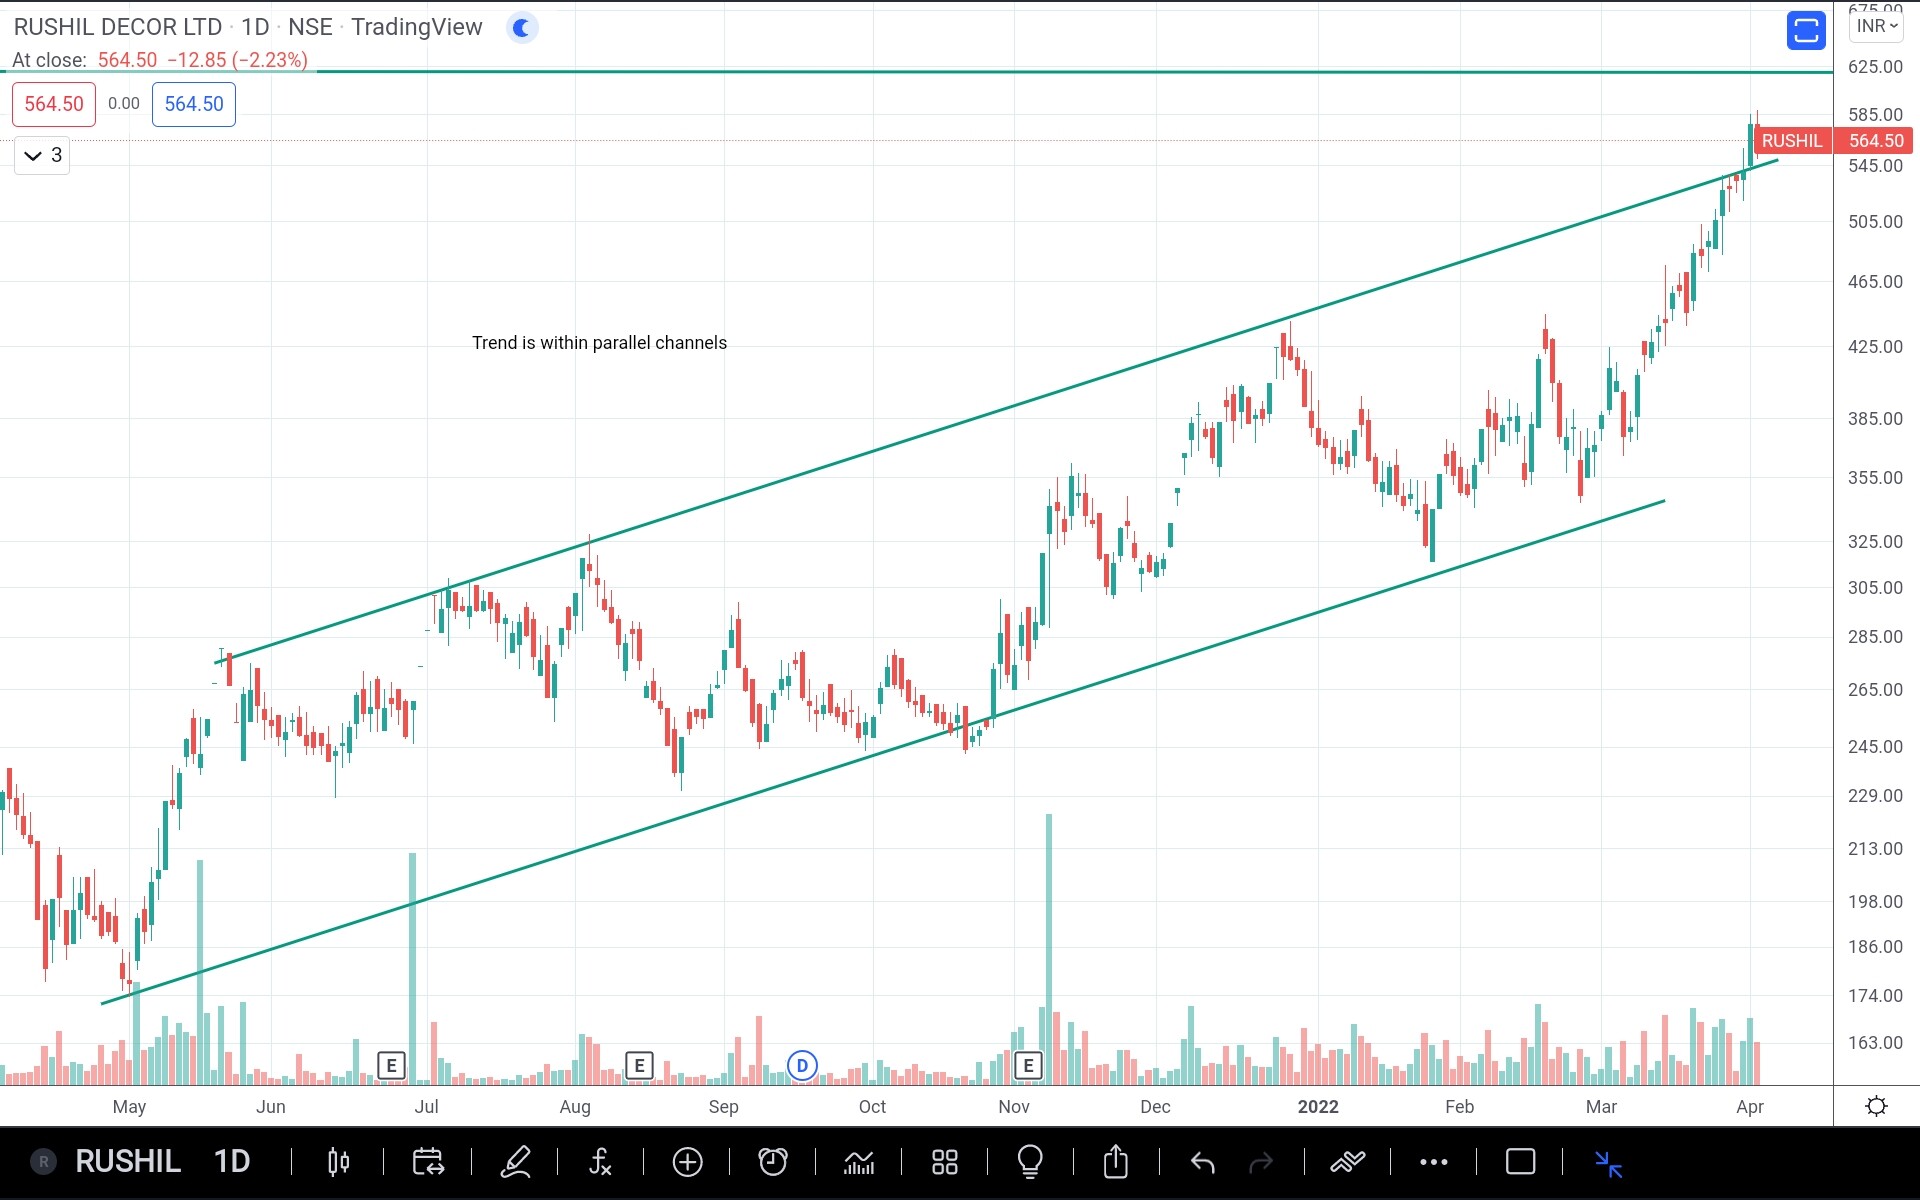
Fundamentals covered in thread here
8 Likes
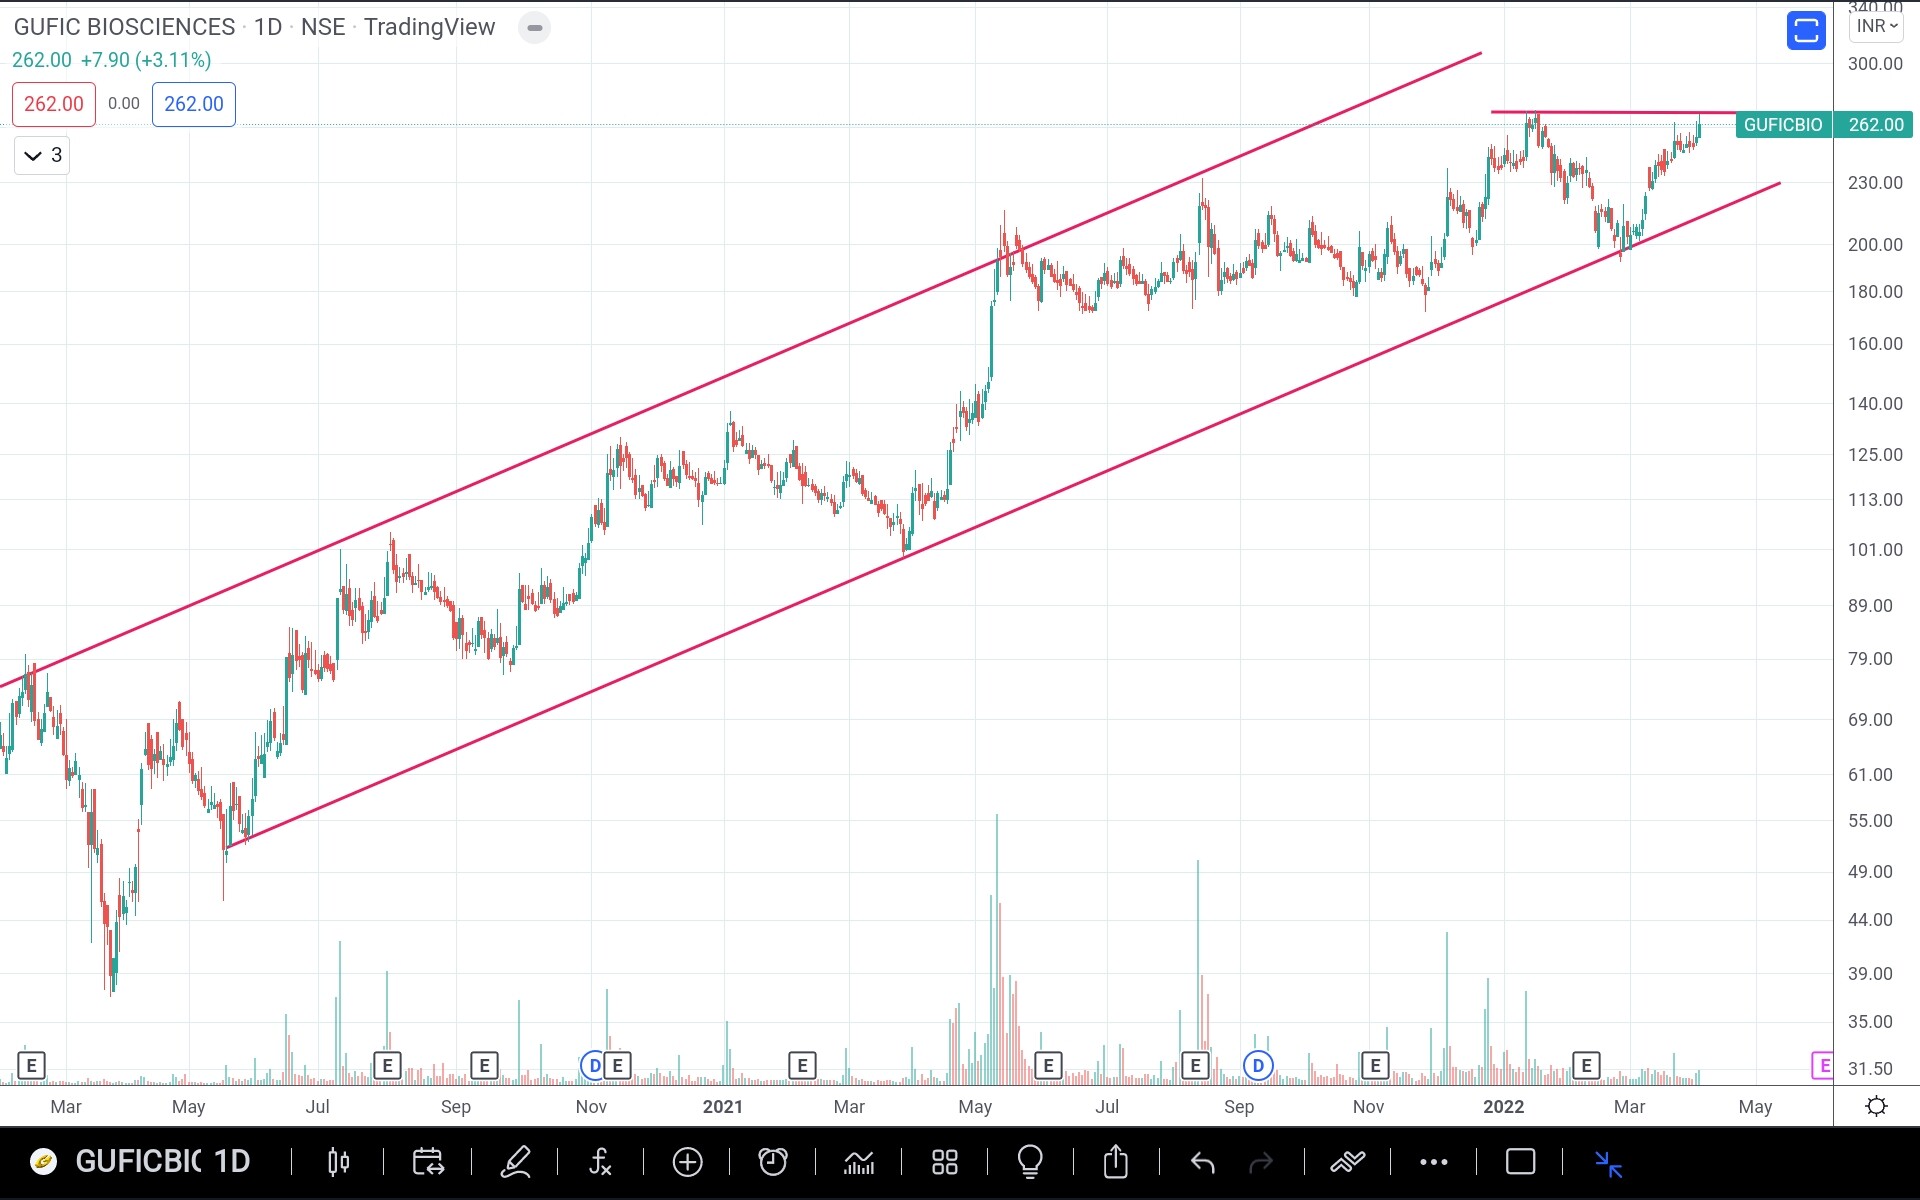
Gufic bio, rising channel, retesting ATH, breaking out can take to upper channel range.
Lot of action on company front, well covered in Gufic thread.
8 Likes
Looks like all 3 hotels you mentioned i.e. EIH, Lemontree and Kamat have run up today and are on the verge of breaching their 52 week highs. Do you see the trend continuing over the next few weeks? I’ve been reading that room occupancy is higher than pre-covid levels in some pockets of the country and overall, summer bookings have also increased. I am not invested and have no knowledge on technical analysis but have been following this thread to see how it plays out 
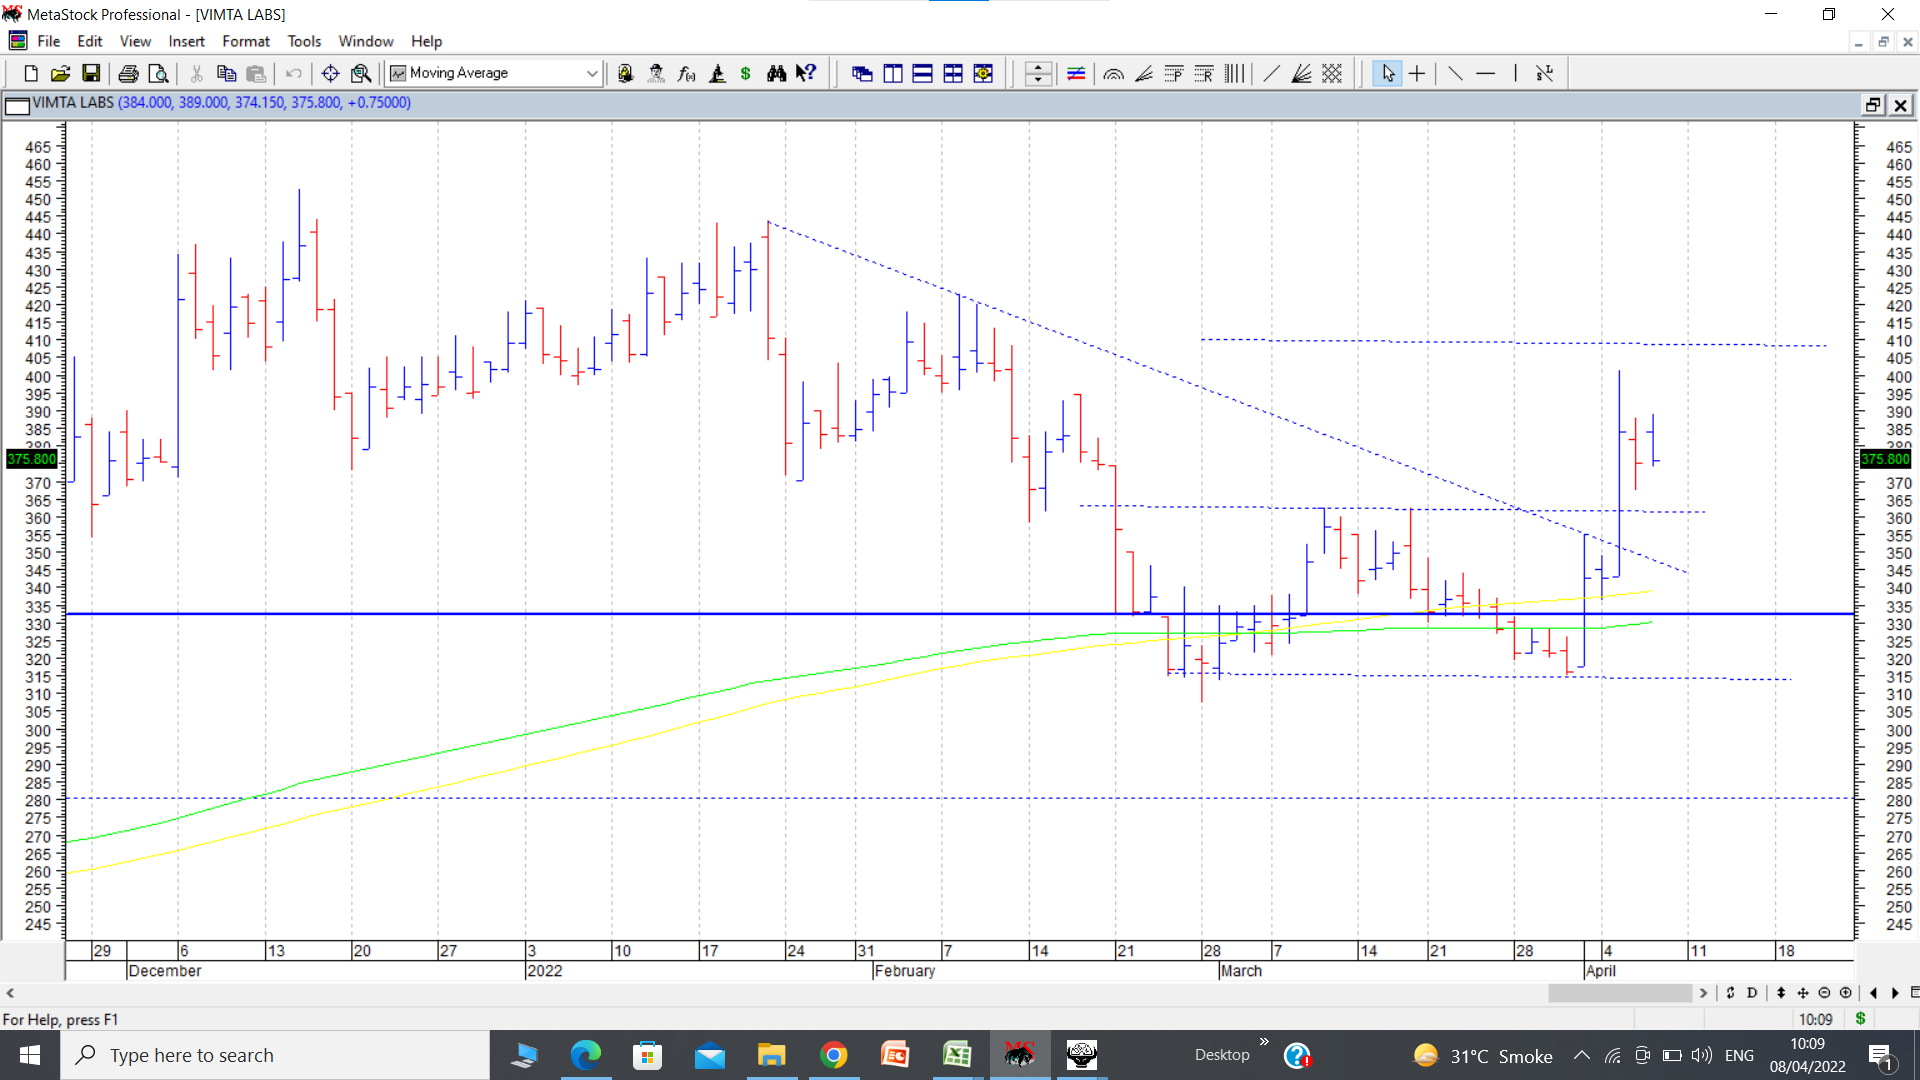
Vimta labs corrected from a high of 452 (almost made a double top with a lower top at 442 and breaking below 373) and went down to post a low of 307. Since then it seems to have made a double bottom at 315 which got confirmed on breakout above 362. If successful pattern target can be 409. cmp around 378. Another aspect to look at is that it took support in the zone of its 200 dema and its previous all time high at 320-330. The latest double bottom breakout seems to signal that the short to medium term correction in the stock price seems to be over. Going ahead, once it regains momentum, it needs to break out above its double top range of 440-450 to post strong rallies. (disc: invested as disclosed before.)
6 Likes
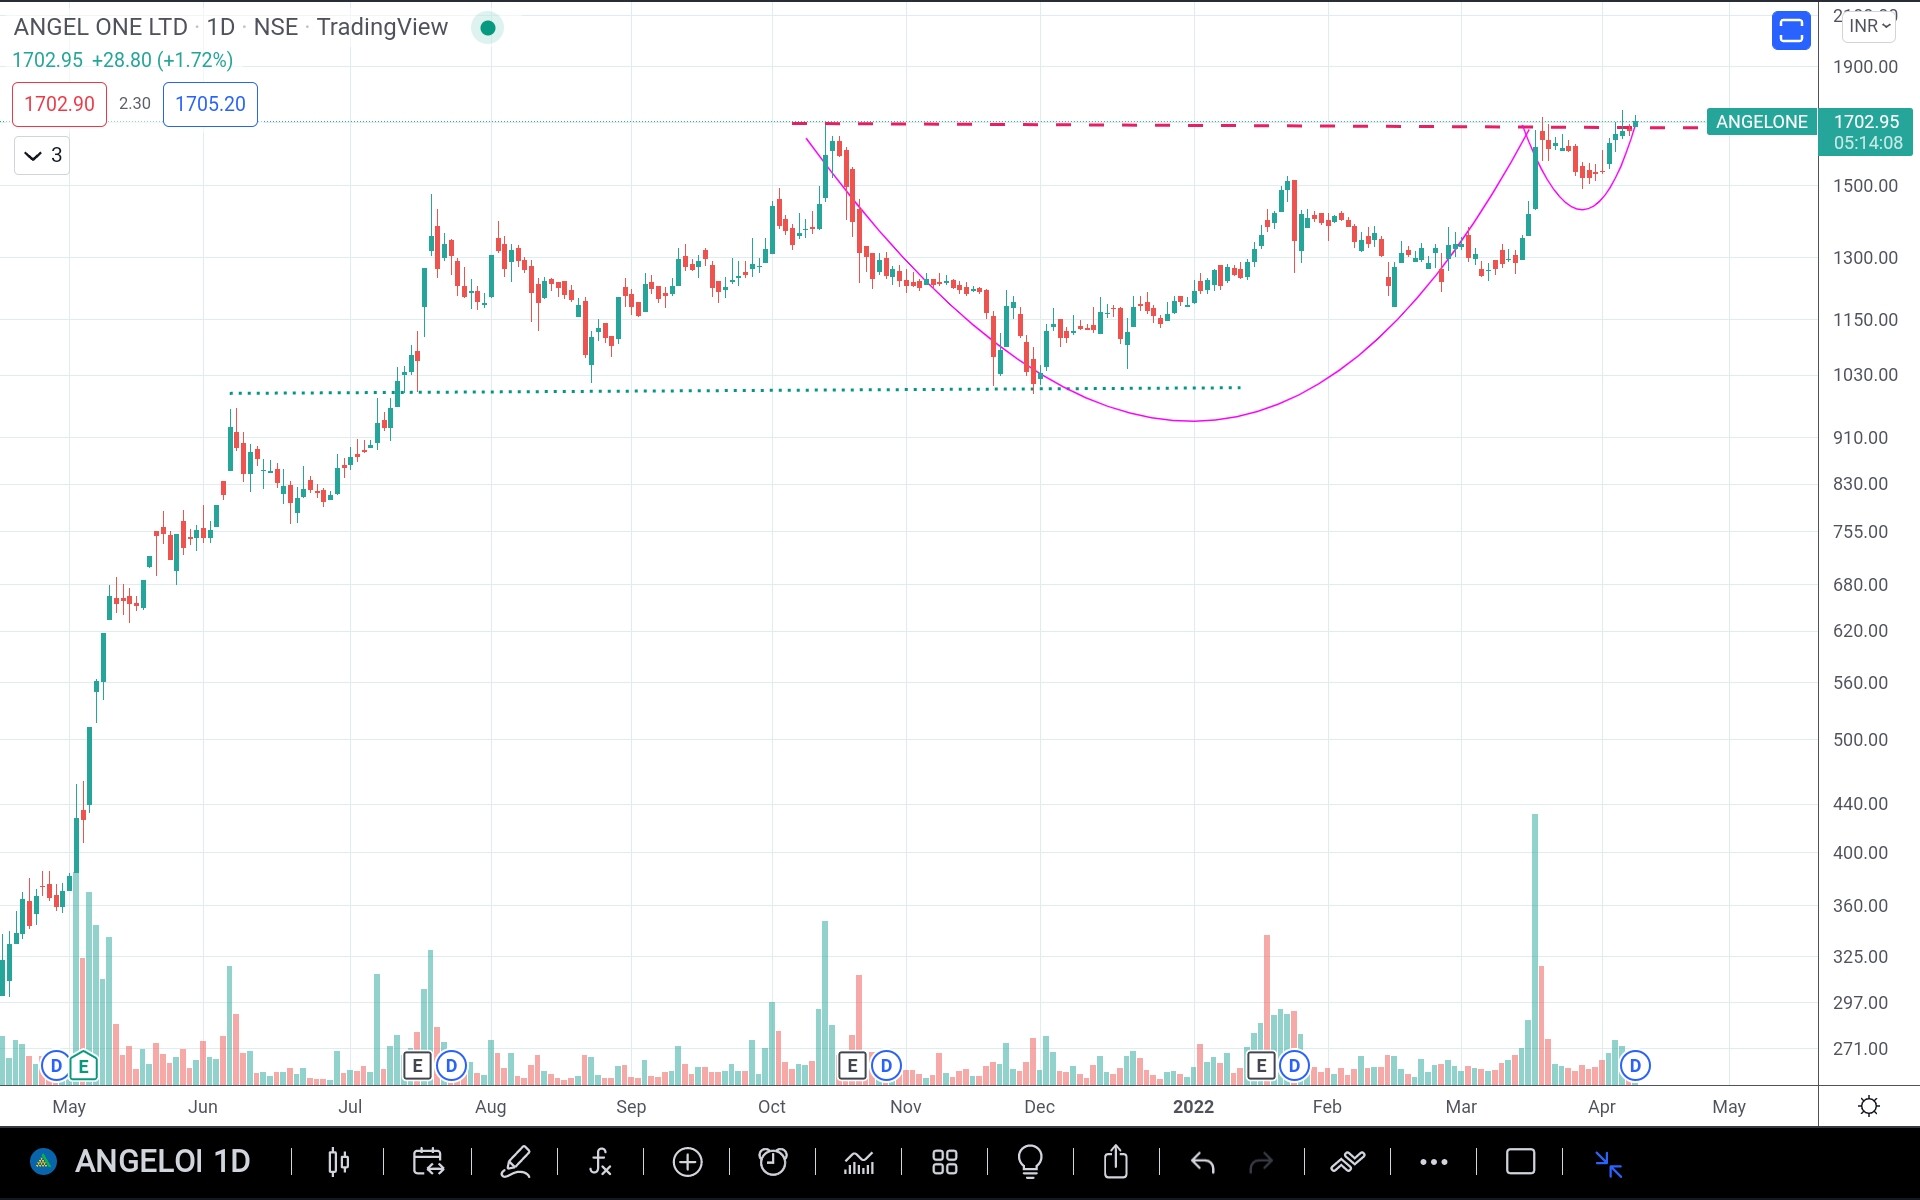
Angel one, daily chart, ATH, a cup and handle formation. Although considered cyclical - has given excellent returns riding on retail wave in equity with pivot to digital model, it has weathered mkt volatility in last 6 monyhs quite well with consistent MoM and QoQ performance. Next leg of beyond broking with super App to be launched in Q1.
3 Likes
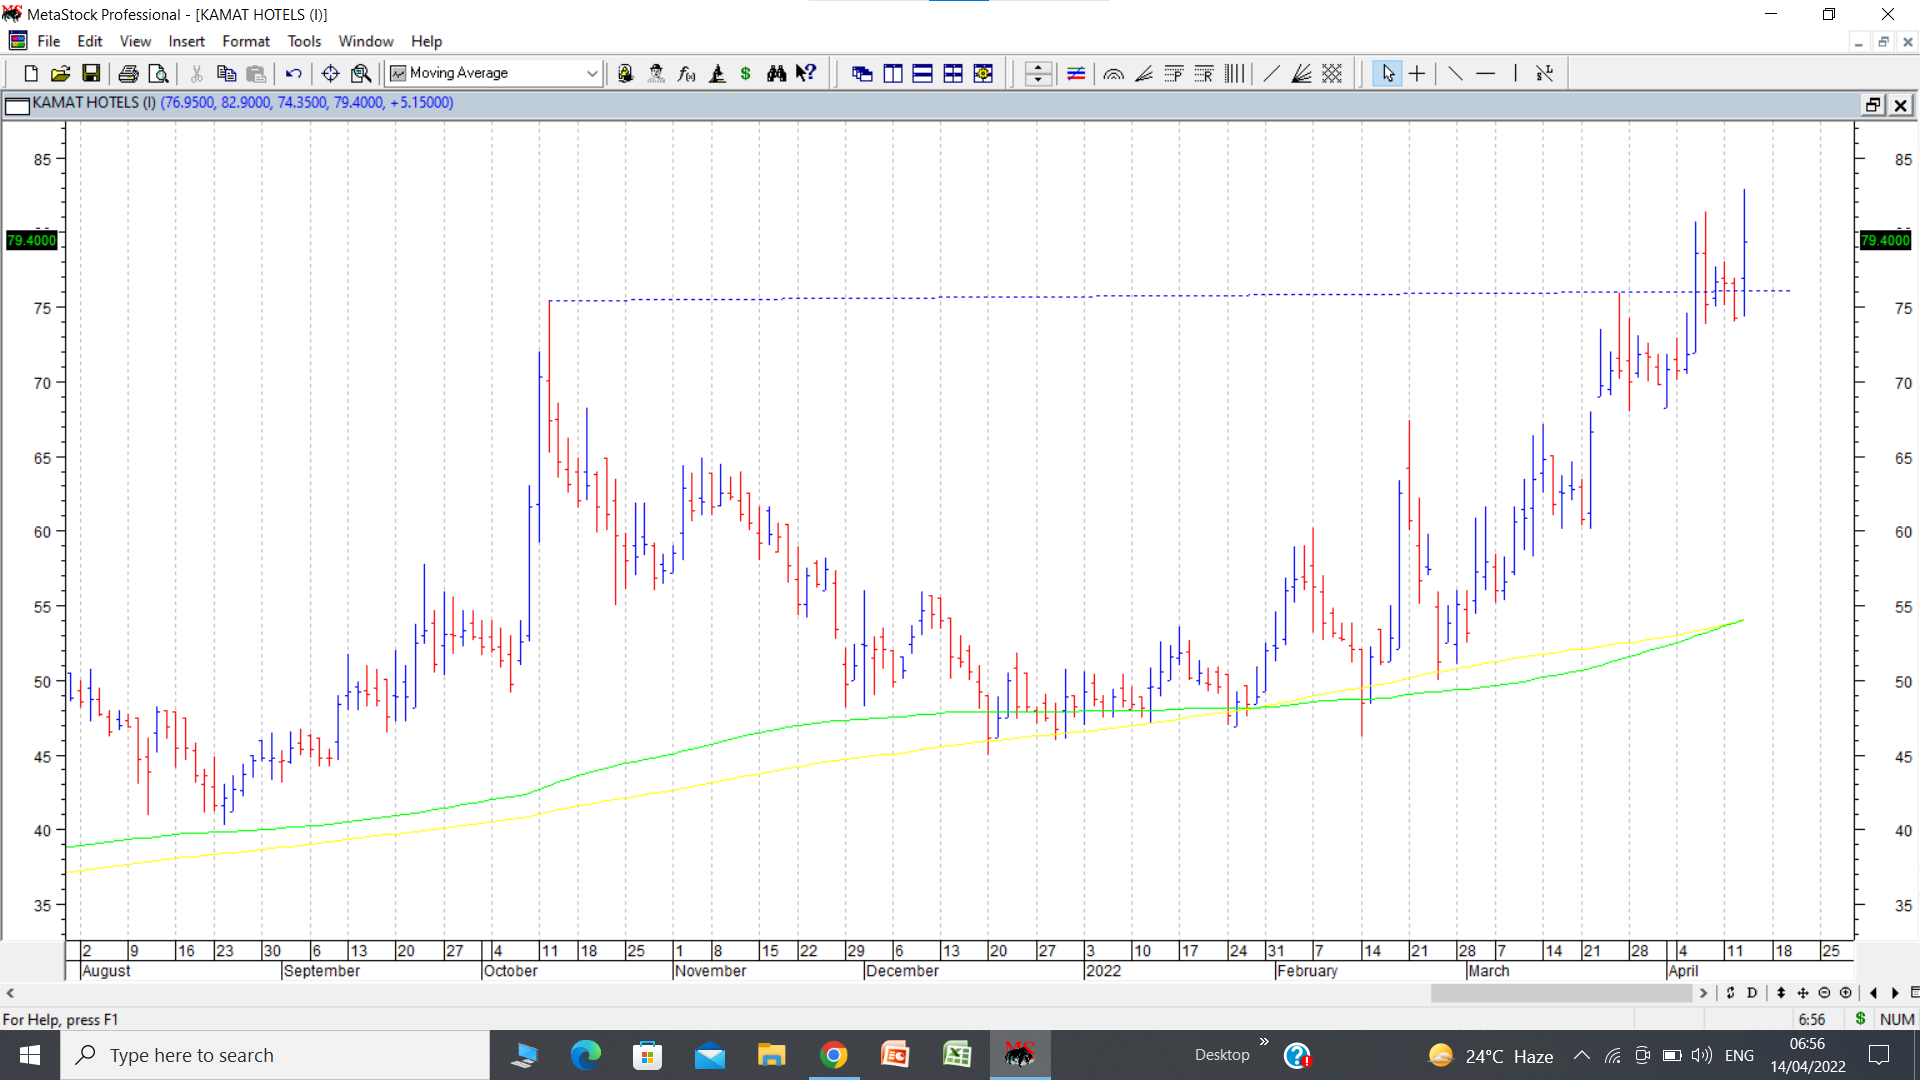
Kamat Hotels chart upate. Stock price has broken out of a cup and handle pattern above 75. The lower end of the cup shows good consolidation/support around the 200 day simple moving avg (yellow) and 200 day exponential moving avg (green. ) at around 48-49. If successful, pattern target can be 100 plus. disc: invested in kamat along with lemontree and EIH as a basket play on hotels sector.
17 Likes
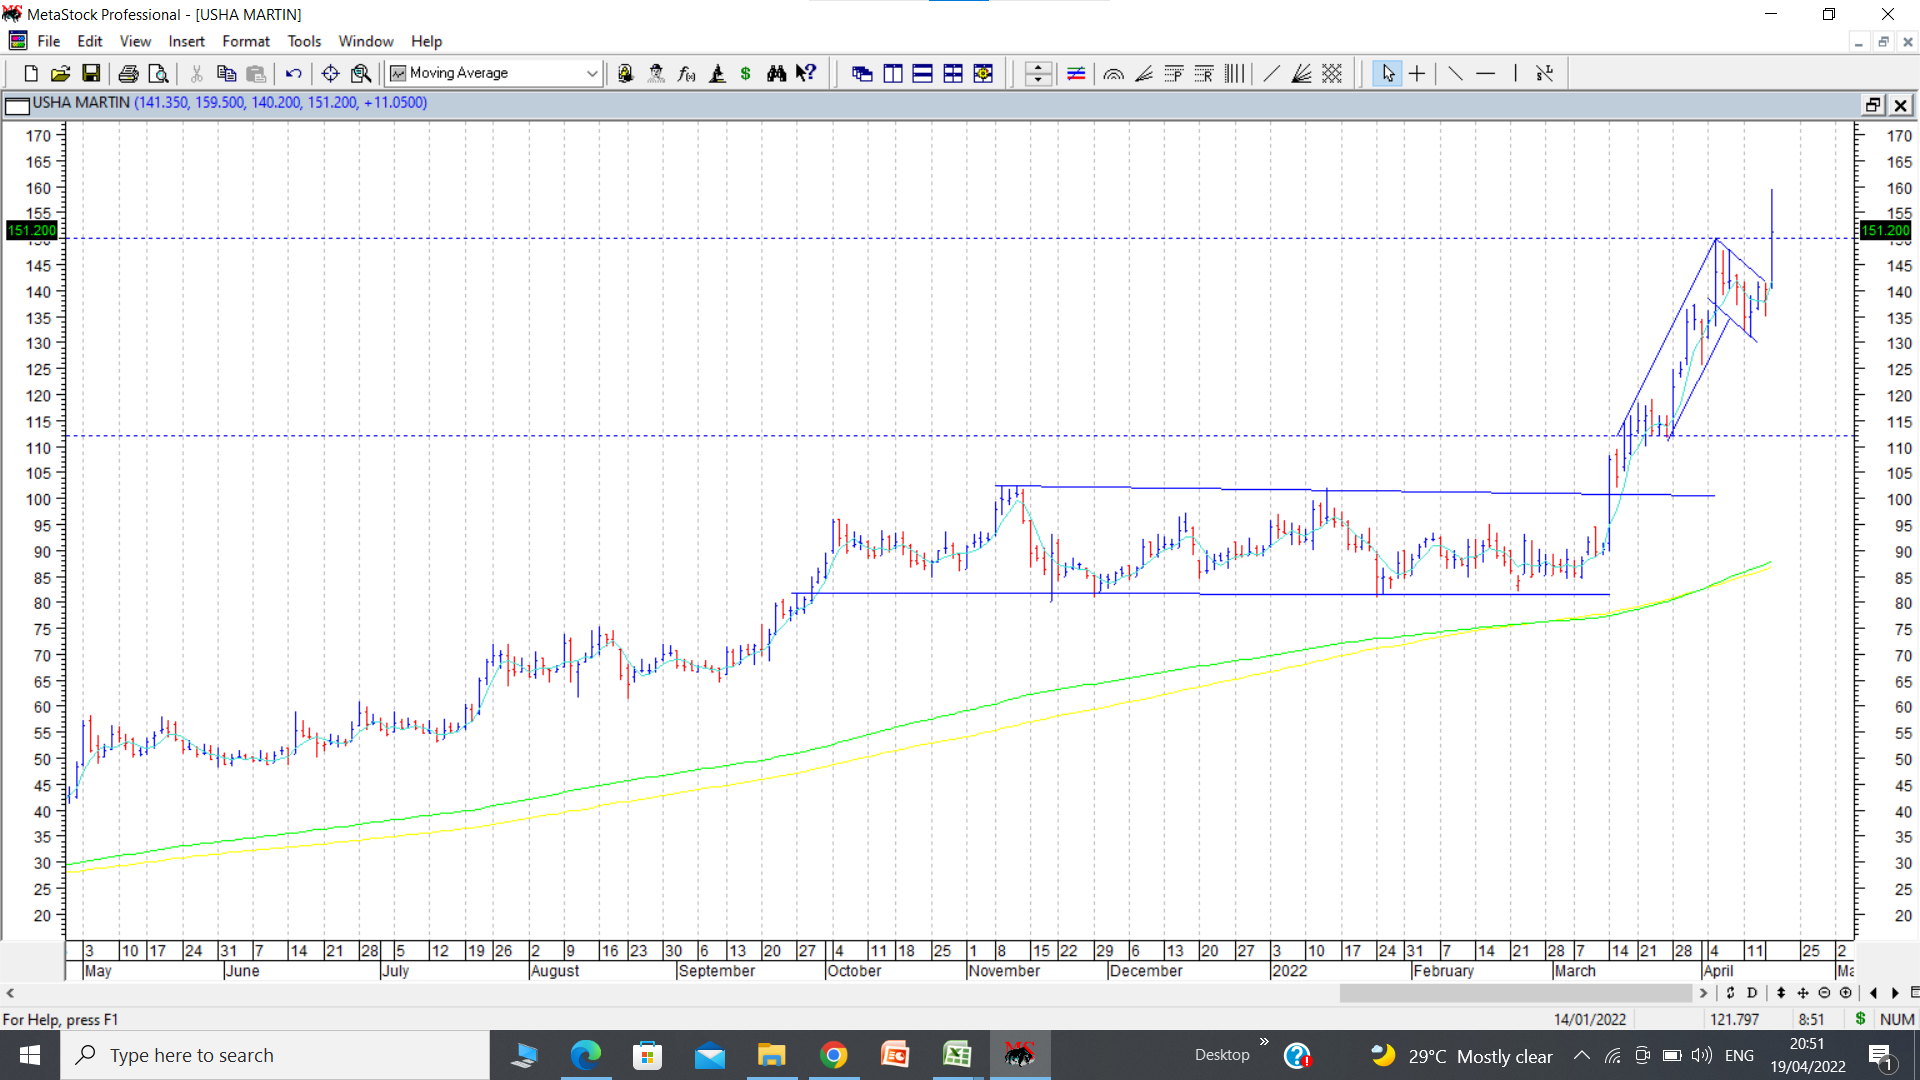
Usha martin crossed its previous all time high of 154 by breaking out of a flag pattern. Flag pole is from 112 to 150. (38 rs) Breakout level is 142, so target if pattern plays out can be 142 + 38 = 180.
Also note the prolonged consolidation between 80-100 for nearly 6 months marked in the chart after which the stock broke out and went from 100 to 150 in a fast move.
21 Likes
Gold Weekly Chart :CMP 1953
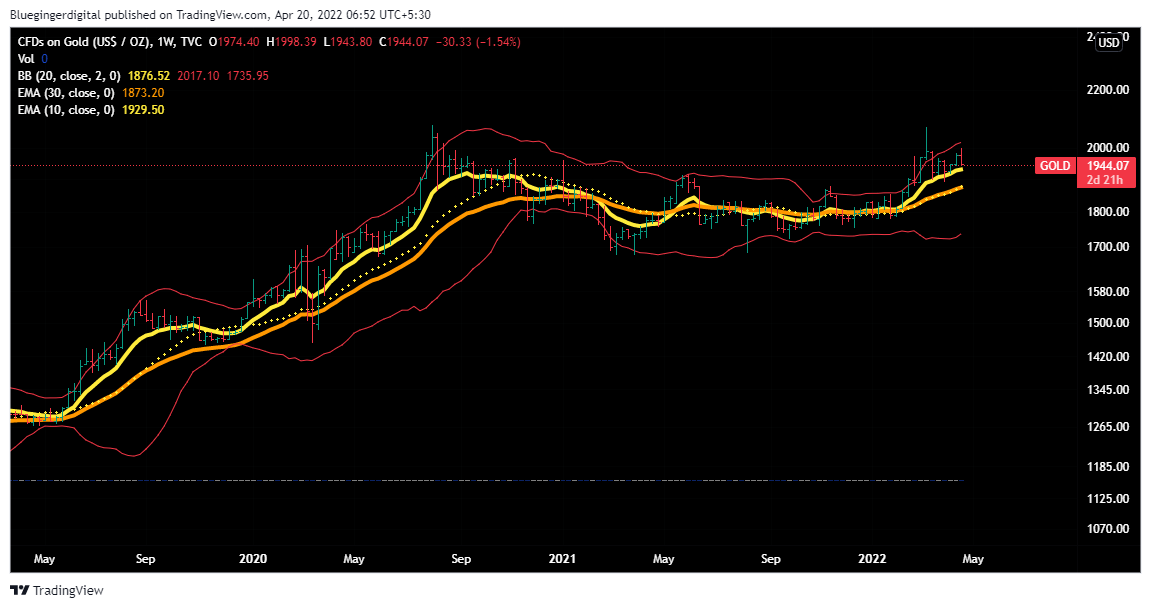
This analysis is based on Stan Weinstien Stage-Analysis method as well as by tracking the Elliot Wave structure at the same time.
As per this , Gold is in stage 2 and is progressing well .Stage 2 is an ideal state to be in for a longer term investment.
As per Elliot Waves count, as of now, gold is pulling back in minor wave ii of Wave III (of larger Wave 3) .
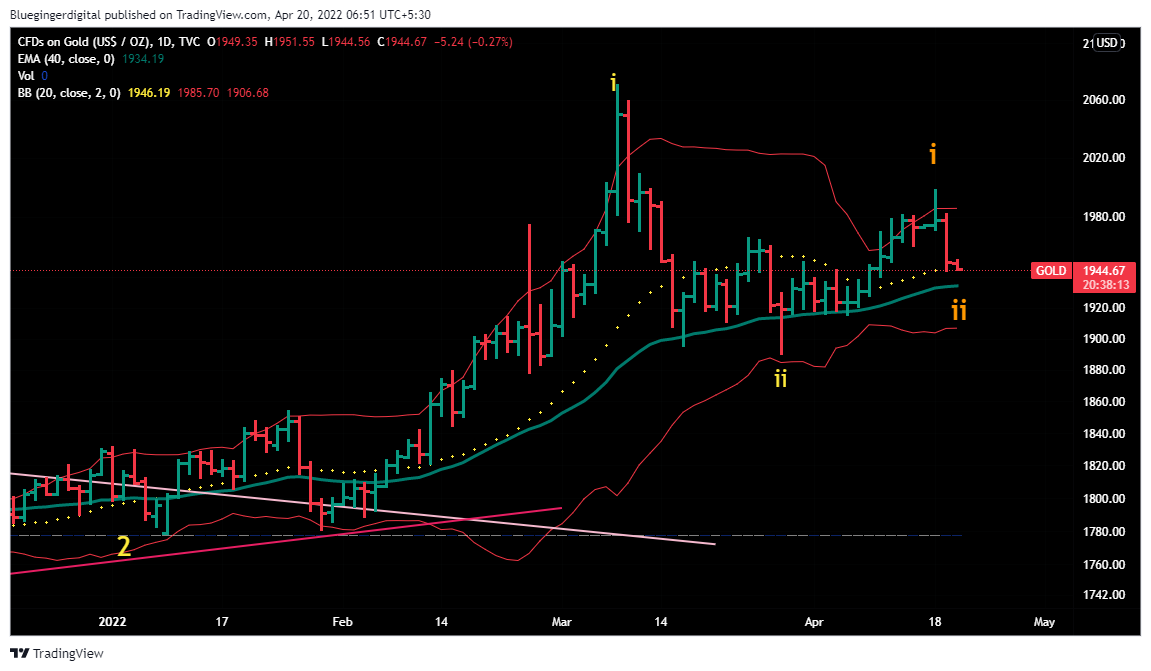
Longer term target wave 3 is US $3000 /Oz whereas shorterm resitance is 2072.
As gold has global economic implications- the movement and timelines can be very different as compared to individual stock-movements ( though 3rd waves happen to move faster than wave 1 or Wave 5 , but still in case of gold the speed is relatively slower as compared to any individual stock)
5 Likes
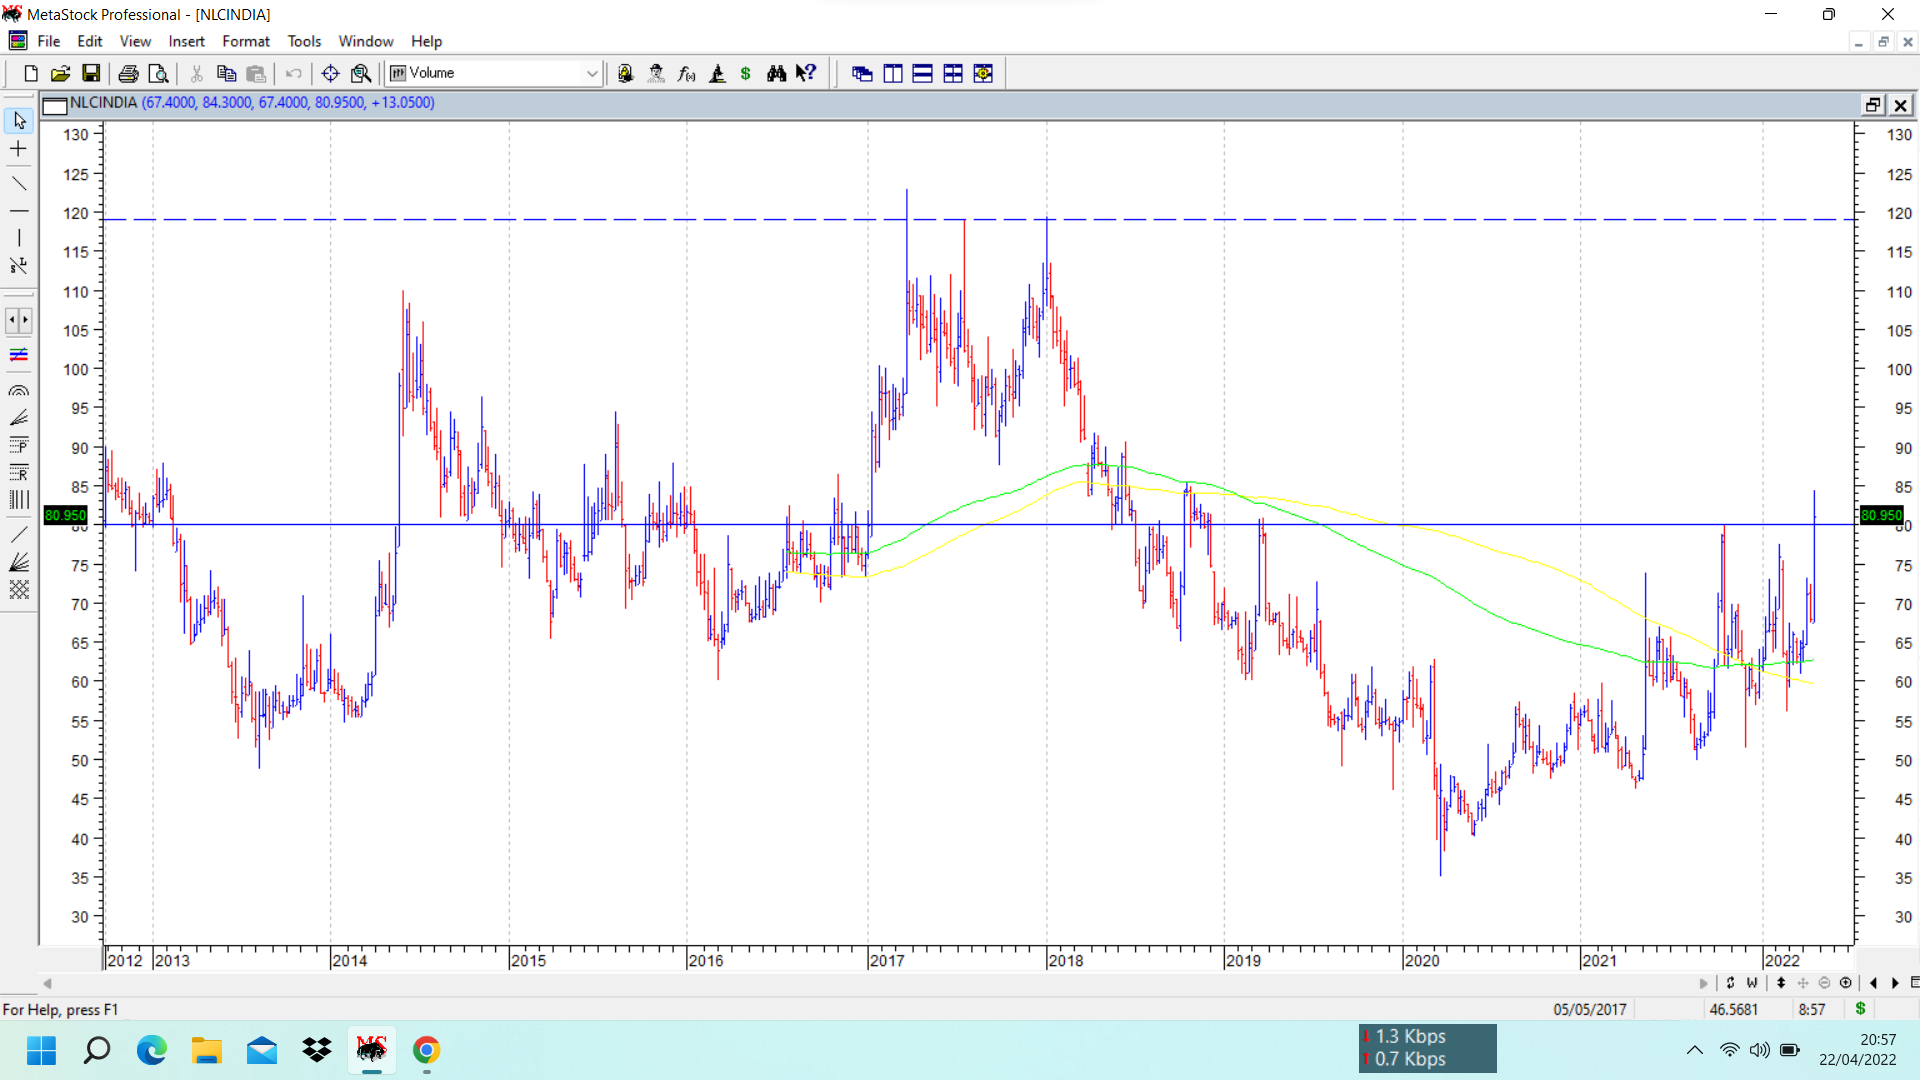
NLC chart update. Few posts back chart of NLC was posted where the main observation was price compression over past 4 quarters, where stock price closed in and around 60-62 each of the past four quarters.
Now this week the stock price has taken off and closed above crucial resistance of 80, thus completing a rounding bottom/inverted head and shoulders pattern breakout with big volumes… Next techincal target if pattern plays out is 120 again where there were major tops in the past. (disc: holding earlier position)
10 Likes
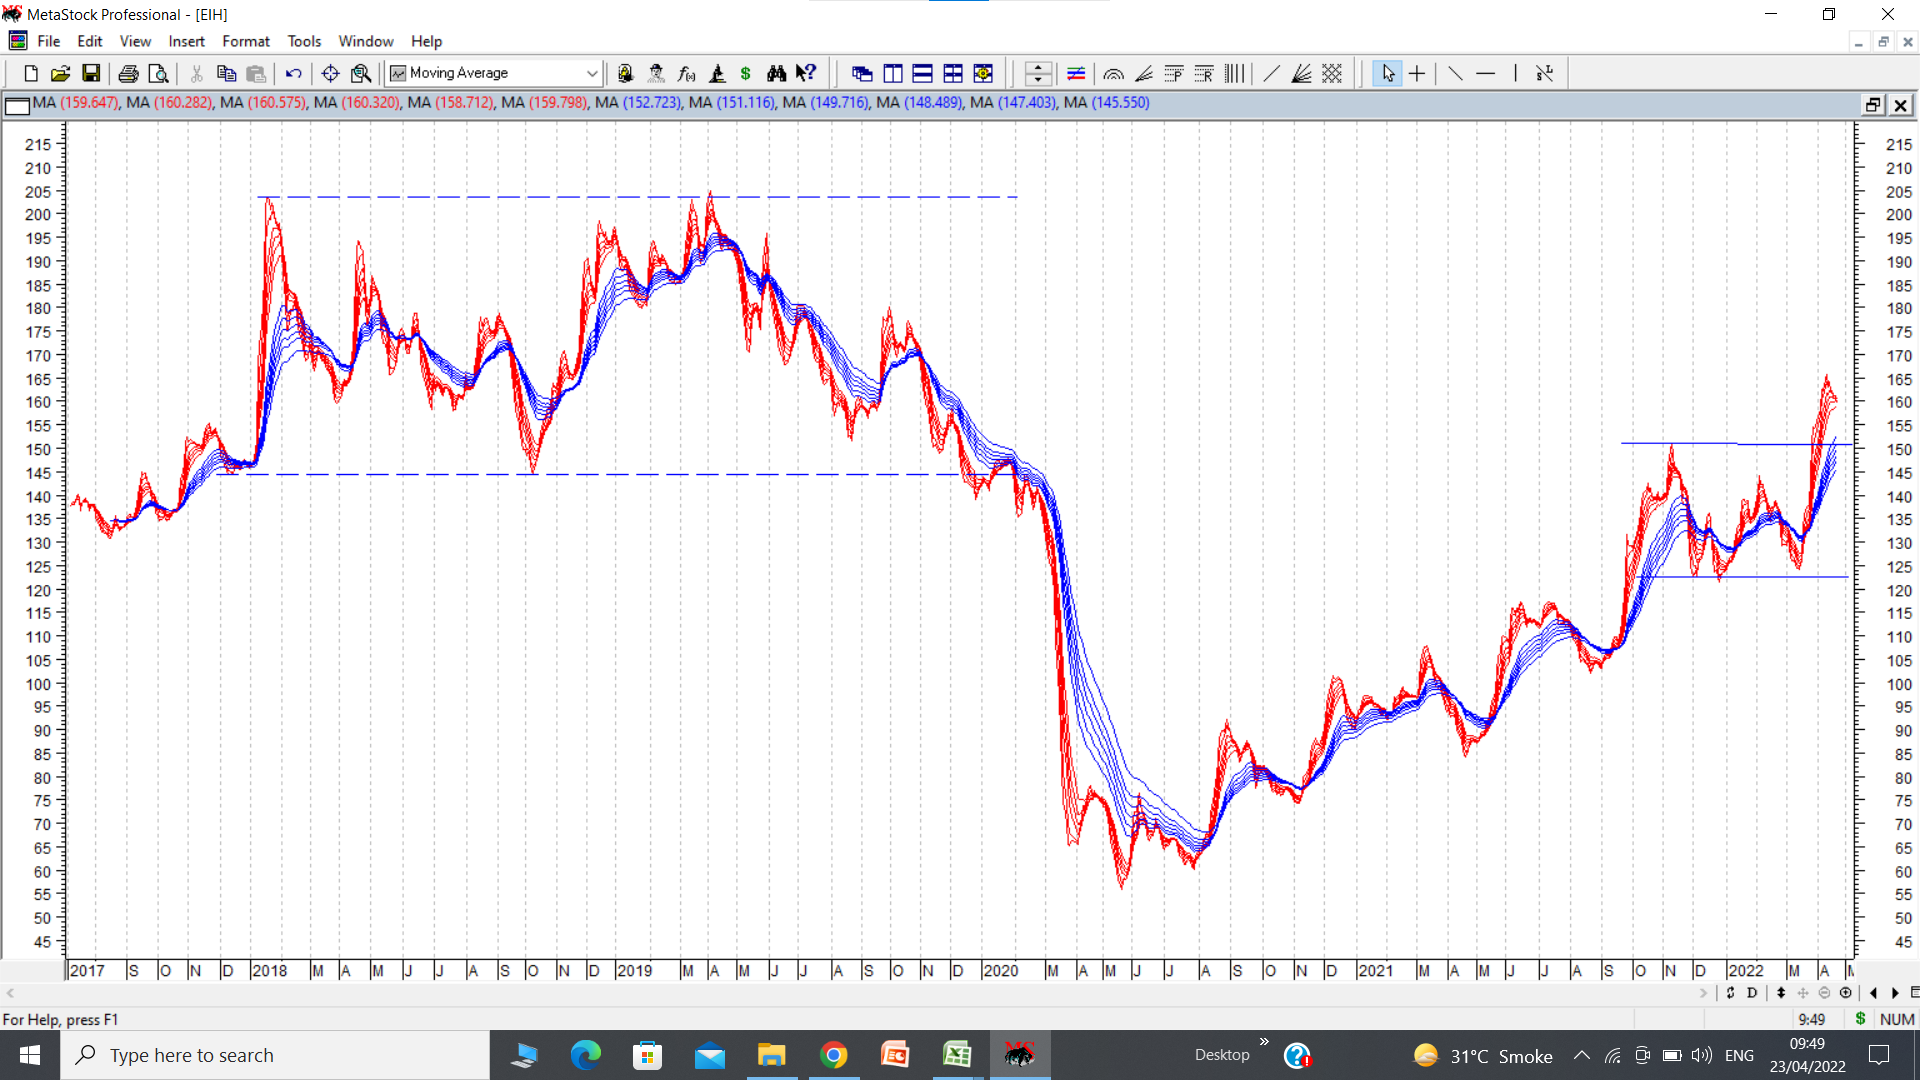
EIH Hotels chart was posted earlier in this thread. The GMMA daily chart shows interesting zones of distribution and accumulation. We can use this knowledge to our advantage going ahead if the cup and handle pattern mentioned in earlier post on the same company plays out.
On left side of chart I have marked the distribution zone between 146-203 in dotted lines. This zone took around 11 months before the stock price broke down due to Covid sell off. On right side of chart I have marked an accumulation zone (can also be considered the cup of the cup and handle pattern) between 125-150. Cup and handle pattern breakout in GMMA chart happened above 150. Bottom of cup was around 60. Adding the difference (150-60 = 90) to breakout zone of 150 the logical target can be 240. But since in the past we have had strong prolonged distribution happening between 146-203, stock price can experience some resistance within that zone.
Important point for medium to long term holders is to see if stock price crosses 203 (broadly zone of 200-215) . If that happens, because stock price would have overcome a major resistance zone, there could a very swift rally above that zone and one should be ready for a breakneck rally.
Something similar had happened in the past in chart of Tata Power. I think I mentioned also in the post that there was a crucial zone of resistance between 120-145. And we saw that once stock price broke past this zone, there was a very fast one way rally to 265 kind of levels.
We need to learn from these past observations and try to draw inferences for future reference. Fundamentally speaking getting hotel reservations in decent properties for summer vacation is getting difficult. I had a chat with a travel and tour operator friend of mine and according to him, the rush this time is nearly one and half times what was seen in pre Covid vacations. Another factor is that during tough times, (as in Covid for hotels) in order to survive, companies learn to become lean and fit and cost cutting and efficiencies come to the fore. And after all these things are in place, if business momentum returns, profits tend to show huge growth as compared to sales growth.
On charts also all throughout the past few weeks when markets have been dicey and on the edge, the hotels (and some other “unlock” trades ) segment has shown strong resilience, holding on to key supports and giving bounces from these levels, once markets have stabilised. The only caveat here is to watch out for a new Covid wave developing in the country which can gum up things for the sector.
28 Likes