Interesting Development on the Neuland Weekly Chart.
~Potential Pin Bar Candle information along with dried up selling volume ( waiting for the closing candle )
~TF > 1 year
*Please share your views sir
Interesting Development on the Neuland Weekly Chart.
~Potential Pin Bar Candle information along with dried up selling volume ( waiting for the closing candle )
~TF > 1 year
*Please share your views sir
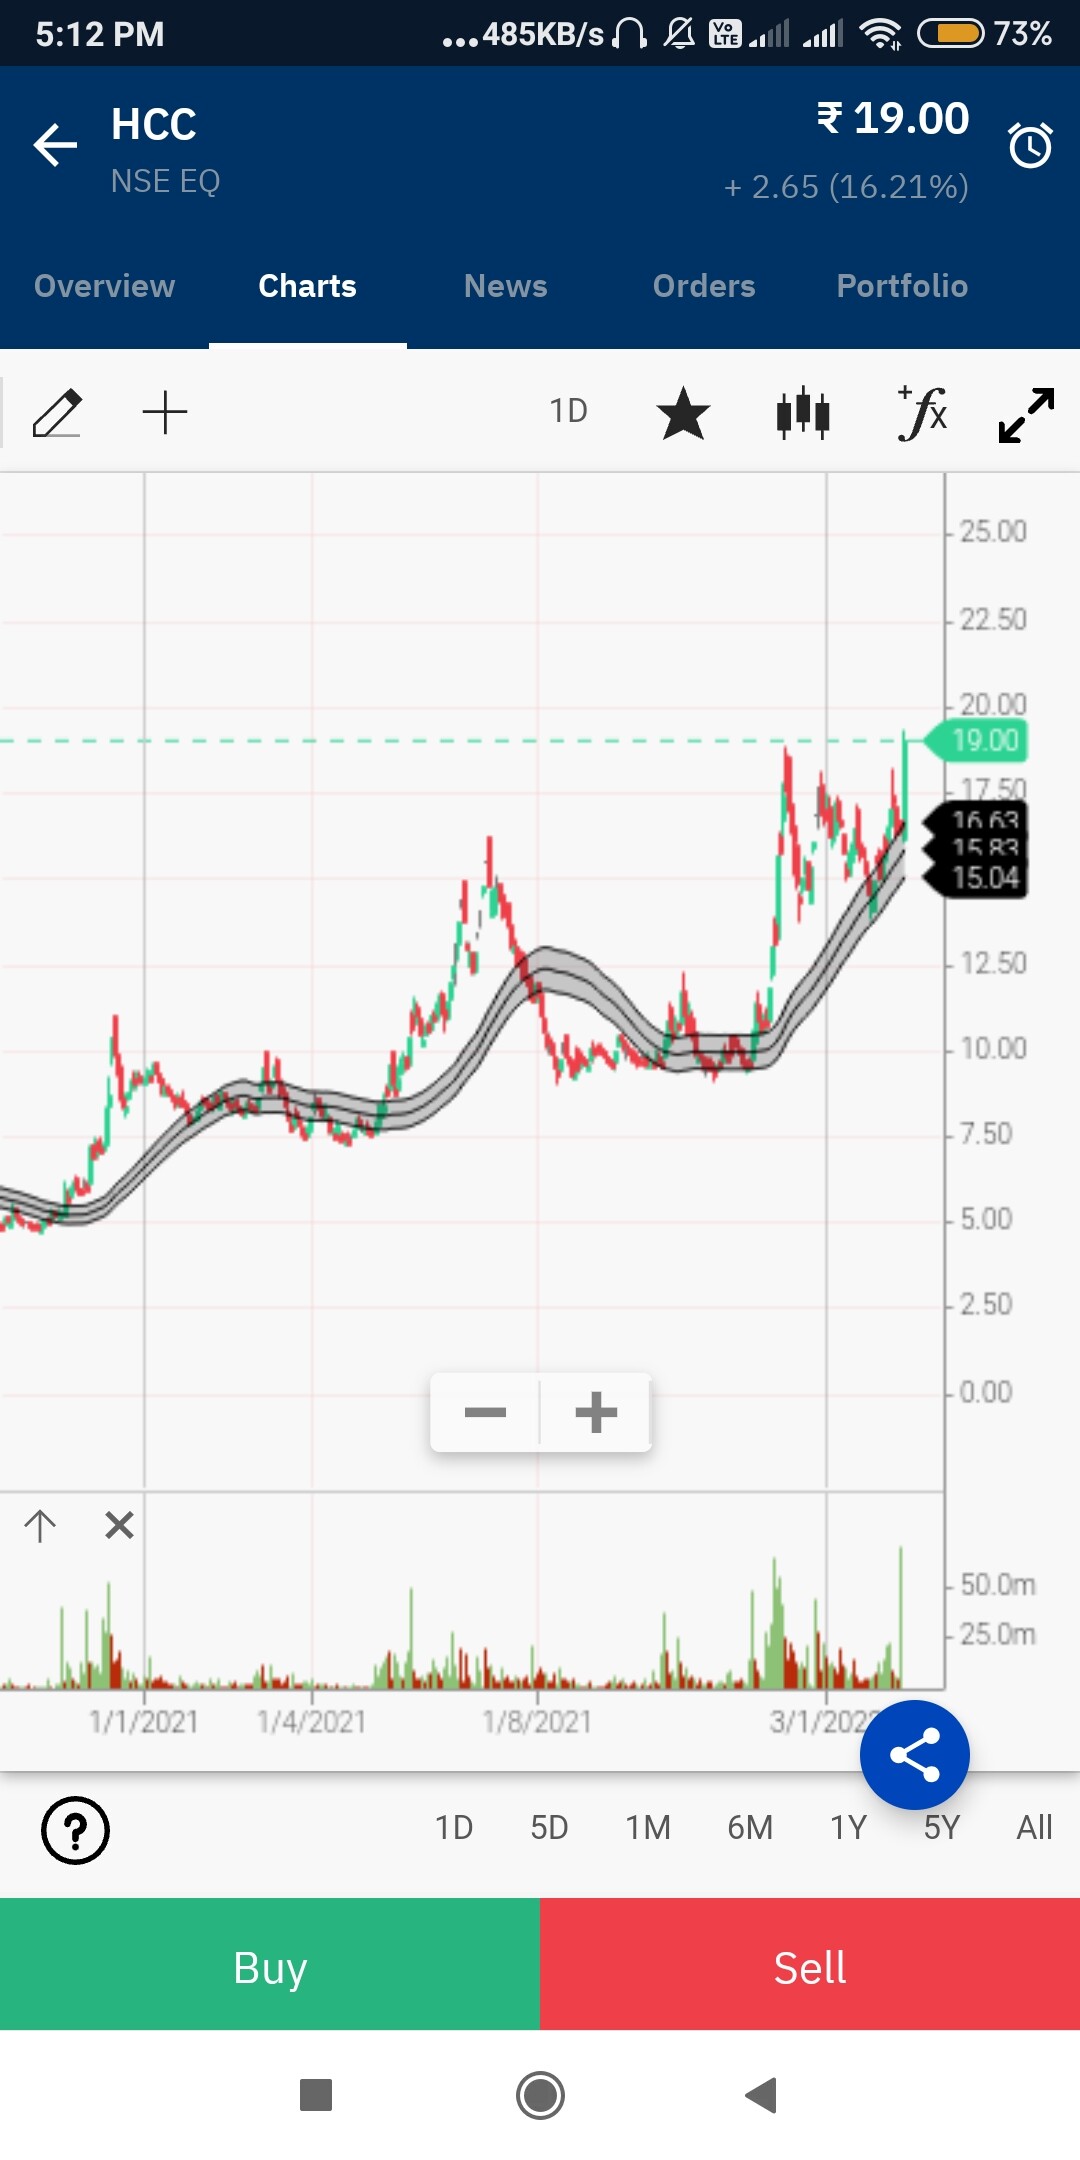
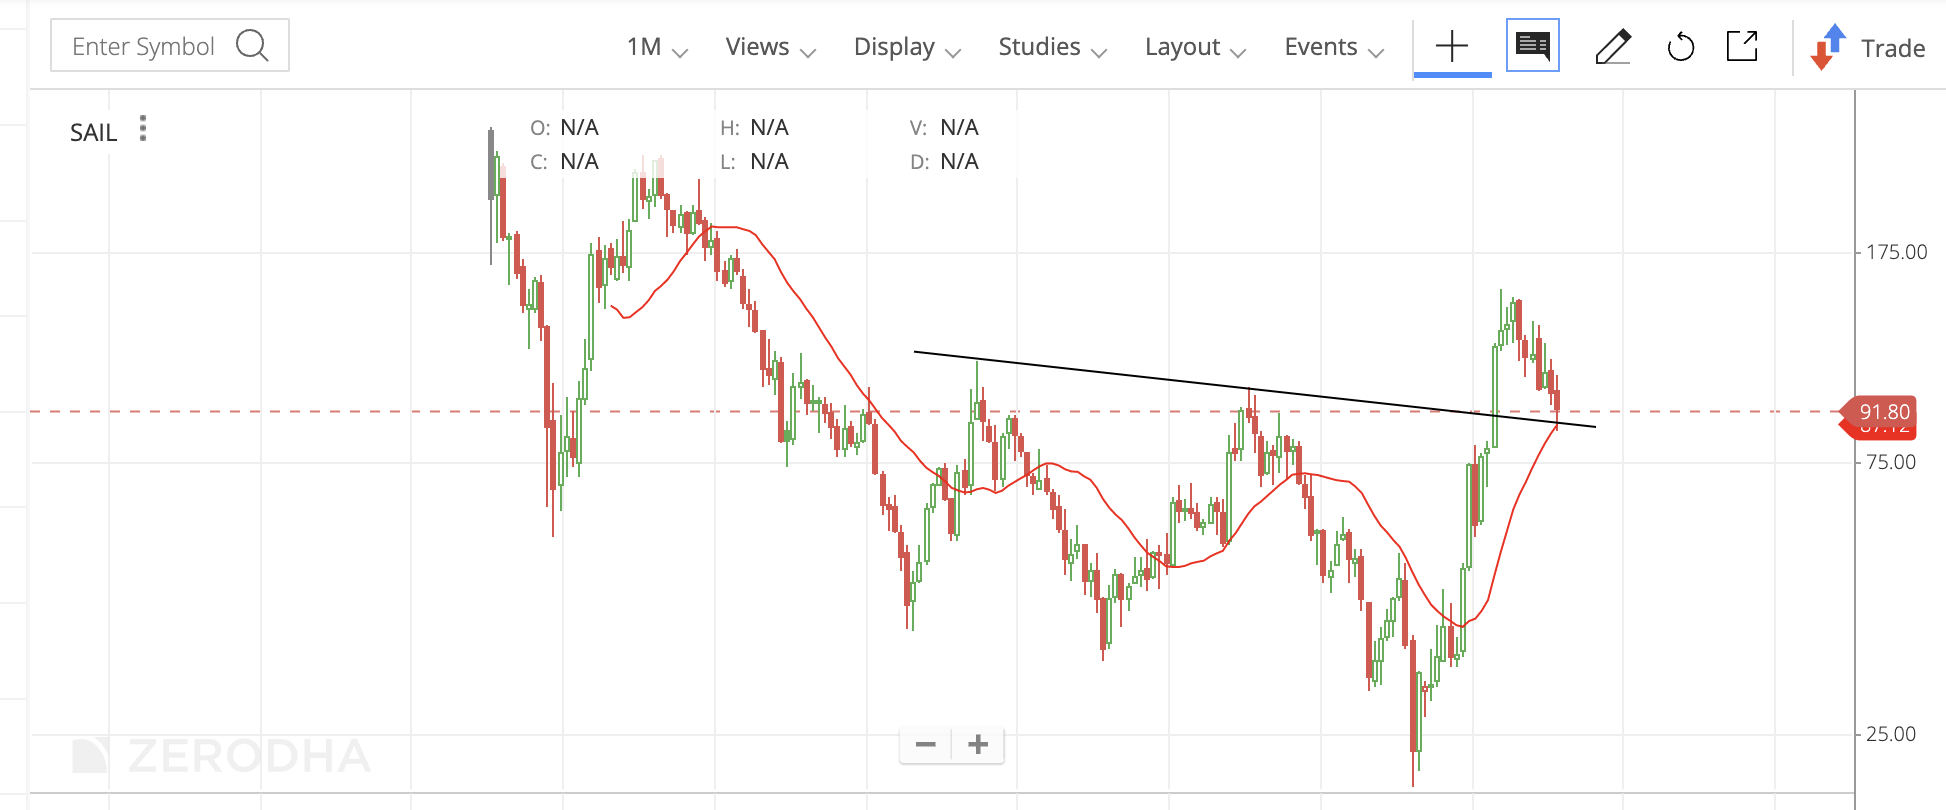
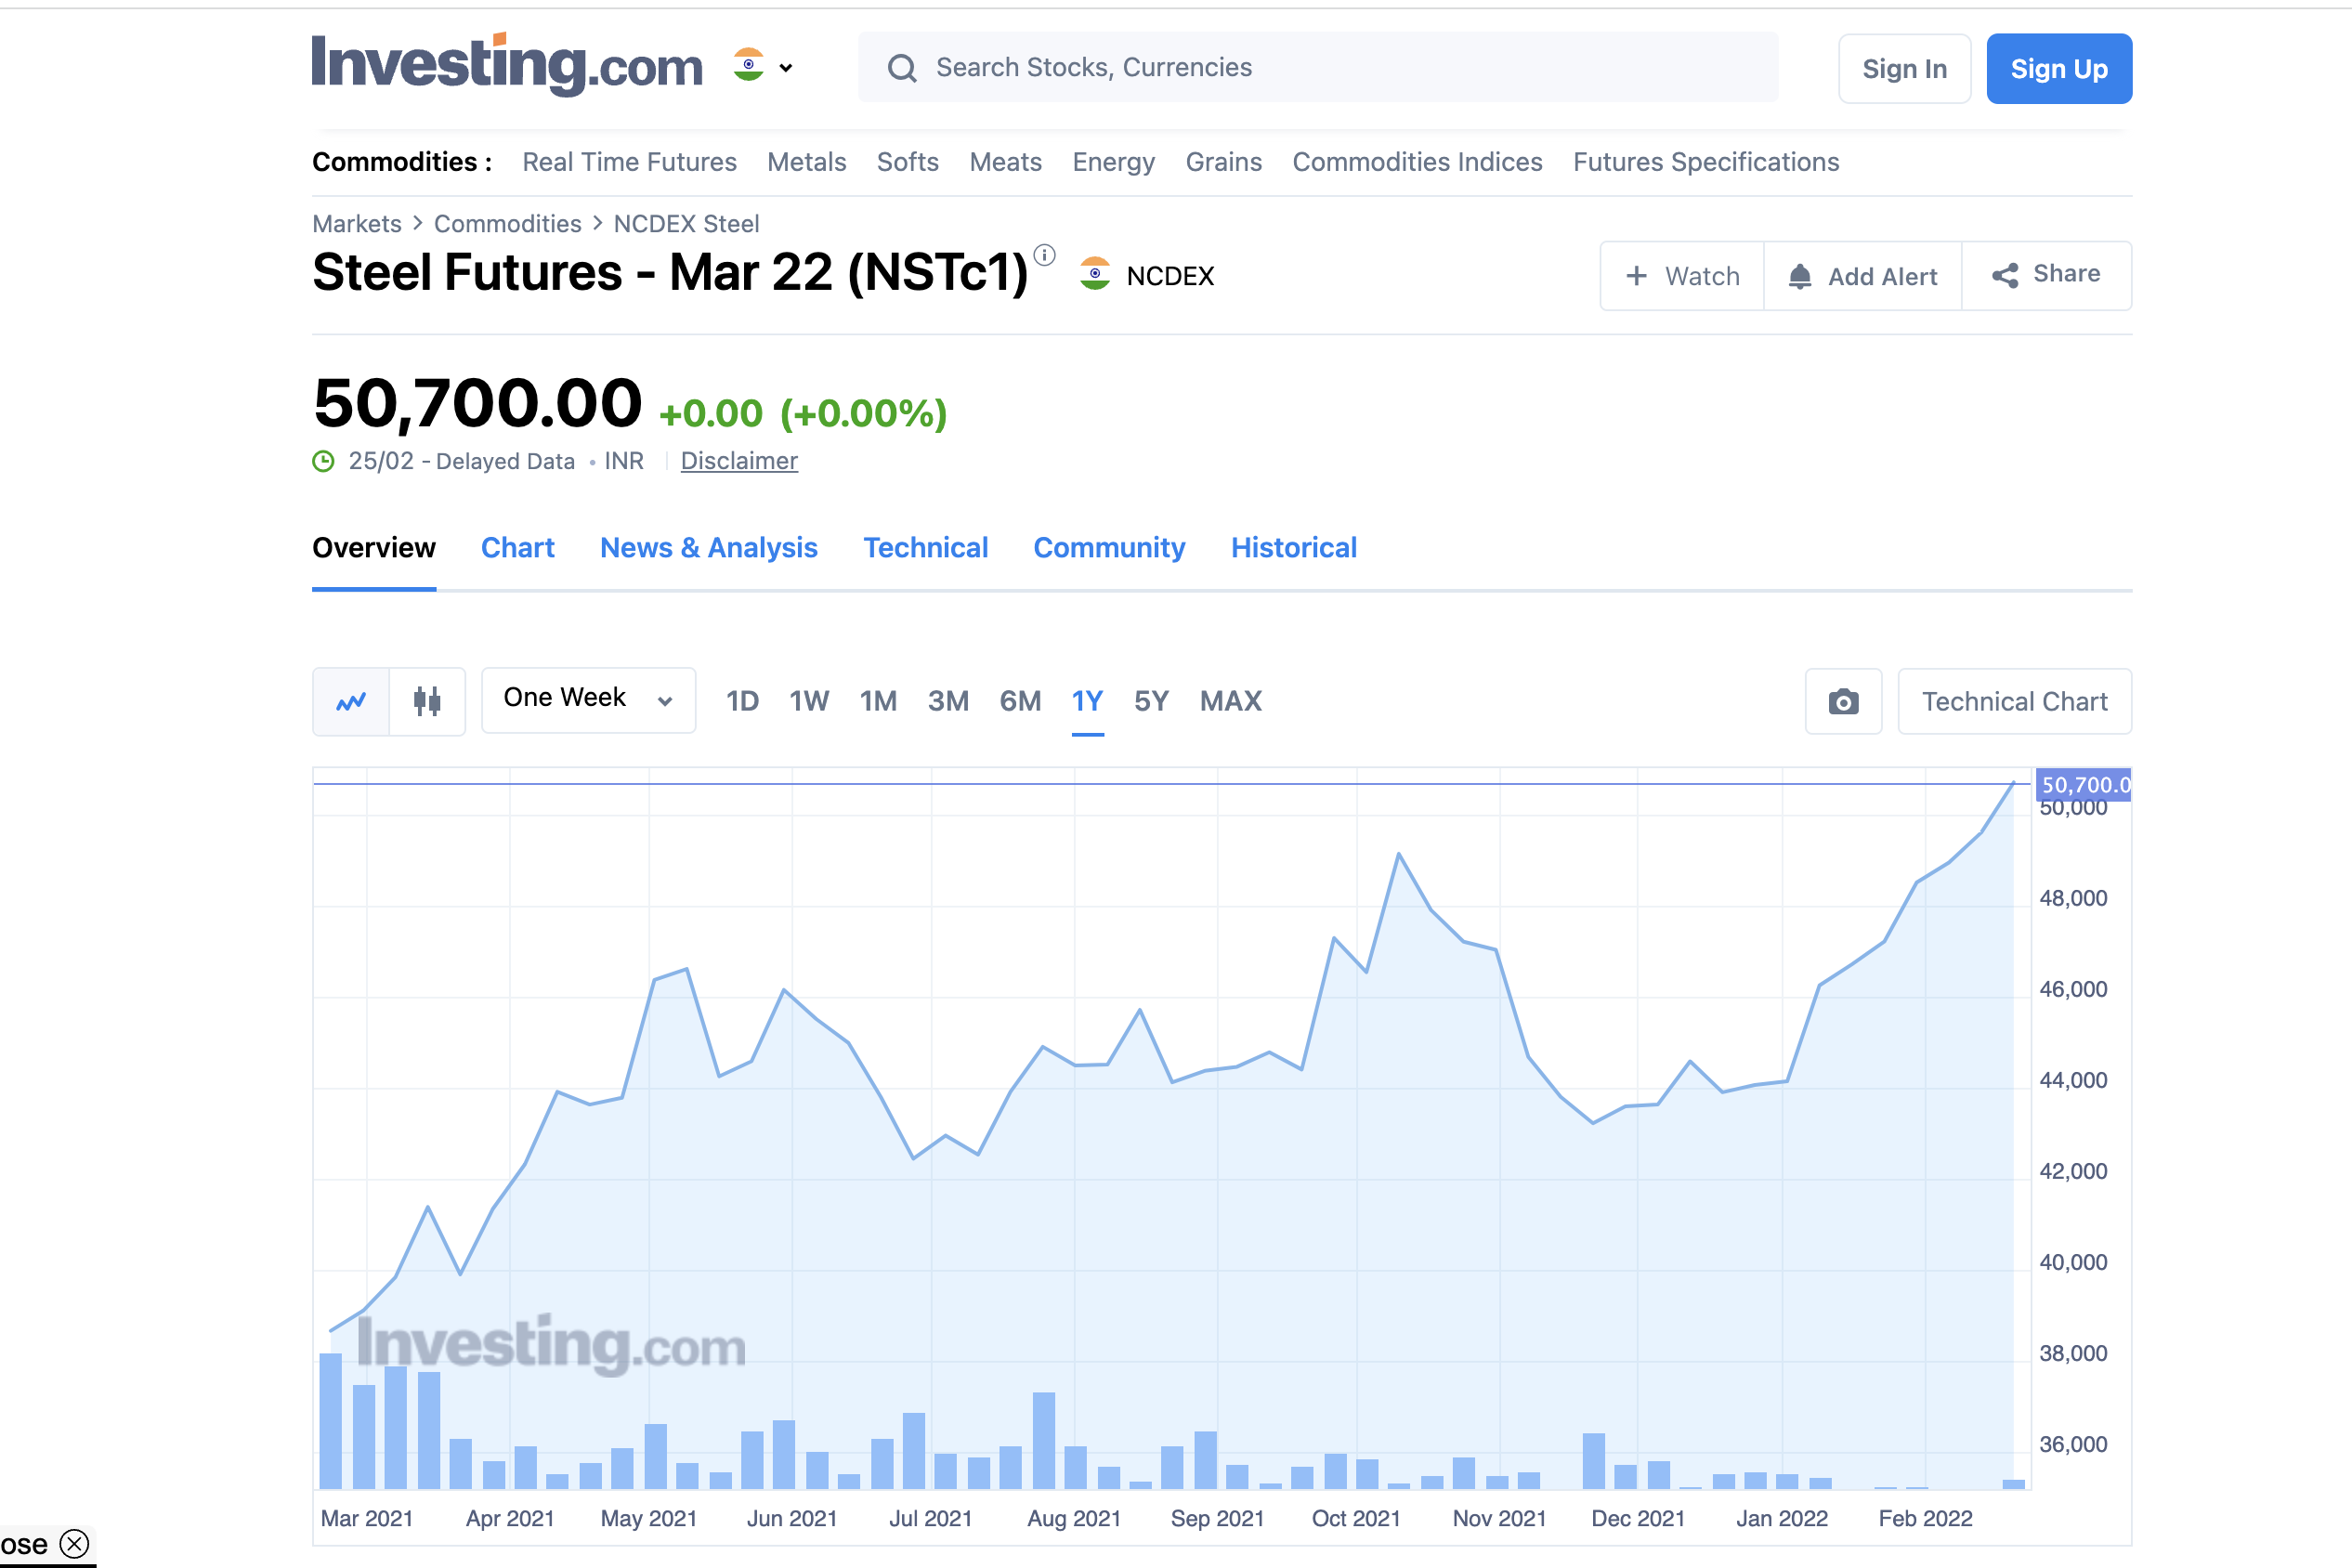
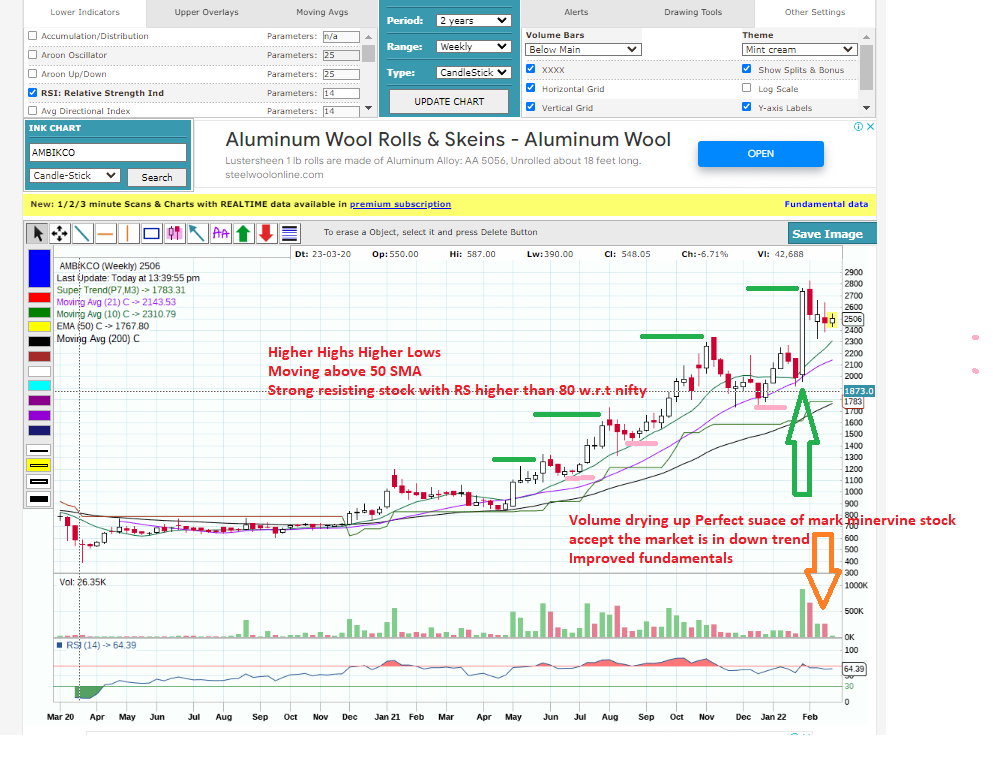
Broke out of resistance at around 18 closing at 52 week and 3year High with high volumes. Company’s debt is getting restructured and is generating a profit now. Company is set to benefit from the government’s massive infra spending . Company is known to have completed difficult construction projects like
Bandra-Worli Sea Link -Mumbai,Bogibeel Bridge-Assam etc and has built plants that account for more than 60% of India’s Nuclear Power Capacity . It has a healthy order book but it has not increased in Q3 '21 . Company also recently divested Baharampore-Farakka Highways Ltd (BFHL) at an enterprise value of Rs 1,279 crore . This sale will add further liquidity to the company . Overall looks like a cheap bet in the infra space .
Disc: Invested , This is not recommendation to buy or sell do your own research before investing.
Acrysil chart had been put up earlier to indicate a small head and shoulders pattern breakdown. On line chart, the target was 700 and on GMMA chart indicated target was 728. Here I am putting a candlestick chart to update the chart. The interesting thing here is that the stock price went down and tested the 200 day moving average at 676 (marked in solid green line) and formed a hammer on 15 Feb 2022. Since then it has tried to take support near about the 700 zone.
Dotted lines marked in blue and green show a confluence of two important parameters. Blue dotted line at 695 shows level of previous major top in August 2021. Dotted green line at same level shows a 38.2% retracement level to the previous major rally from 309 in May 2021 to an all time high of 927 in Dec 2021. At the low of 676 the stock corrected nearly 27% from its peak of 927.
The concall for q3 fy 22 sounded encouraging and company is likely to commission expanded capacities soon. If support at the zone of 680-700 holds, this could be an interesting entry point for medium to long term investors. disc: invested a starter position recently.
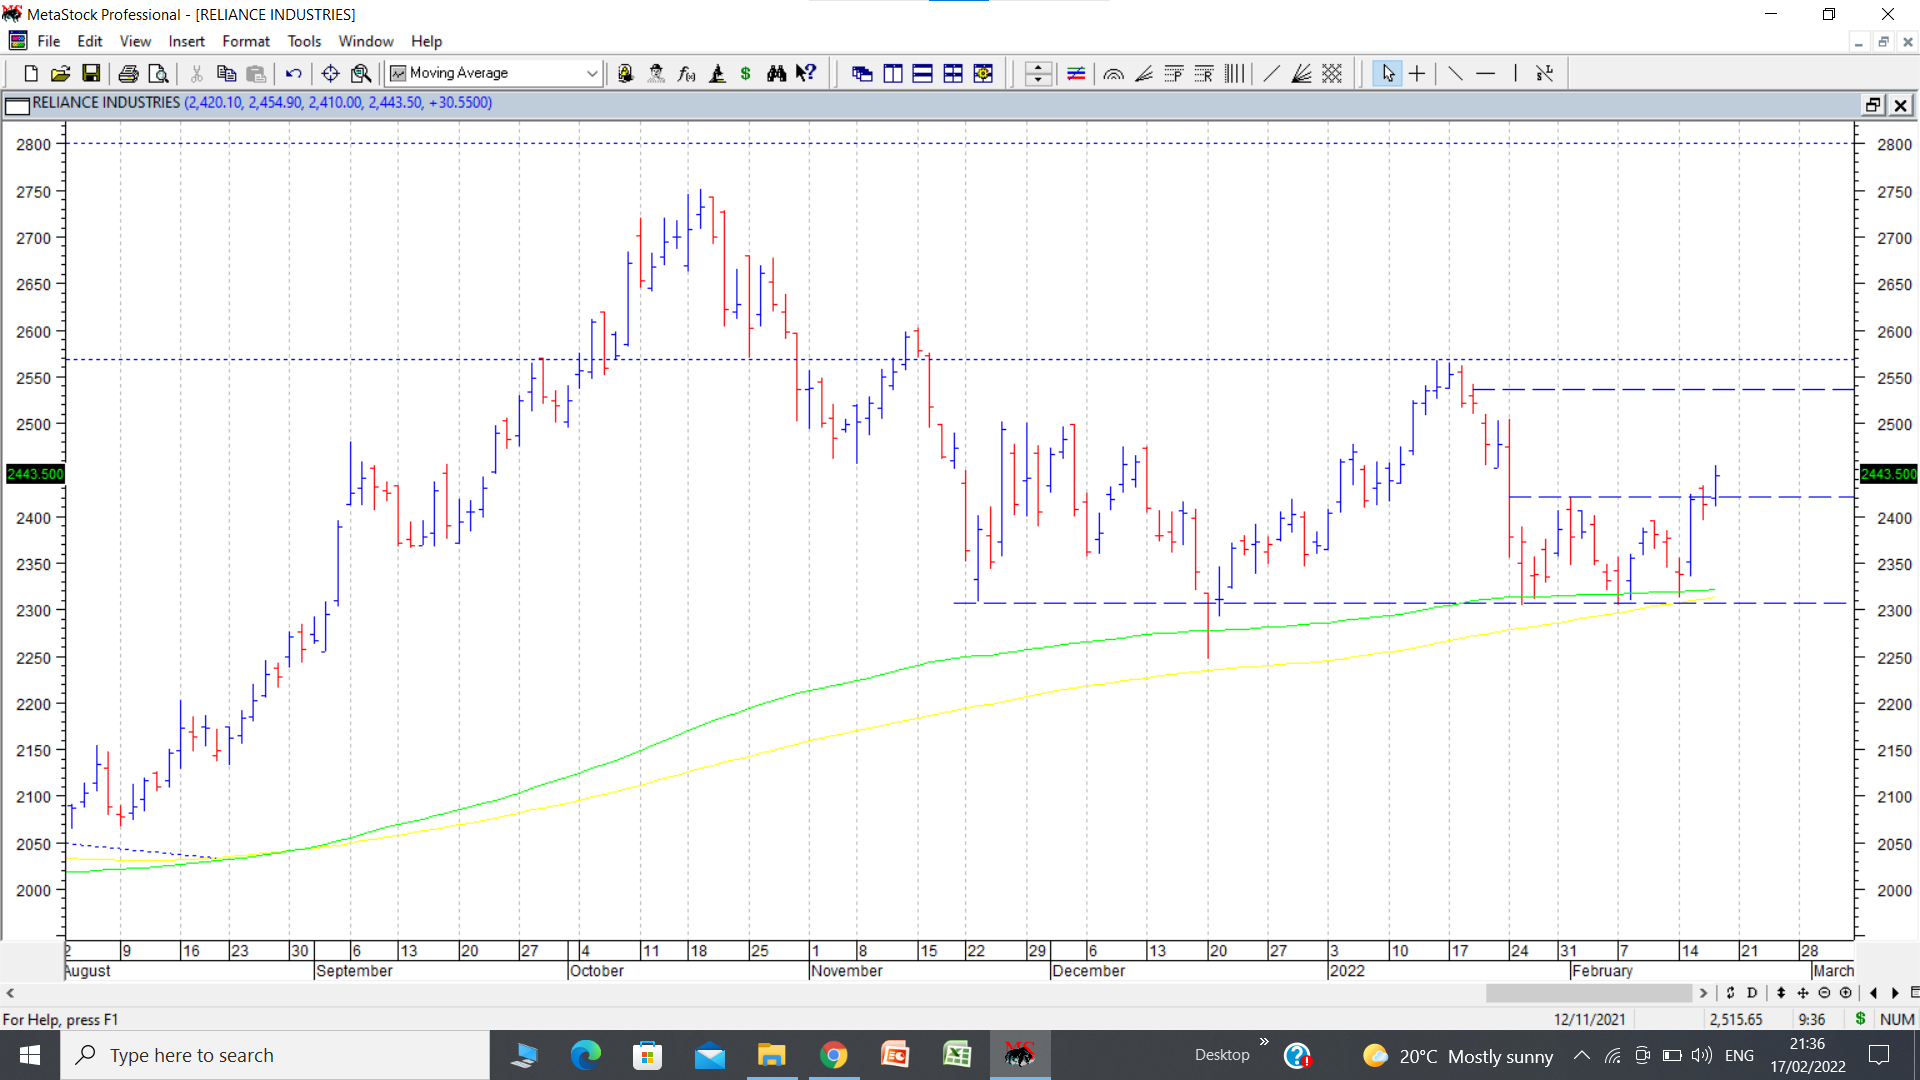
Update on Reliance chart posted earlier.
Stock price took support at around its 200 dema level close to 2310 in recent market correction. It recently gave a small double bottom breakout confirmation by breaking out above 2420.
On 25 Jan 2022, it had posted a low of 2305, went up to post a high of 2420 on 14 1 Feb 2022, and again went down and posted a low at 2305 on 7 feb 2022. This was a double bottom with an intervening peak at 2420. Today it closed at 2443, conclusively above 2420. Now immediate target can be 2535.
On a slighter longer time frame, stock price had taken support in 200 dema zone in Dec 21, (actual low of 2276) and had posted a swing high of 2567. Again recent low was 2305, quite close by to be called a double bottom. Here intervening peak is 2567 and if that is breached, potential target could be 2800 plus.
So we have two double bottom patterns on charts, with bottoms in both instances at around 2300, and tops at 2420 and 2567 and the successful breakout targets can be calculated accordingly. One might even notice that there was a triple bottom at around 2300 zone.
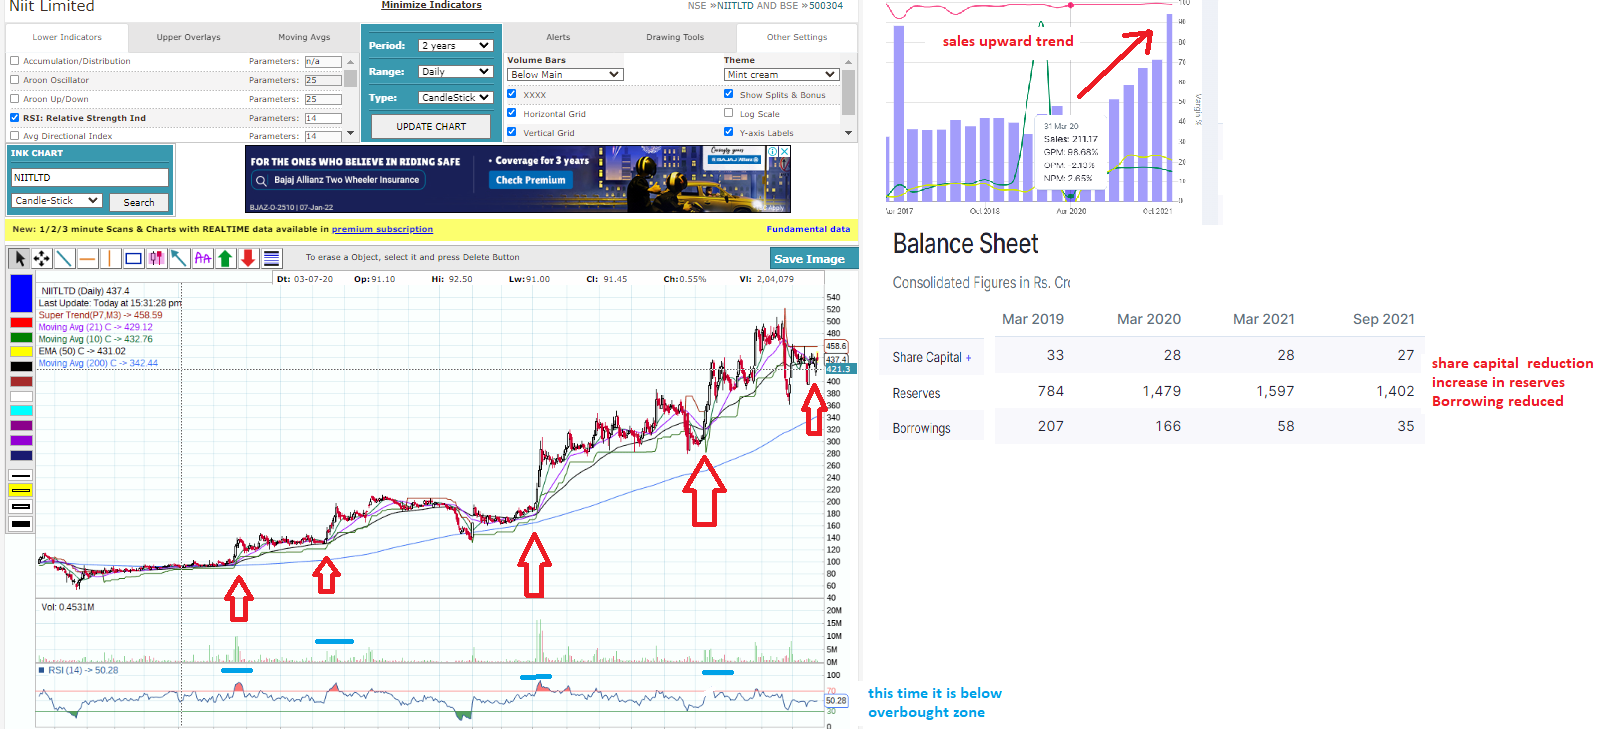
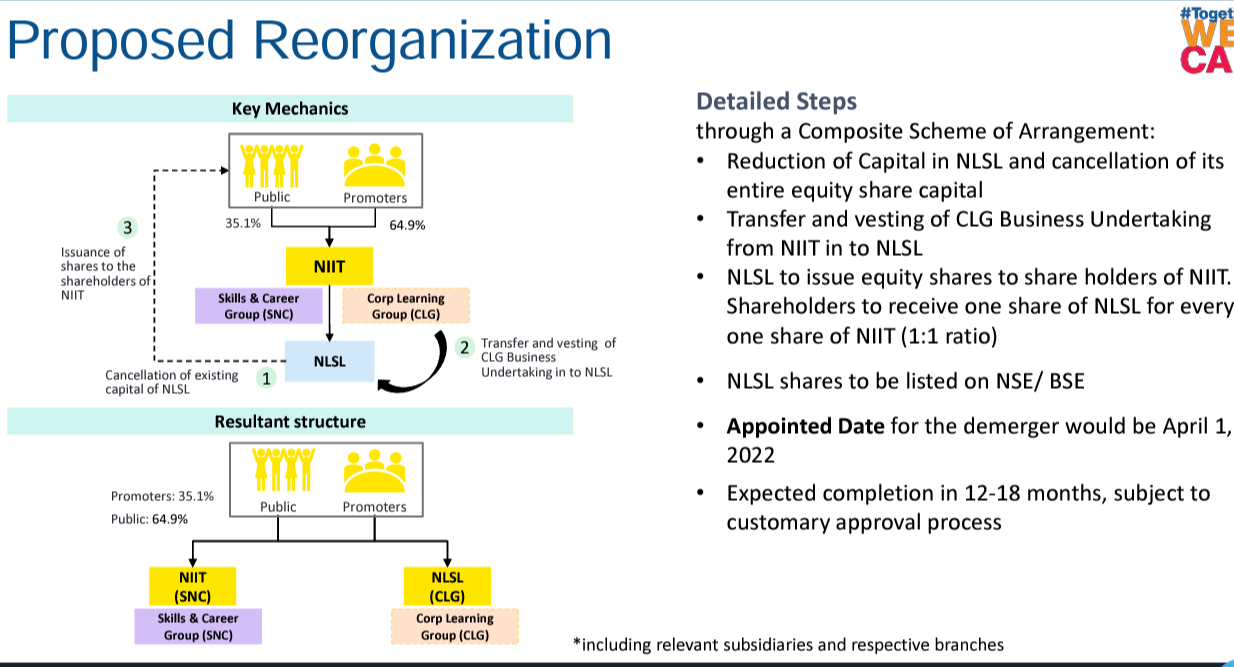
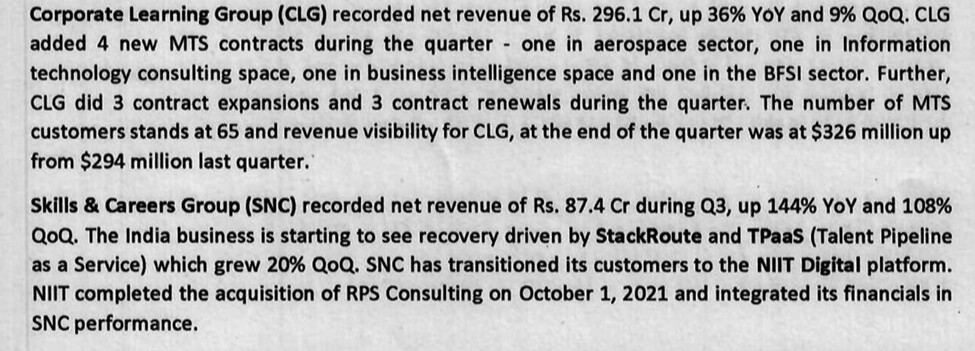
NIIT can couple with techno fundamental advantages
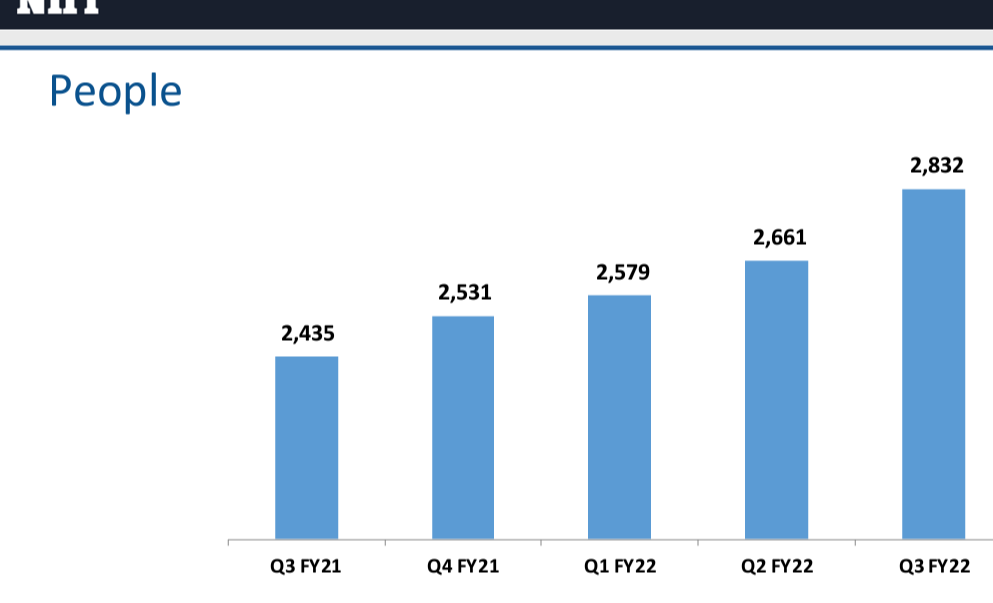
Growing Employees
Market cap of < 40k cr for 20 MTPA capacity at full utilization
Disc: Invested as techno-funda bet
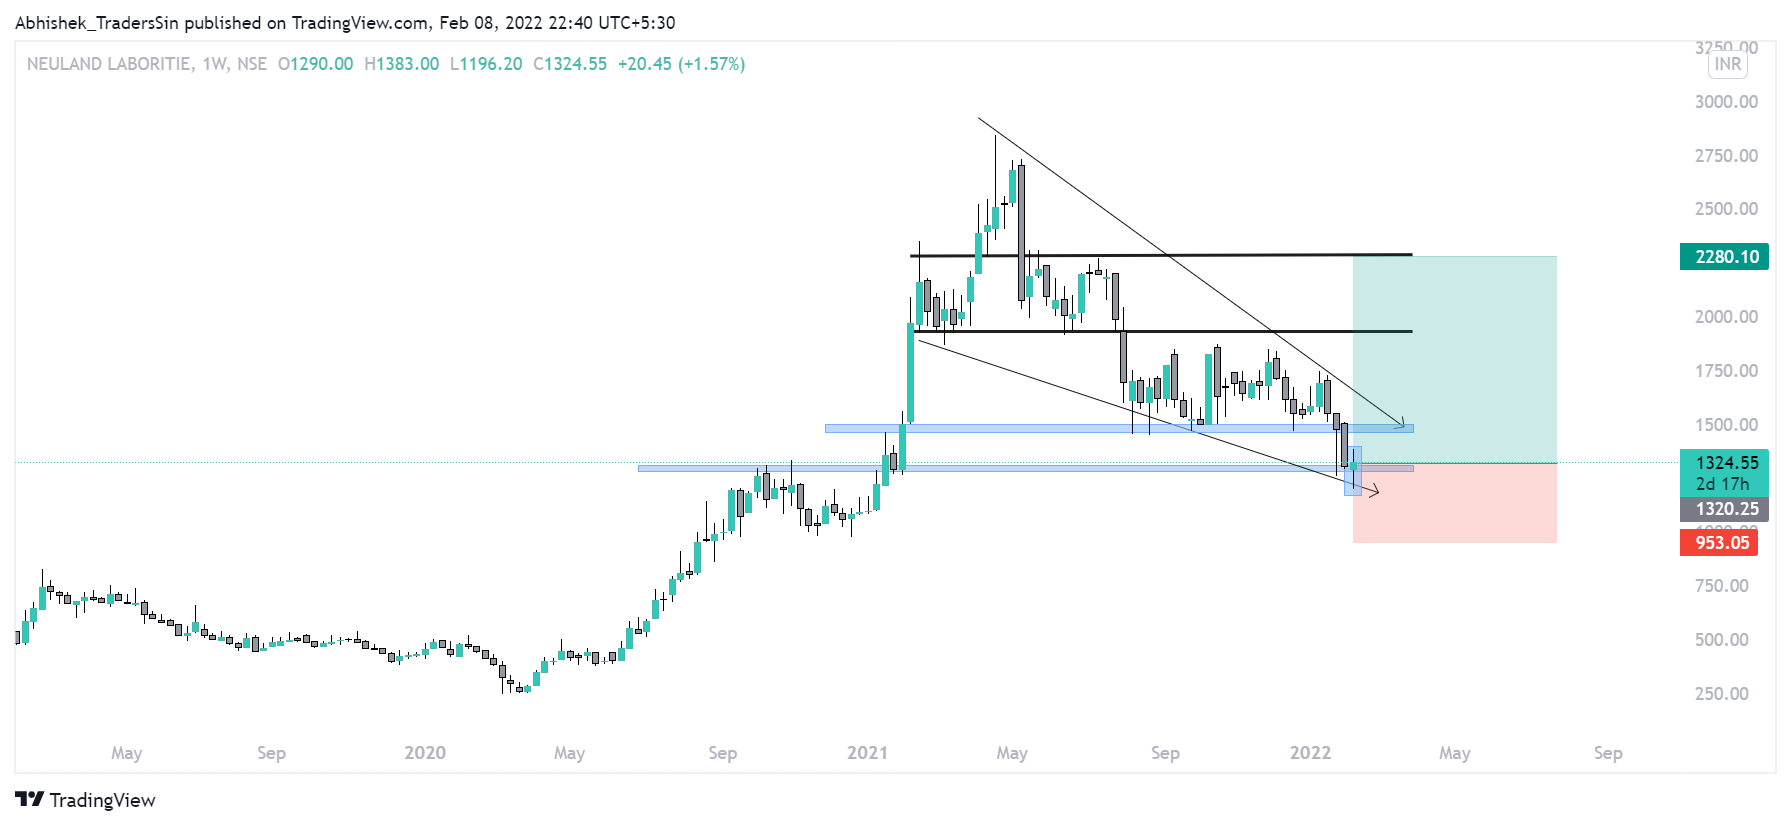
Neuland is a chart that has been fascinating for me because of the perfect way in which classical technical patterns have played out in the stock. We had considered the chart earlier when it broke down below its bearish head and shoulders pattern. And this was followed by a bearish flag which took a while to develop and then stock price broke down below that as well and the stock price took a real hammering to post a low of 1026.
Now coming to the stuff which seems interesting at current juncture. The stock price spend nearly 4 months in consolidation between 970 to 1310. It also formed a sort of double bottom at 980 and broke out from that above 1198 and took off to post highs of 2350 and 2840 in quick time.
Now stock price has come down between the consolidation zone mentioned above and seems to have found some support at 1026 and the zone around it. It seems to be showing some strength in a weak market of late. Now I would like to watch how it behaves at current levels and look out for signs of consolidation. Even now the 200 dema is around 1600 and its pointing down. So no hurry to buy, but worth keeping in watchlist.
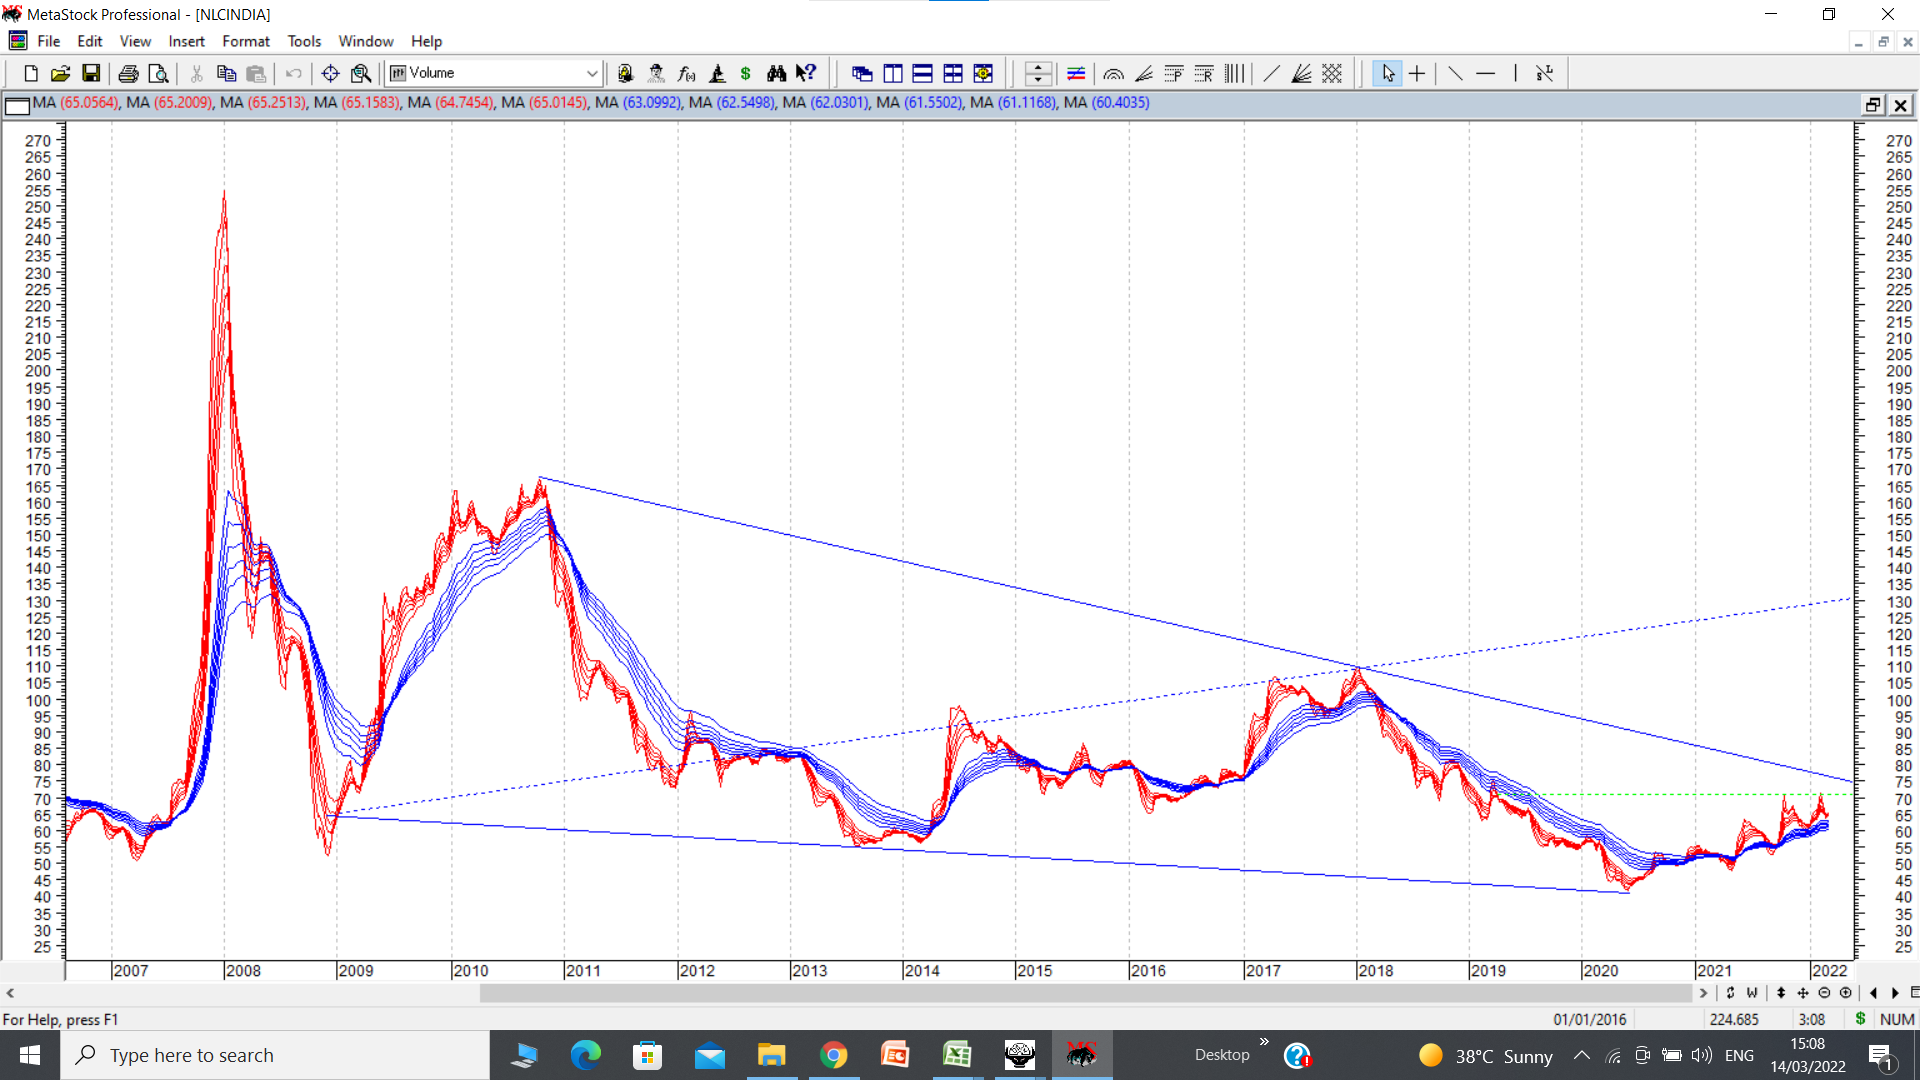
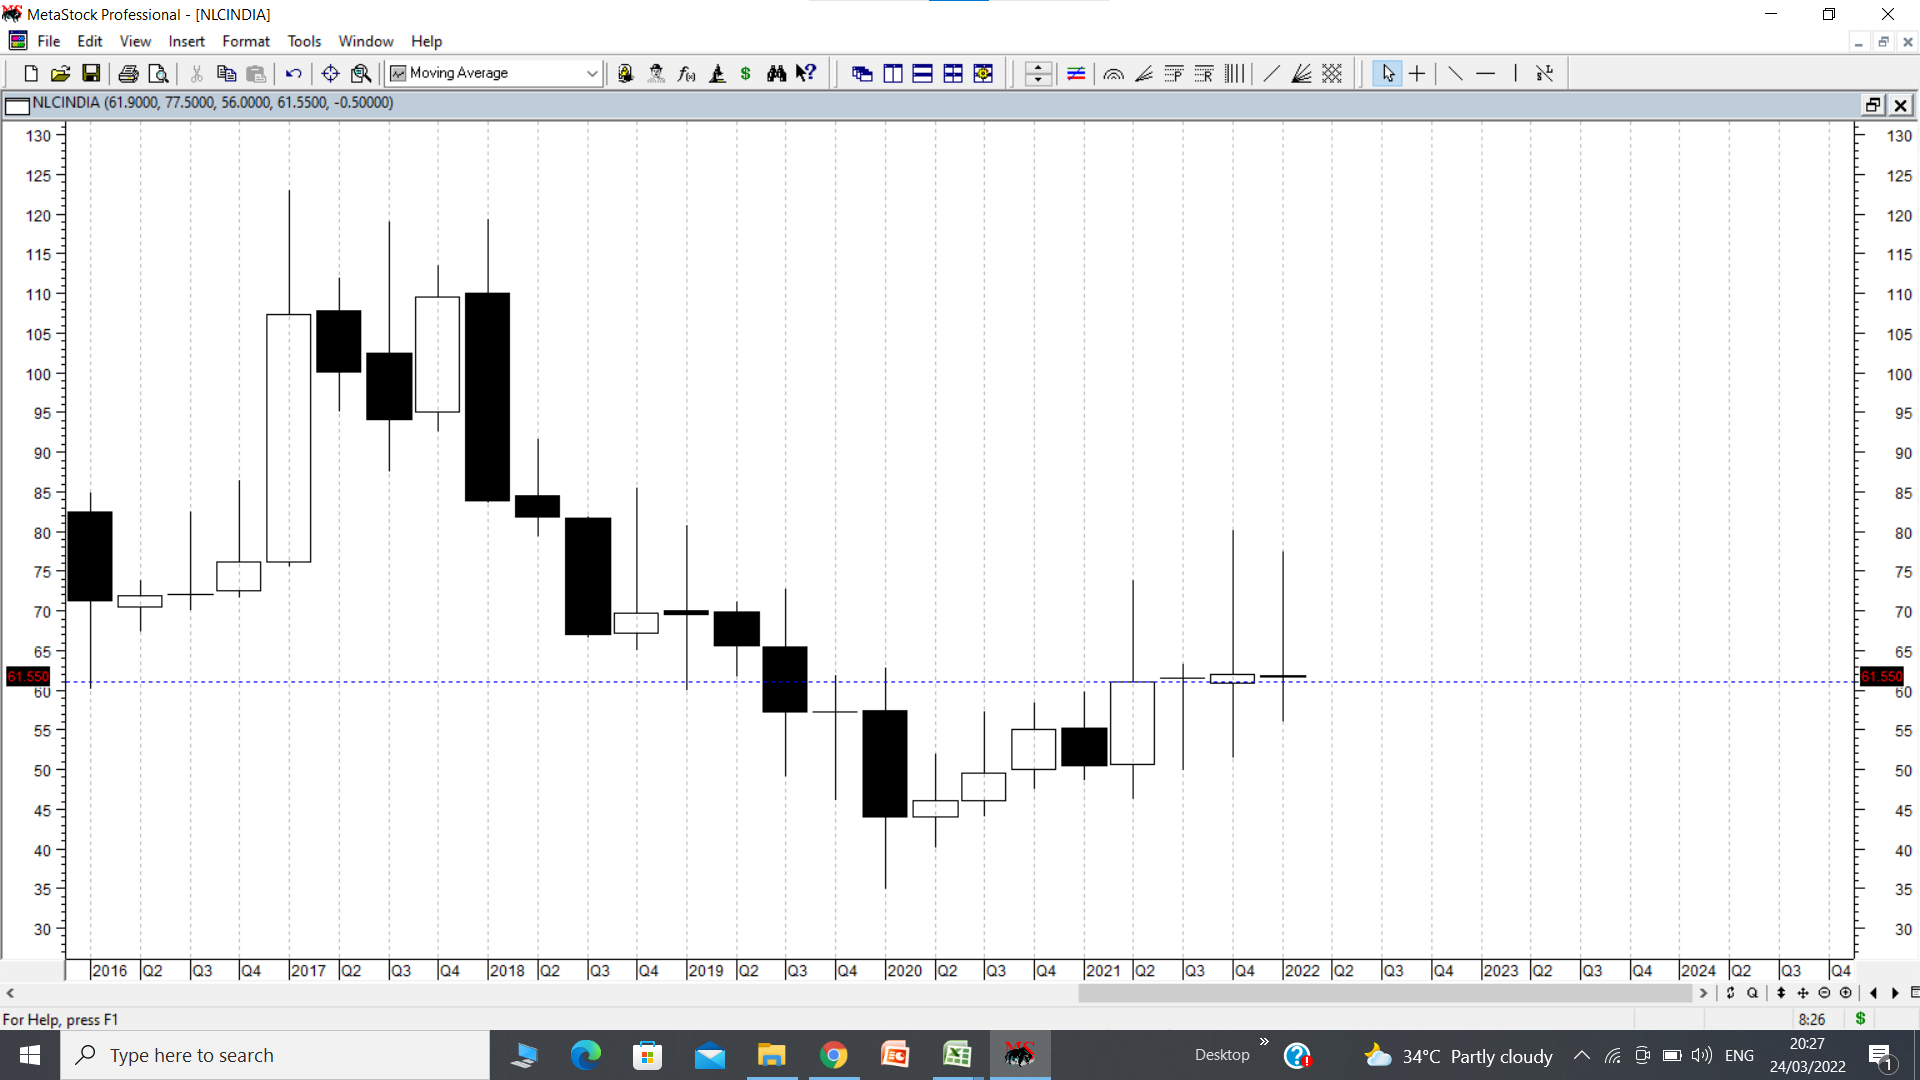
NLC India. Neyveli lignite corp. It is engaged in the mining of lignite and generation of power using lignite and renewable sources. More details can be read from screener, where a lot of relevant details are provided. The charts of NLC India presents an interesting picture.
On weekly charts, it is showing a rounding bottom formation with consistently higher bottoms. cmp around 64-65. Crossing and sustaining above 70 on a weekly basis would confirm a breakout from a double top on weekly GMMA chart and provide targets of 100 plus.
On Wolfe Wave chart if pattern is successful, target can in the range of 130.
Fundamentally with all commodities and coal and the whole lot going up like crazy, lignite also should not be far behind in price rise. Plus its a PSU company which ensures heavy dividend payout ratio.
disc: bought as a trading techno funda bet. (this is not an investment advice and is only for educational purpose.
ISLAND GAP REVERSAL PATTERN.
Nifty today gapped up above yesterday’s high . Part of this gap area was within the falling gap nifty made when it went down.
To better explain this event, I have drawn two red dotted lines to show gap down region and two green dotted lines to show gap up region. When island reversal happens after fall it indicates a change in trend. (May not always be so, but probabilities are high). We now have two gap up days on the nifty since it recovered from recent lows. The area of gap ups are 16418-16447 and today’s gap up of 16987 to 17175. The actual island gap (gap common to both gap down and gap up) is from 16987 to 17027 and I would watch that specific area to see if in future that offers support.
What happens now?. There could be an attempt to fill the recent big gap up and maybe it is partially filled or fully filled according to the prevailing trend. We may have a few up days and then only Nifty weakens to come down to retest this gap up zone.
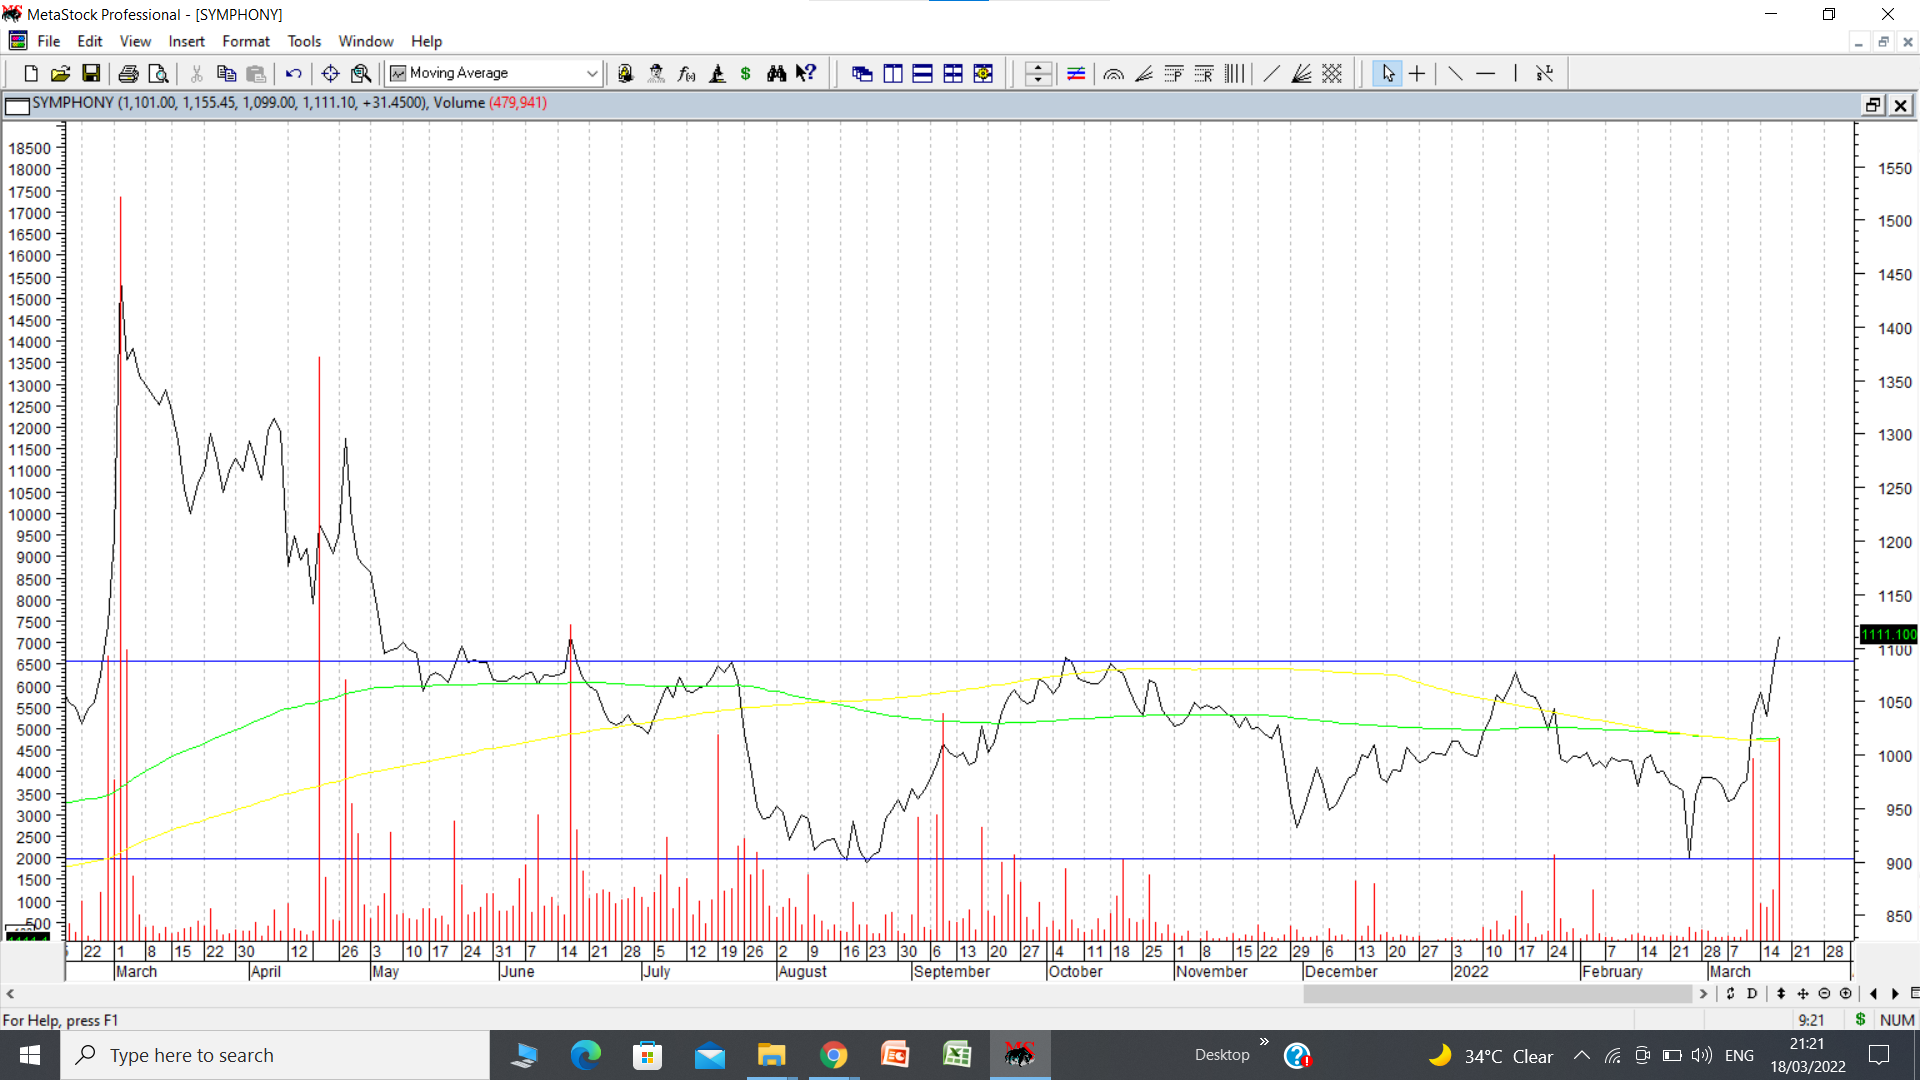
Symphony cmp 1111. An interesting chart pattern where stock price consolidated betwen 900 and 1090 for around 9 months and broke out above that with decent volumes this week. Note heavy volumes of more than 4 lac shares on two days this week. Since Friday candlestick was a doji (gravestone doji with open and close same, but stock price closing near lower point of the day) there could be some consolidation. Read in the newspaper a prediction from some agency that this summer is likely to be one of the more hotter summer in recent years. This too might act as a tailwind for Symphony.
disc: no position but in watchlist.
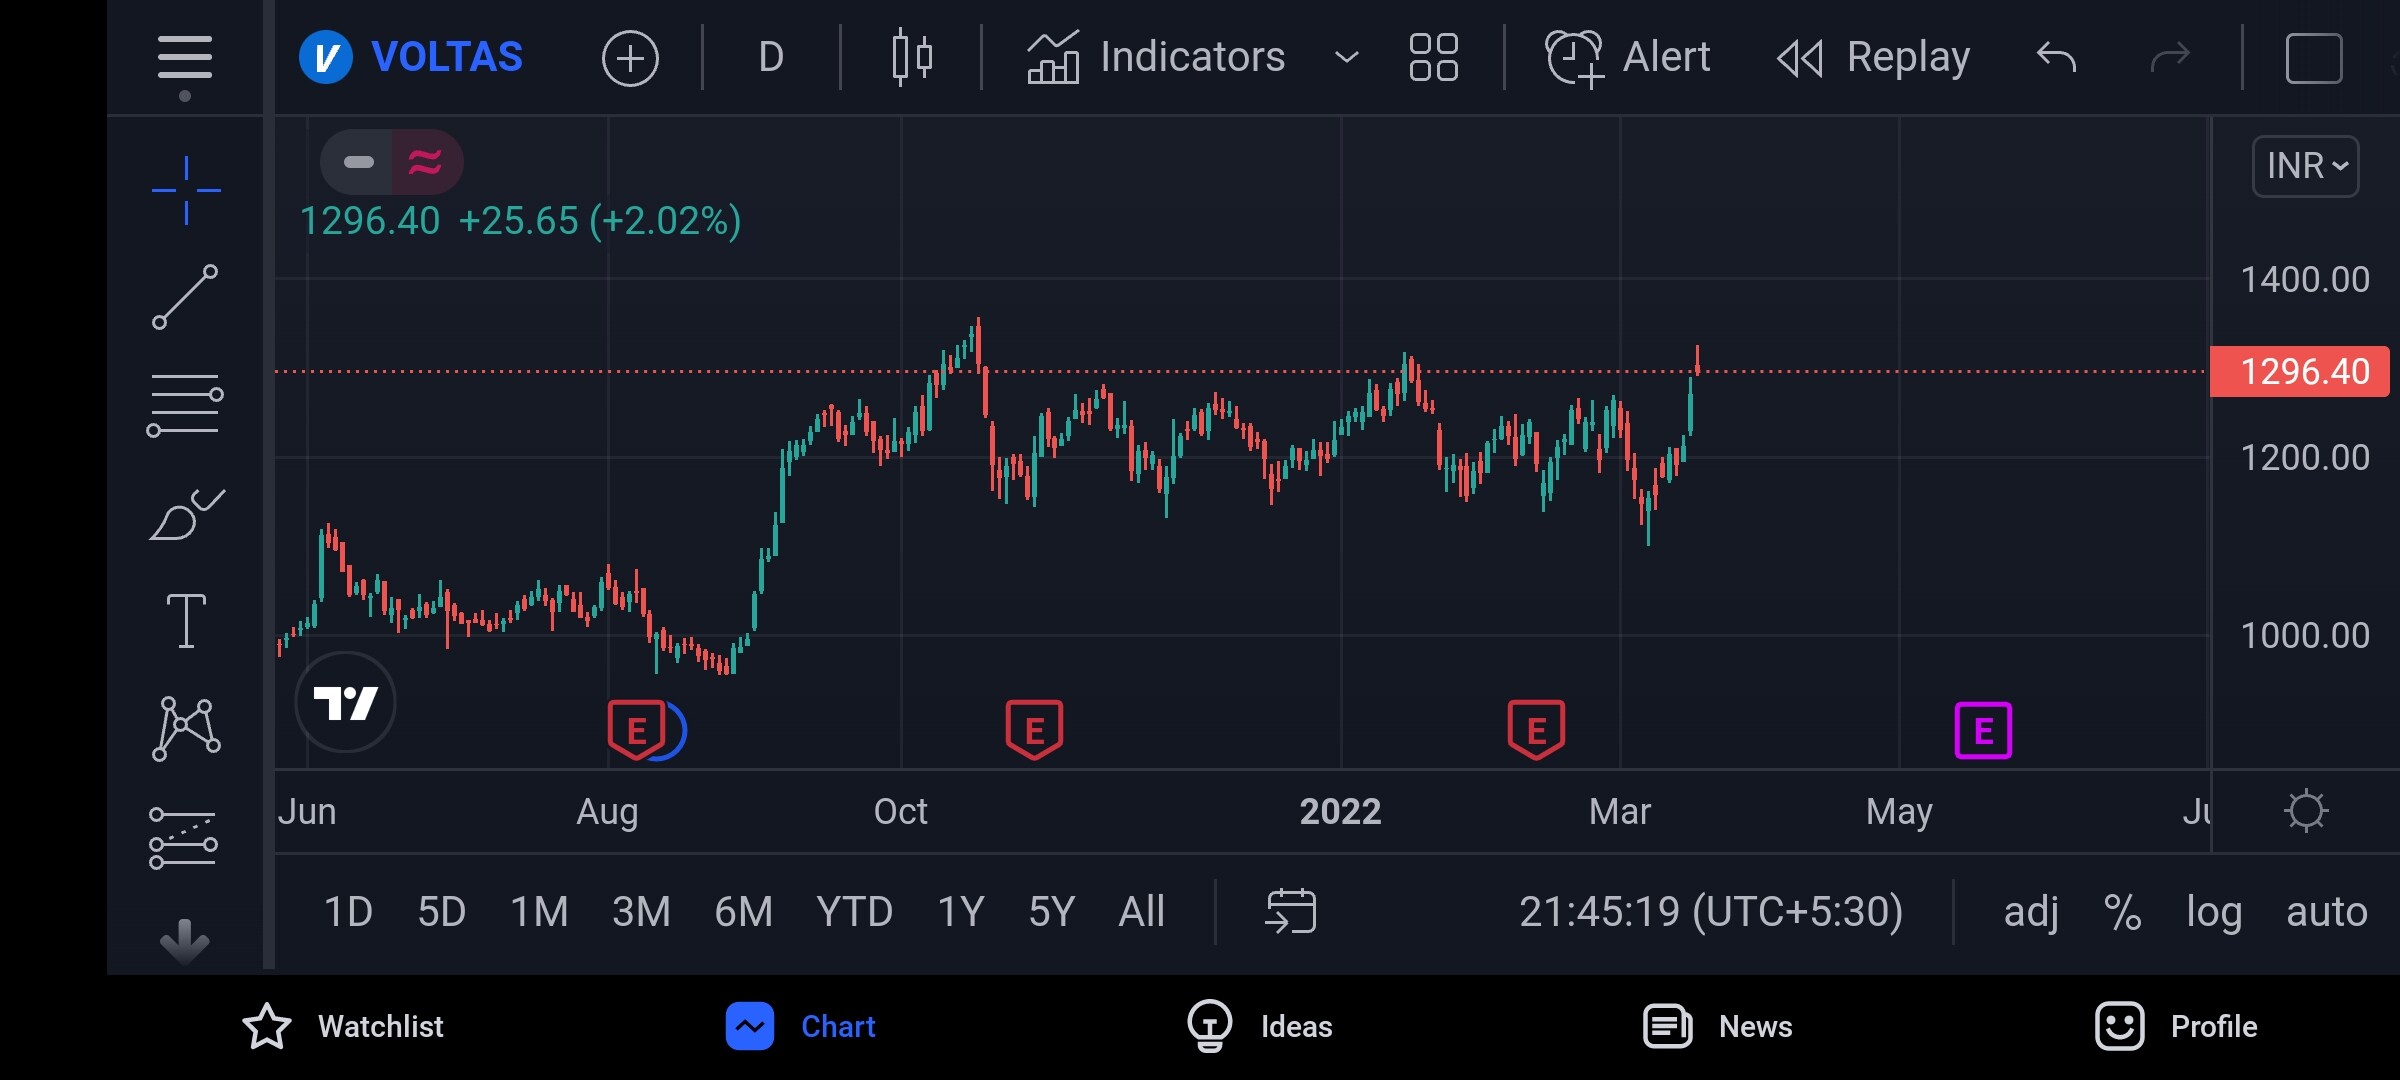
Hitesh Bhai,
Same chart pattern with voltas, I have checked blue star and whirlpool chart is not that much impressive.
Nifty today opened at 17120 and went down quickly to post an intra day low of 17006 and then reversed and posted a strong rally to a high of 17334 and closed at 17315, up by a good 197 points. In the process it tested the island gap mentioned in previous post on nifty which ranged from 16987 to 17027, partially breached and reversed.
Gaps are a fascinating segment of technical analysis. They often help in connecting the dots in conjunction with other chart formations and parameters.
As of now the short term trend remains up and today’s low and the island gap assumes a lot of significance going forward.
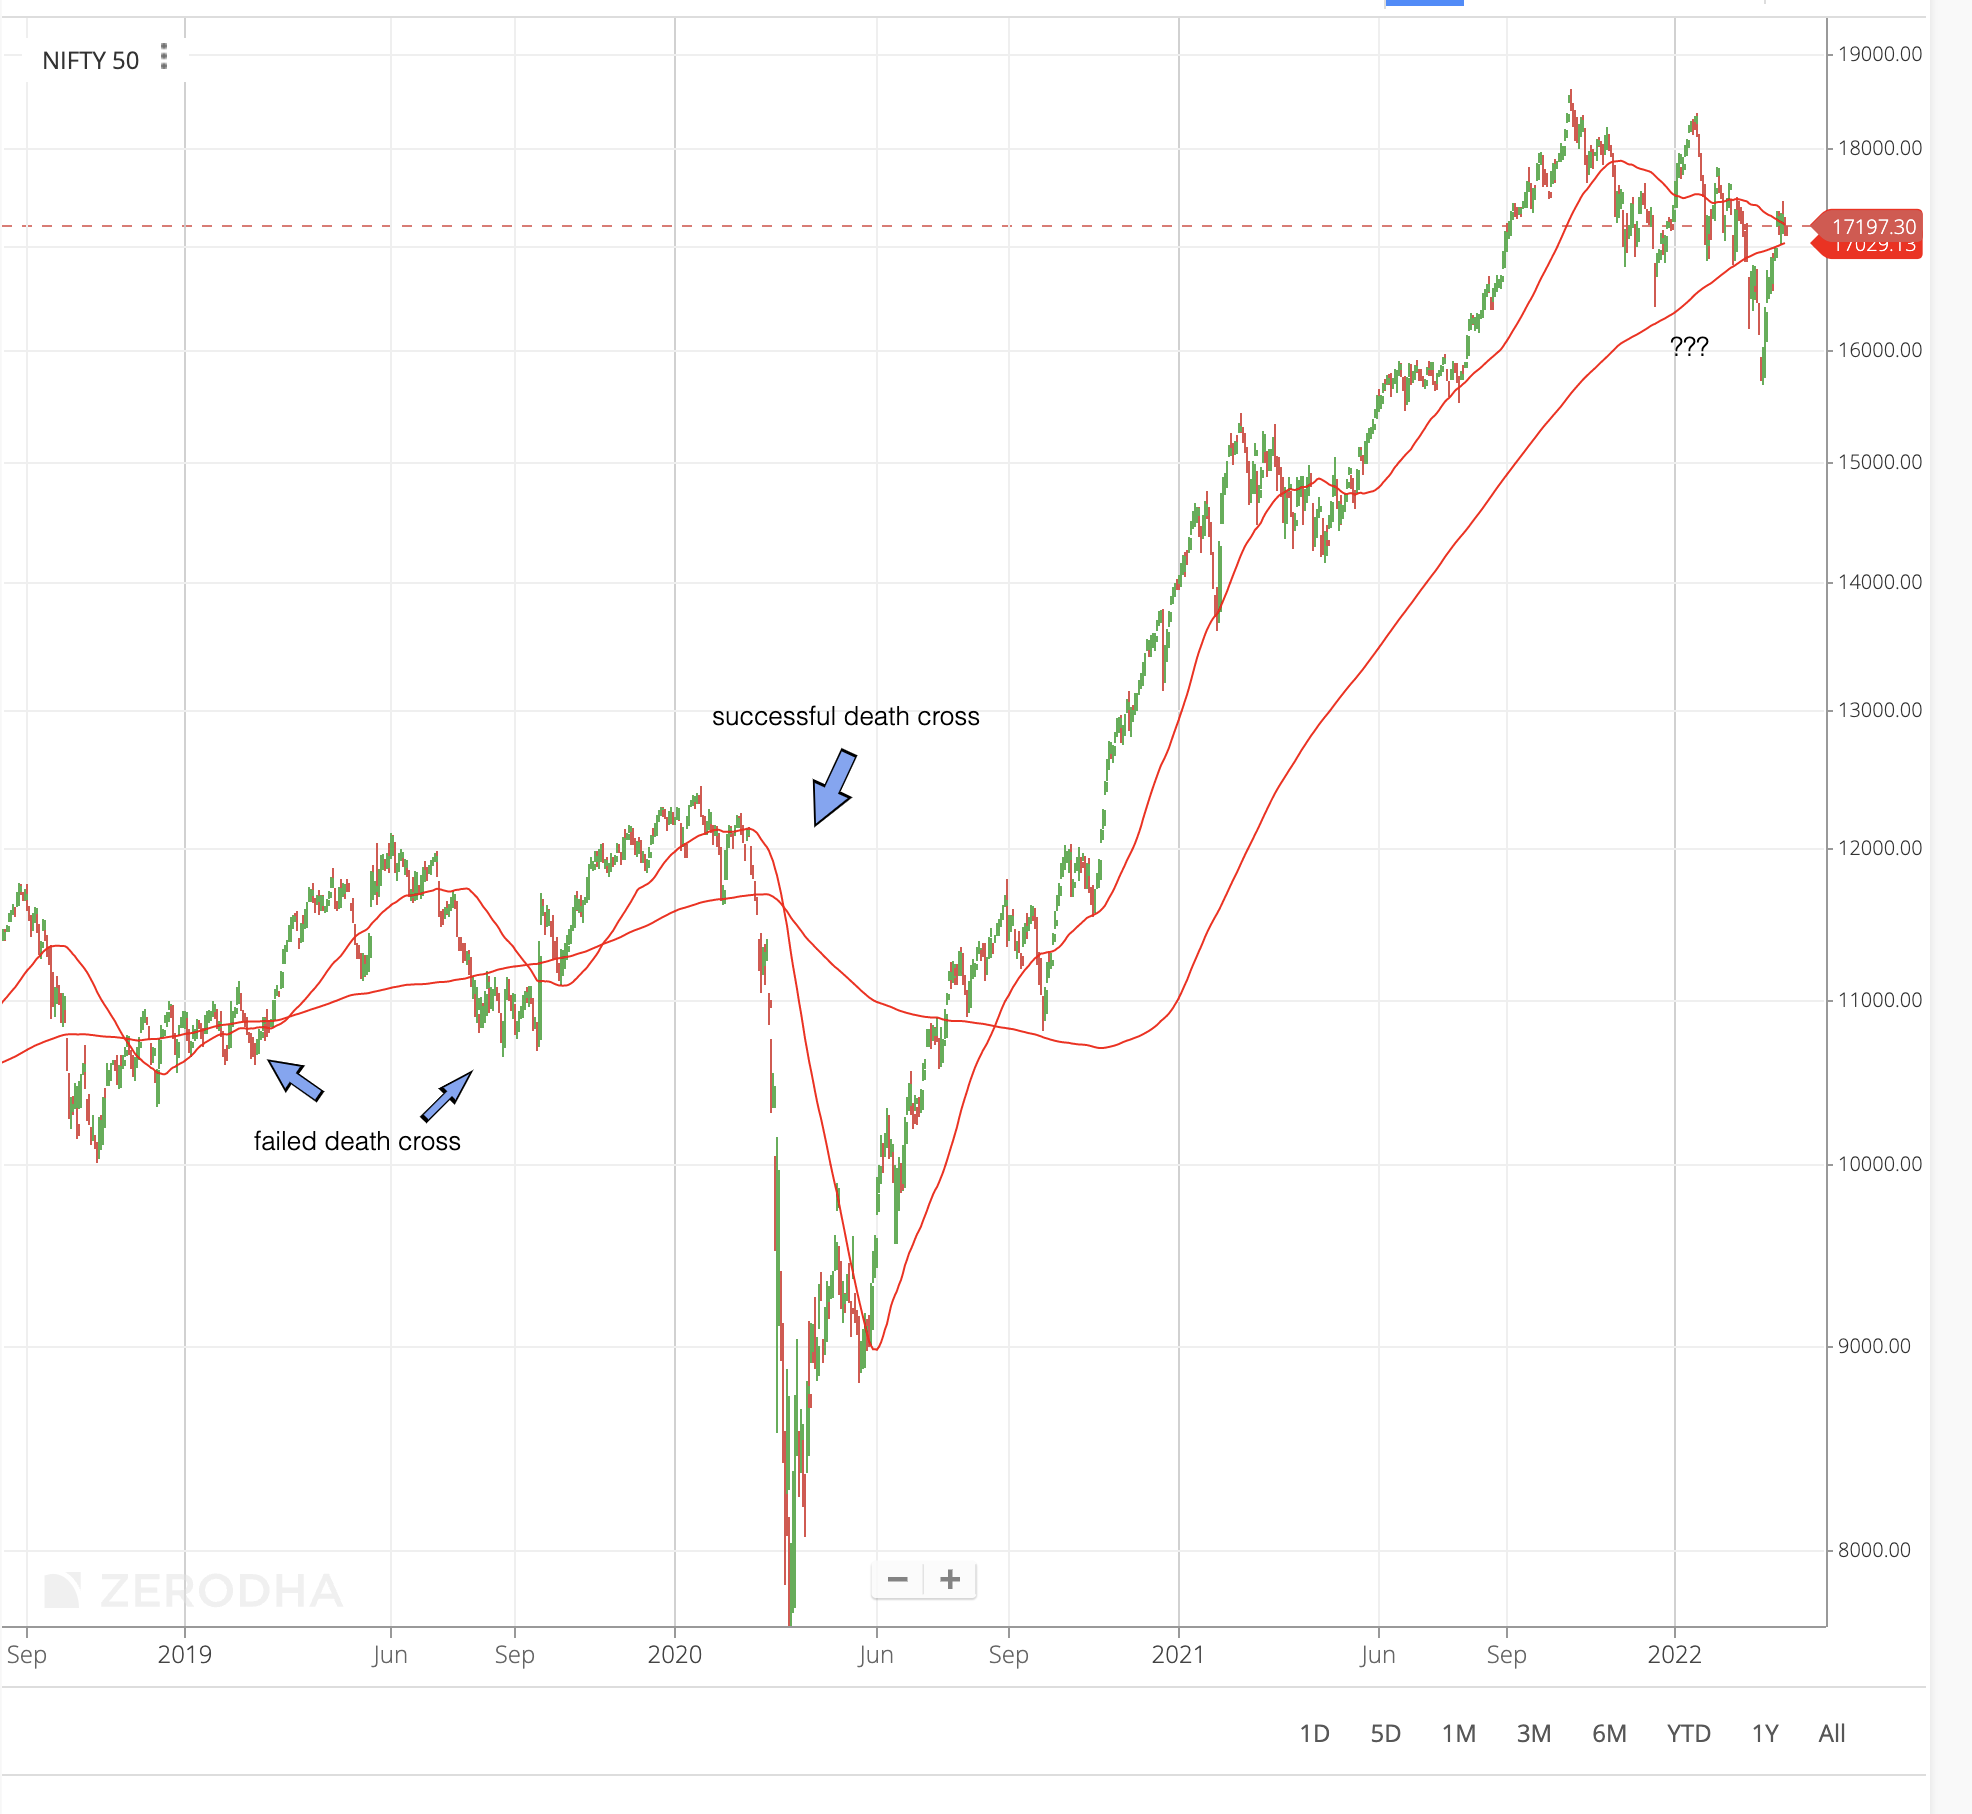
Nifty is close to forming the infamous “death cross” - a downward crossover of the 50 dma with the 200 dma. While the name is scary, the death cross fails more times that it succeeds. In a strong bull market, usually the death cross is a bottom formation pattern before resumption of the uptrend. However, when the death cross does play out it usually precedes a fall of at least 15% in the index.
There are some useful clues to be picked up from watching previous death crosses. If a death cross is going to fail, prices will repeatedly find support at the 50 dma even after the death cross. However, if the price is unable to sustain above the 50 dma within a week of the death cross, it is probably the real deal.
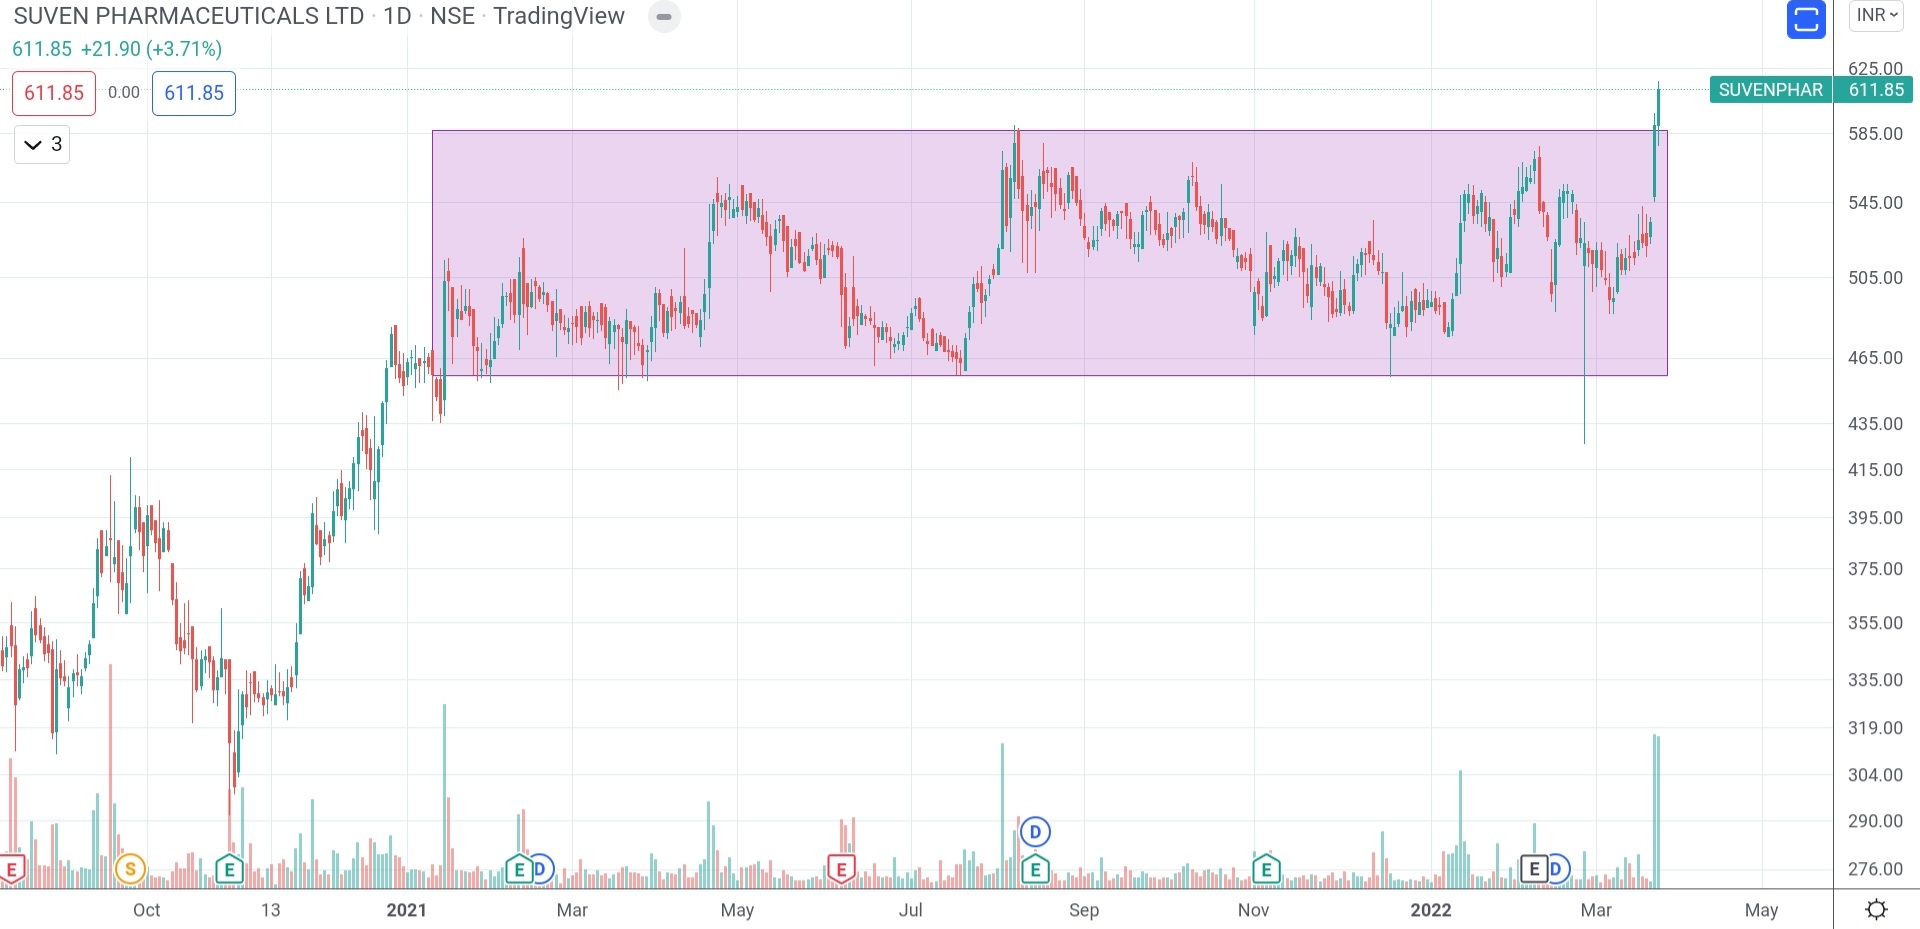
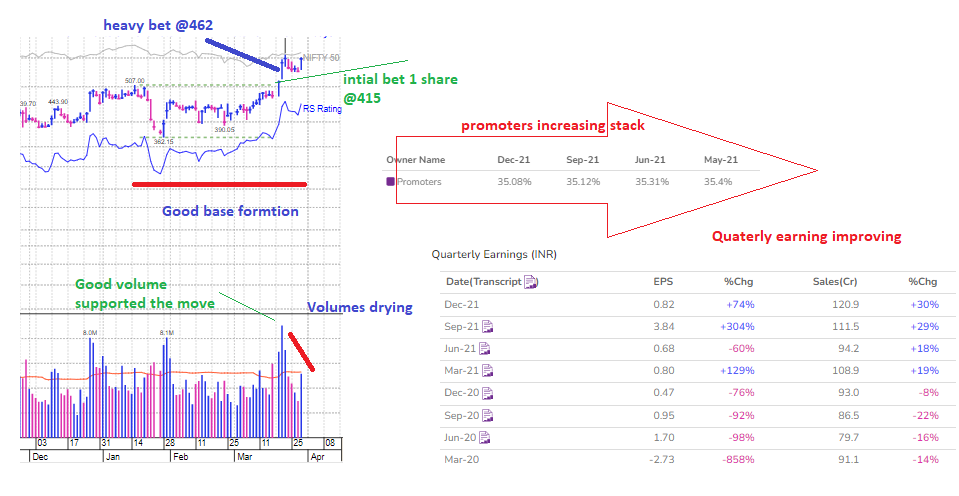
Suven - All time high with volumes, sustained at next day too, been range bound for over a year+, while a broader perception was in last year that it is going through a large maintenance Capex cycle and thus low interest from participants, goes without saying it has sharp Promoter and industry leading margins, capable of delivering on CRAMS theme as well as API.
NLC chart update. I was just observing the candlestick pattern of quarterly charts. These because of their timeline carry long term implications. The last four candlesticks of quarterly charts of this company present a very interesting pattern. The June 21 quarterly candlestick closed at a then yearly high of 61.05. And since then we have three candlestick closing (including the current one which will complete on 31 March, but as of now we consider the current close for practical purpose. When we get rates of 31 March we will have to review our observations) just above or around the level of 61 (shown in dotted horizontal line) inspite of posting intra quarter highs and lows which are some distant apart.
On the daily chart, stock price is testing the 200 dema at 61.5. Need to see over next few days how this support plays out. If support breaks conclusively for a few days then its stop loss and exit time, but if we get a bounce from the current support levels, there could be some good times ahead.
Fundamentally prices of coal are trending higher and hence lignite prices too should follow suit.
ACRYSIL chart update. Few posts back I had posted a bearish head and shoulders breakdown pattern chart of Acrysil. I had a look at it then because I used to track it and the concall for q2 fy 22 sounded very bullish. They do not do concalls in q3. (they do it only twice a year). That led me to hold back on my investment because I could clearly see a breakdown below 796 of a head and shoulders pattern and pattern targets were 720-730. I also marked the level of 200 dema around 676 as a good support zone in case things get really sticky. The bearish pattern indeed played out and I was able to get entry between 670-700 through gradual accumulation.
Now an exact reverse inverse head and shoulders bullish pattern seems to be in the offing (neckline marked in bold solid green line). A close above 795-800 would confirm this bullish pattern with pattern targets of 915, which is near about its previous all time highs.
I have marked the bearish head and shoulders neckline in dotted blue horizontal line. Also note a falling trendline in dotted blue which gives indication of trend change. And before that a small bullish inverted head and shoulders breakout marked in dotted green line.
So many patterns in a single chart. (disc: invested as a techno funda bet.)
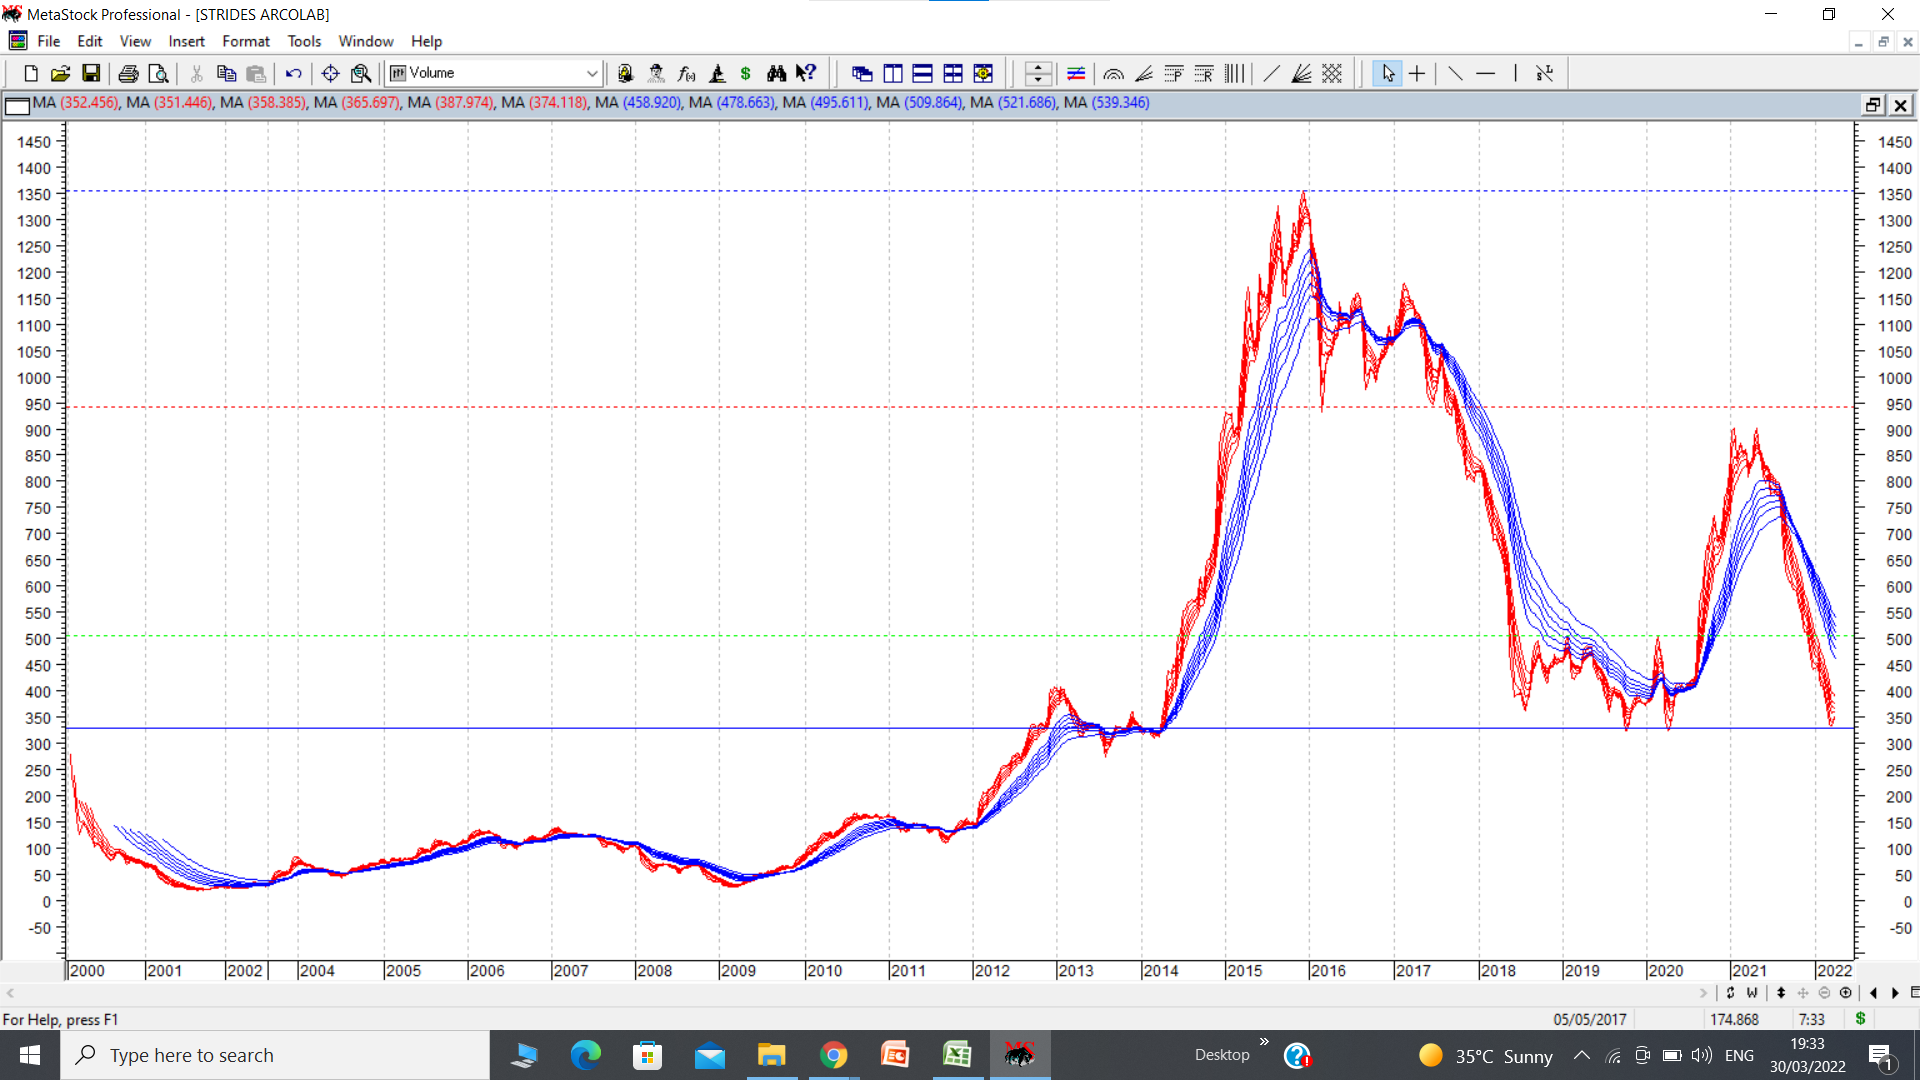
Here I am putting up a weekly GMMA chart of strides. (discussed on my portfolio thread. ) The characteristic feature of this chart is the mountain like chart. Quick upmove followed by equally quick or sometimes faster downmove. (reminds me of jack and jill nursery rhyme.)
The important aspect to look at from this chart was the breakdown below dotted red line in the first mountain where one could have taken an exit at around 950, but after seeing highs of 1350 plus, mentally its often difficult to sell at lower levels. But that’s the kind of learning we need to develop if we are techno funda investors.
Other important aspect is how to pick these stocks on way up. Note dotted green line joining the minor tops between the two mountains. That was around 506. On stock price breaking out above that level, one could have invested and taken a ride to 900 kind of levels. The difficulty here would have been exit. One could have used a medium term moving average like the 50 day ema or such other parameter.