52 week highs and all time highs strategy

NFL … National fertilisers Ltd chart presents interesting possibilities. The stocks from the sector have had a very good run up in recent months and a lot of them seem to be showing resilience in a topsy turvy market.

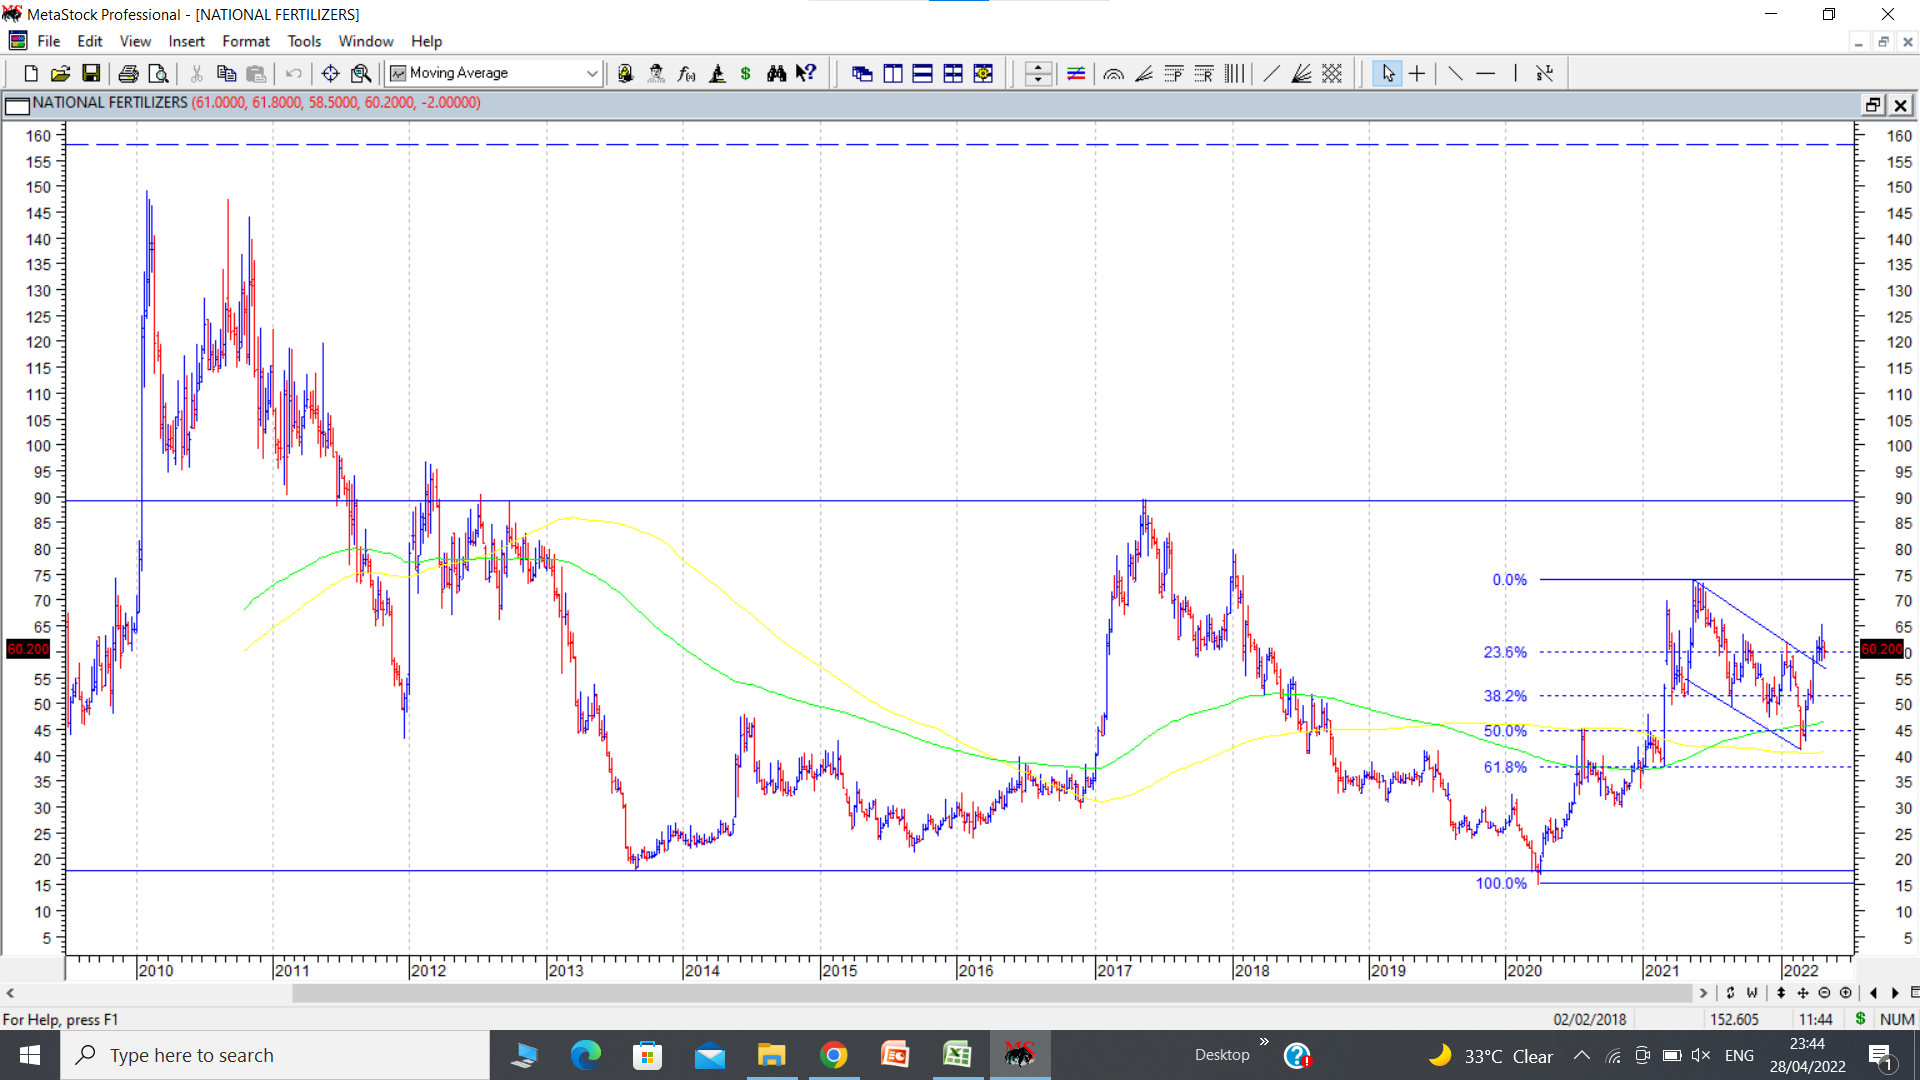
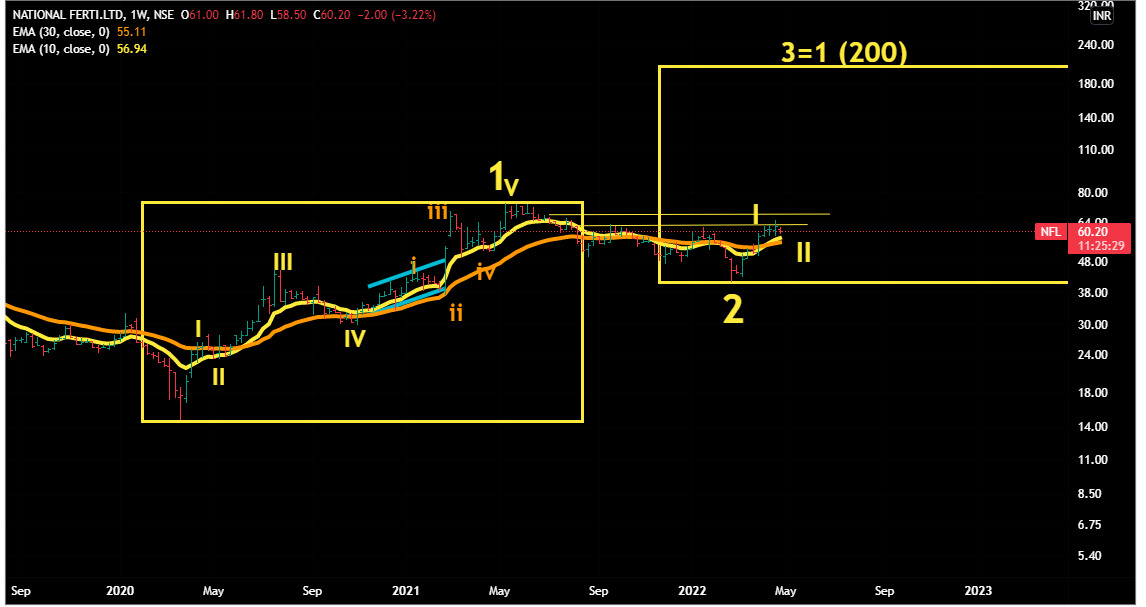
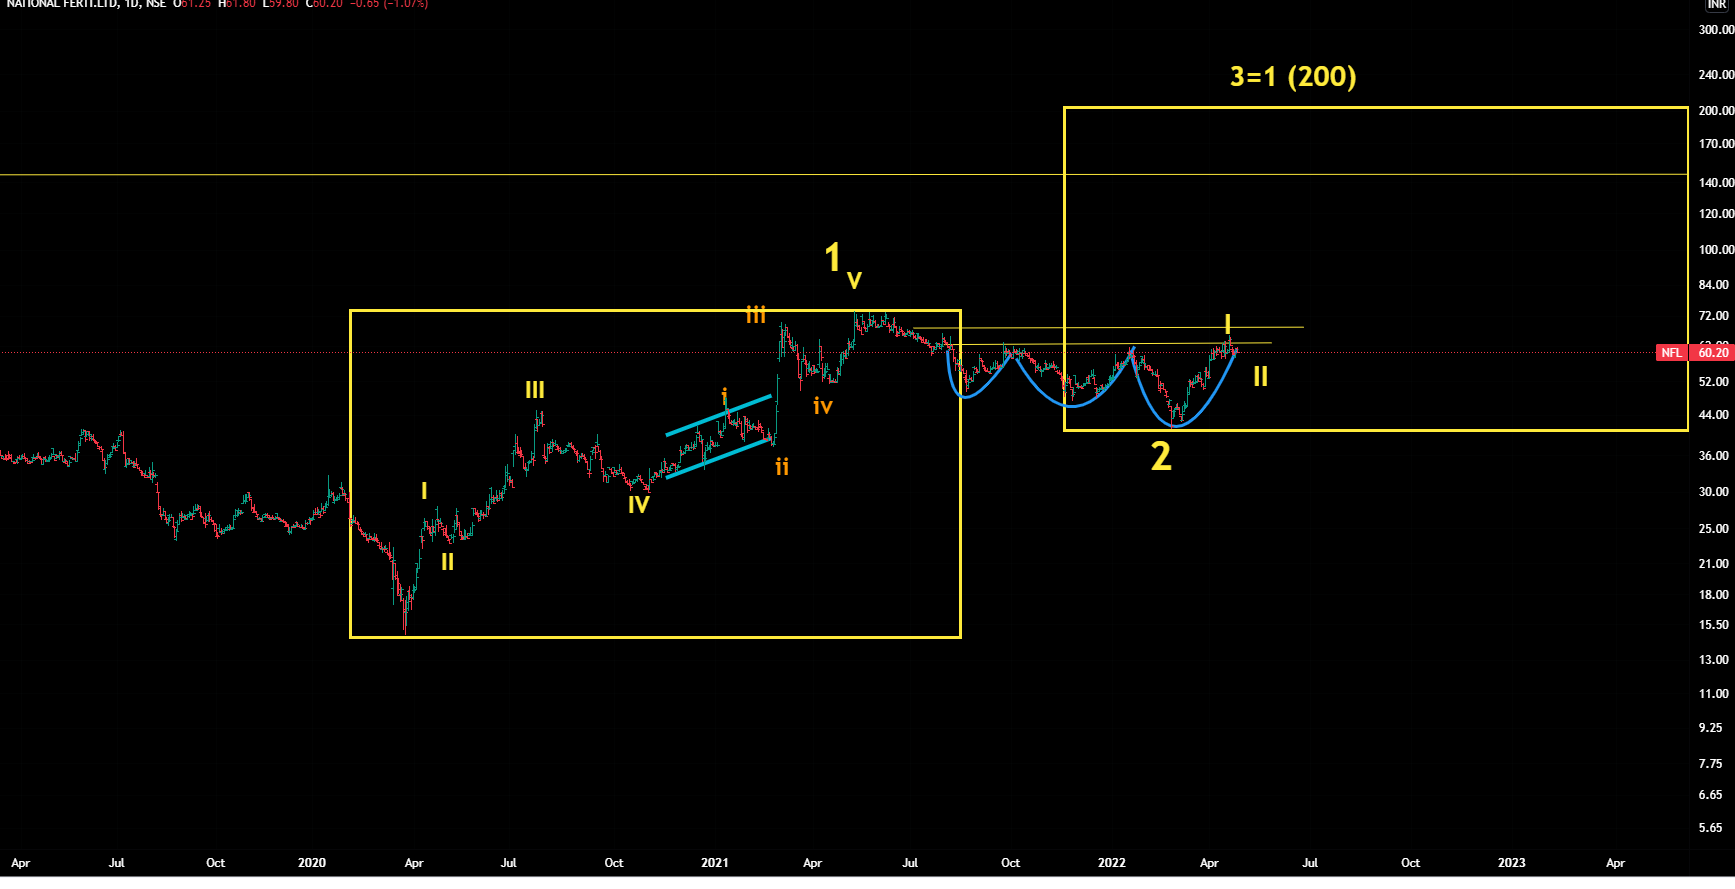
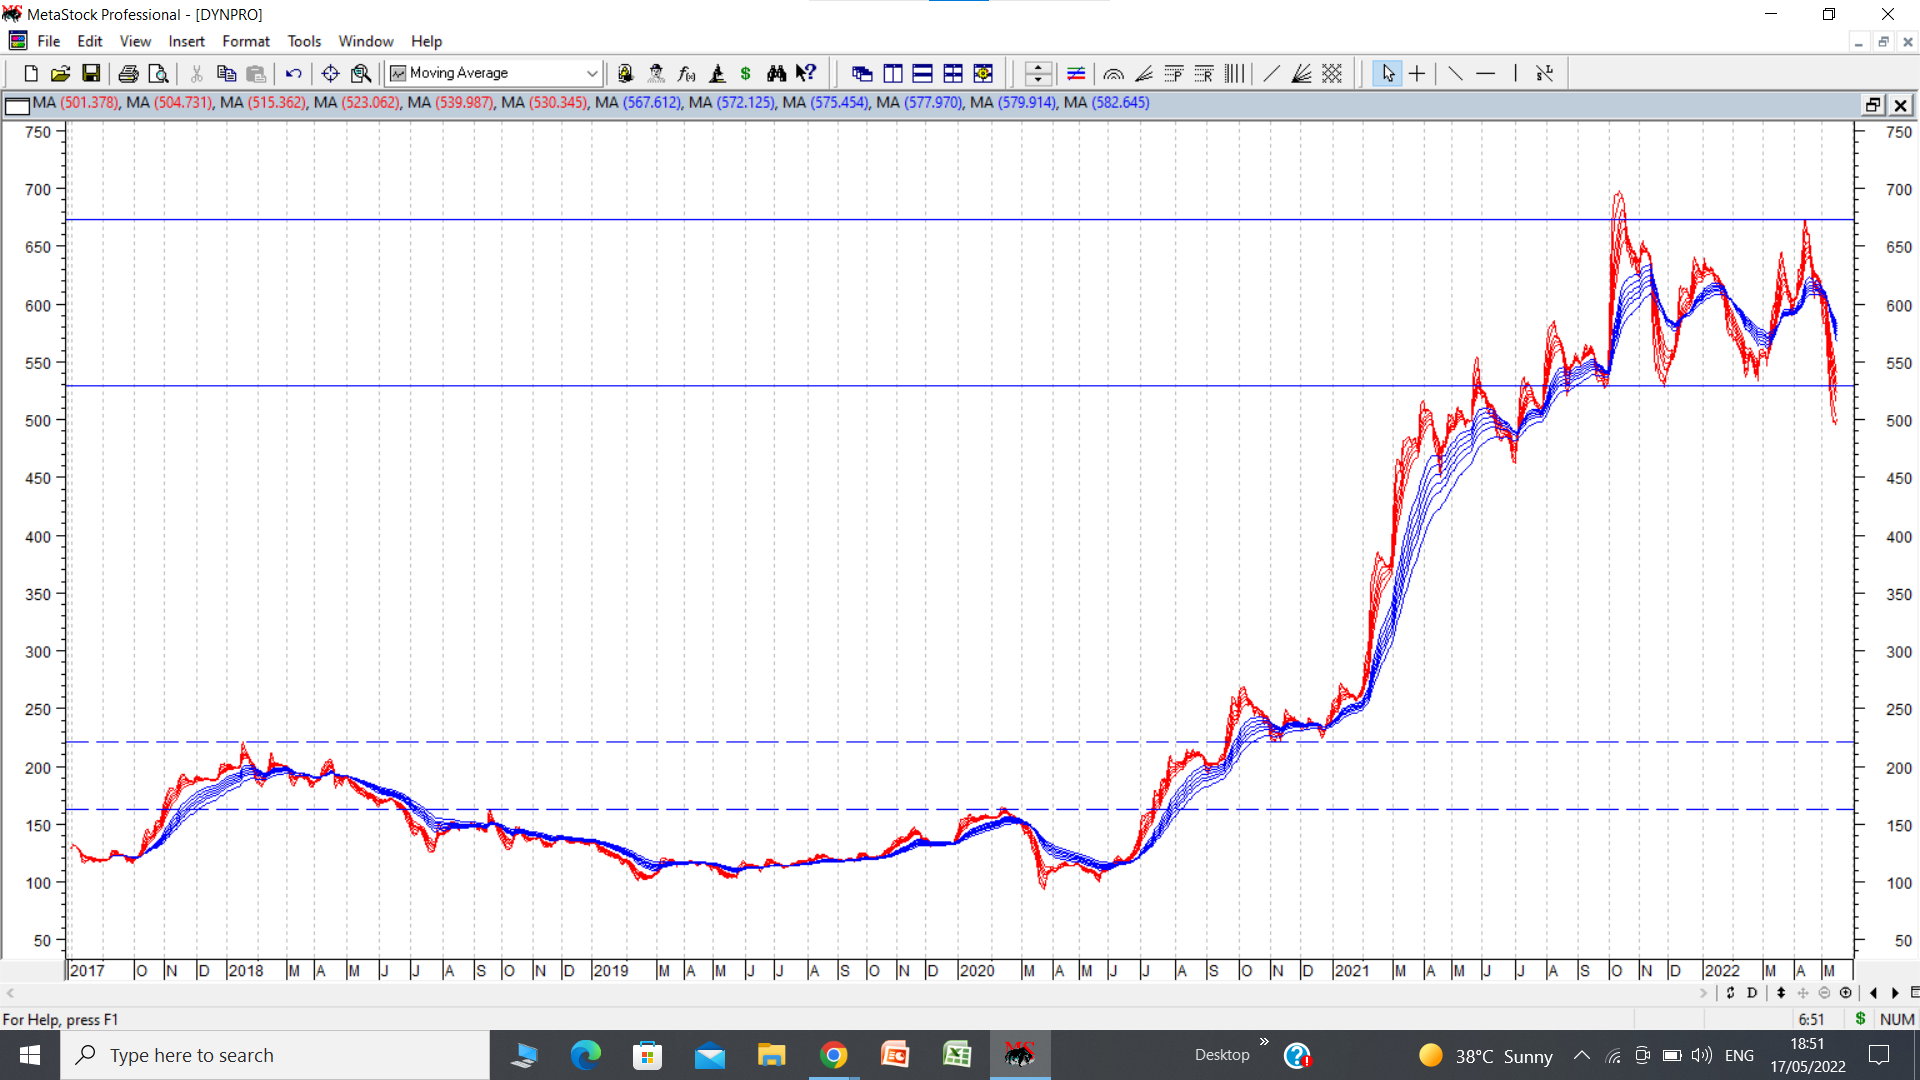
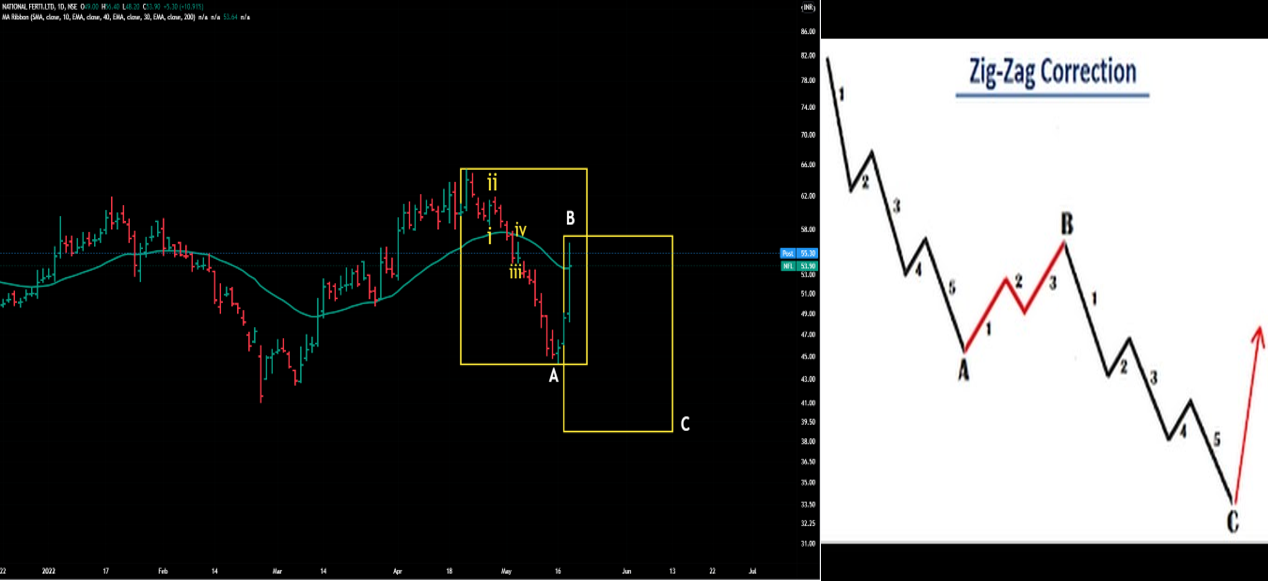
NFL chart had a strong run up when it went up from 15 to 74 , nearly 5 times in 14 months beginning March 2020. Since May 21 when it posted swing high of 74, stock went into a corrective mode as marked on the chart by a flag like consolidation. (this is not a typical flag like consolidation but more of a flag shaped correction.) After bottoming out at 41, just above 61.8% retracement level and close to 50% retracement level at 45, (again strong support shown by two previous swing tops which now offered support) stock price rallied and broke above the falling weekly trendline in April and has managed to stay above the trendline in a tight range between 58-65 for four weeks. Many a times, these tight consolidations post any kind of breakout, without suggestion of major weakness is healthy for next move up. This is a sort of platform where one takes a rest after climbing a big number of steps and once we regain strength and breath, we are ready to climb next set of stairs at a fast clip.

On the weekly chart, close to 15-17 stock price has made two important bottoms in 2013 and 2020. The intervening peak was at 89.5. (90 for a rounded figure)… Now after breakout from falling trendline if stock prcie manages to take out its swing high of 74 and cross 90, it will have completed a double bottom long term W type of breakout and post that target can be 155.

The trade set up equation at current juncture I have made for myself is buy at around current level of 60, with a stop loss of 54 (200 dema which is climbing up day by day) and aim for targets of 90 and 155 over medium to long term. The only drawback with these kind of trade set ups is we are not too sure how long these sideways consolidations are going to last. (range of 57-65) …

14 Likes

Sir -I am a big fan of your understandings of the market.Learning a lot from your insights over last few years.

Have done the analysis of NFL wrt EW and Stage Analysis methods.

Here are my views

As per EW

We completed Wave 1 & 2 - Wave 1 started from March 2020 lows and ended in May 21 near 73. Wave 2 ( downward ) ended in Feb 22.

After that we have started a new wave- the bigger WAVE 3. We completed wave i & are now in wave ii of Wave 3 .As oon as wave ii ends, now we’d start the wave iii of Wave 3.

Wave 3 happen to be fast and with in Wave 3 , fractal iii is more faster.

As if now, we are near to start that fractal . Now whether it starts or not, would also depend upon overall market sentiment. Sometimes wave ii can take longer period.

In shorter term, we have resistances at 63, 68 and 73 ( 52 week high)

On longer term ,the target comes near to 200 ( equality rule - assuming wave 3 would be equal to wave 1) . But it may or may not be achieved as we have strong resistance at 145 .

As per Stage Analysis

Yes , we are in Stage 2, a stage where stocks tend to be on upside move. Volumes of last few weeks have been good.

The only issue is lack of volatility contraction in last 10 months.

Would like to see more of that (volatility contraction). May be the current overall bearish sentiment would help in building that narrow volatility contraction in next few days/weeks.

My Buying Startegy

Looking at all the above points, I will like to wait till it breaks its ATH (74) and retests ie. when it crosses its all left side recent resistances.

I happen to believe in Buy High, Sell High strategy. Once I ave clear indication that now stock is ready for the longer journey . Cna pay 10-15% more when I am sure of getting 100% gains rather than getting my limited capital stuck in waiting for Godot.

9 Likes

Easy Trip:-

Price was consolidated for around 6 months in the range of 240-310 then gave a clean break-out after forming another small base.Now its forming a flag pattern.

Stock is consolidating tightly when the general market is negative which indicates accumulation so a small buyer demand can push the price up. Sector tailwinds are there as an unlock theme

3 Likes

Dixon tech was a big winner in the post Corona rally. Stock price went up from levels of around 600 to 6000 plus, a 10 X within a time period of 1.5 years or so. In the process its PE went up from 35-40 to a high of 180 at one point of time. (screener data). And even closer to the tops, a lot of analysts and investors were gung ho citing huge opportunity size in the segment the company operates in. i.e manufacturing of outsourced electronics and household products. But then trees cannot grow to the sky. Stratospheric valuations can sustain only as long as numbers last. Narratives can take a stock price only so far before reality catches up.

The chart has now formed a head and shoulders breakdown. Downside targets are quite alarming. While the targets may or may not get achieved, those wanting to buy should be greedy for price and or time correction. (disc: no positions)

22 Likes

Stock has swiftly retraced from 640s in early March to 440s… could you update your technical analysis

Sir -your observation is correct.

Downfall is sure but it may follow an alternate path.

IIt has fallen in 5 wave in A, now it can take a bounceback in B wave ( alongwith Nasdaq B wave bounce ) - levels to watch 4196/4590 - and then a downslide in C wave ( again with Nasdaq.

So I will wait for B wave bounceback and start of decline in C wave I want to go short . Targets if downside look amazing ( 2700) - if that happens.

Disclaimer- Chart for study purpose only, no reco.

3 Likes

Capture

just a question on technical pattern …can we see this pattern in manappuram as a cup and handle… ?

RBL Bank last week came out with good results and management commentary indicates 20% CAGR growth for next 3 years. Book value is 211. Net NPA has come down. Stock is availabe at 0.55 times book.

The chart presents an interesting pattern where stock price formed a double bottom at levels of 100-101. Weekly low this week was 100.55. April 2020 weekly low was 101.55. Effectively we have a double bottom of 100-102. The intervening top lies at 274. Another resistance is at 158-165 where there was a weekly falling gap, marked in dotted horizontal lines.

If the current low holds and stock price starts moving up, and if performance matches the management commentary, there can be a hypothetical situation where if stock price crosses 274 during next few quarters, double bottom will be confirmed and stock price target could be 447.

Putting in simple calculations, if two years down the line performance matches commentary and there is profitable growth, book value could move up. And if there is some fancy for these kind of private banks, there can be rerating and banks like RBL can easily quote at 2 times book, providing targets close to what technicals indicate.

As of now markets seem to be on a slippery slope and its difficult to take a long term call, but with good quarterly results and good chart pattern it shows an interesting techno funda combination. (hammer candlestick pattern at a double bottom level. ) (disc: invested)

25 Likes

Dynemic Products was the favorite of HNIs and other chemical sector experts. It has a classical chart depicting Minervini staging. Shown at the bottom of the chart marked by dotted lines is the stage 1 consolidation below the lower horizontal dotted line, below 163. Once the stock price broke out above this level it started its Stage 2 upmove. (usually the most rewarding in shortest period of time) and soon crossed previous peak zone of 221 (higher horizontal dotted line) and kept going up in a sharp upmove, propelled by the chemical stock bull run and posted high of around 700. (exact high and other levels will differ slightly as GMMA chart is based on moving avgs and does not capture exact top or bottom or absolute values). Post that it seems to have gone into Stage 3 distribution which lasted from Oct 21 to April 22. And recently it broke below the distribution zone below around 520-530 and is trying to hold on.

Fundamentally the bet here is on the big capex incurred by the company. The first warning for me was the big cost overruns in the capex. And since past few quarters, the hope is that capex will start showing growth in sales and profits. And all this while with negligible growth in profits, the stock price still fetches a PE of around 25. Company also announced rights issue some time back.

The more interesting thing to watch here would be what kind of price action we can see after a Stage 3 breakdown. I have put up this chart as it contains a Stage 2 breakout on upside and now a Stage 3 breakdown which could lead to a Stage 4 fall. It is as close to a live example of Stage 3 breakdown as we can get. Hence academically interesting.

21 Likes

Privi speciality chem is an example of what could happen in a stock which breaks down from a Stage 3 distribution. As shown in the chart attached, 1760 (horizonal dotted line ) was the major breakdown from a Stage 3 distribution. And post that a major support was supposed to be around 1570-1580 (solid horizontal line) , but the force of these breakdowns is such that these kind of supports hold no meaning. After breaching the key level of 1760, stock price fell to a low of 1076 before a minor pullback. Nearly a 40% cut within a matter of only 4-5 days.

13 Likes

Caution on NFL

If someone is holding NFL , be little cautious .

It seems that whole structure is in danger for the time being.

It seems to be doing Zig Zag correction. In Zig Zag, wave A has 5 legs (1,2,3,4,5) And B ( counter bounce )has 3 legs (a,b,c ) and then there are chance that it would fall in Wave C in 5 legs and many of the times wave A happens to be equal to wave C ( that means below 40 here) -
It is currently bouncing back in B- how low C will go down? It would depend upon the height of B.(where the counter bounce stops)

This assumption would get cancelled (80 % probababilty) if the share crosses the previous high (65.45 here)

Highly obsessed invetors can wait for their exit till it closes below 44.50

Disclaimer :Chart for study purpose.

5 Likes

AIA Engineering

Monthly chart

The stock has just crossed 52 weeks high and all time high.

For last 2 years , the price of the stock did not move despite a good bullish trend in overall markets.

But now it seems to be coming out of slumber.

As per Elliot Wave , we are in wave III of larger wave 3. If everything goes well, we have a lot of distance to cover. As per rule of equality, we should go to at least 3000 - with ups and downs in between. Longer term target is very high - 1st checking point is 3000 , then the channel top and then beyond.


Weekly chart.
As per stage analysis, we are are a clear Stage 2 (above 30 WMA) . Last resistance has been broken recently with good volumes and now the stock is in price-discovery mode.

Caution
We are expecting major correction in the market in coming days , so be very careful- most of the set-ups fail in these kind of markets. When the tide goes down, even the fish start suffocating.

Disclaimer :Invested, biased and these are probable projections , don;t consider this as recommendation. If overall market-sentiments go bad, the wave- structure can get damaged temporarily.

9 Likes

Bearish Stocks /Sector

Chemicals Sector - keep in mind that most of the stocks tend to move in a herd ie. if the sector goes down , all stocks go down ( excpetions are M & A, management -change etc in a certain company)

Before we look at few chemical stocks, let’s understand one concept .

Climax Moves !

We all know the meaing of Climax. As per dictionary, climax means the most intense, exciting, or important point of something; the culmination.

Yes ,stocks also have climax moves. Climax is peak of euphoria stage, when stock moves very high in a single day ( UC type of move) with high volumes and then starts correcting from that level.

Most of the times, stocks don’t touch those levels for months/years to come. ( be careful , these things happen at the peak of the bull markets and and prices of stock go to such levels that even the most loyal followers of the company can’t justify the valuations)

The following picture has 3 stocks and their climax-moves -
Comanies are -

IEX, IRCTC ,Aarti Industry -these climax moves came between October 20th and Novemebr 1st week. And since then,these are correcting for last 7-8 months.

These climax moves in few of the bull-market-leaders also act as
early signs of a bull-run where bulls are getting exhausted and for coming correction.

Now let’s look at certain probable set-ups of chemcal stocks :point_down:

Tata Chemicals

A clear bearish divergence is visible on MACD for last few months if you happen to check the monthly chart.

It seems to have completed its 5th wave (larger wave 1 ) in October and after that it is in complex correction .It is still in Stage 3 , just hanging on 30 WMA - as soon as it breaks 920 , that would be the next sign and belaow 900 ( 40 WMA) we might get final conformation of break-down)’

Deepak Nitrite

It had its Climax move somewhere in October 21 . And it also came in Stage 4 few weeks back.

It has completed its larger wave structure and is now in a complex correction structure for last few months.

Can touch lower end of falling channel where A will be equal to C ( final leg of corrction Z ) and that would also be 30 months moving average level, where this share tend to take support in the past 6 years.

AARTI Industry

It had its climax move in October 21 and has corrected 40 % from there.

If we look at mothly chart, it has broken 9 years long channel.
Monthly MACD cycle is yet to go below the zero line, thus indicating that there is still a chance that can stock can correct another 10 % from current levels . And that would also be 40 months moving avergae support.

If it breaks 40 months moving average also ? Well , let’s wait for that

Fine Organics

The stock gave its climax move on this Thursady only and it has corrected 18 % in 2 days from the climax move.

Climax moves are just start of downfall in a stock as we’ve seen in other charts . Let’s see what happens in Fine Organins in coming months.

Disclaimer : Charts studies are based on old patterns , price-behaviours in different asset classe. They might or might not work. But as they say, history does not repaeats but it rhymes.Let’s see whether it rhymes this time or not. Don’t take these charts as recommendations of any type.

16 Likes

Bearish Stocks/Sectors

Let’s have a look at few bearish stocks ( although to me almost everything is looking bearish since last few months).

Here is Pharma Index Chart

Seema to be having a breakdown from a tilted inverse H & S …if it works out , it can be dangerous. Already it is in Stage 4 since many weeks.

Looked at 2 fresh charts that are still trying to fight back- that are yet breeak down ( other biggies ,Divis,Dr REEDY, Auro Pharma have already gone with the wind)

IPCA Lab
Touched 52 Weeks low this week ,it was in stage 4 since October. A clear divergence was visible on weekly MACD. Completed its larger wave 1 and now in wave 2 -ABC correction.

Cipla

This one is tricky as it is yet to make a clear entry in Stage 4 . But there has been a clear bearish divergence on monthly MACD.Also one can count 5 waves of larger wave 1 Structure.

Targets can be lower end of rectangle , near to lower end of Bollinger Band.

But it should first break 20 WMA and 40 WMA to give clear signs of Stage 4 entry.

Disclaimer : Charts are for study purpose. And these are to provide caution for technical - followers. There is a 100% probability that these may proove false as EW can give multiple outlooks depending upon your own bent of brain.

9 Likes

a) This is because I started posting on this platform from May 1st only .If I was here in Oct/Nov 21, I would have posted many breakdown stocks.
b) These posts are helpful for few who believe the bottom has come and are trying to bottom-fish.
c) How about people getting some learnings from the patterns that are made during sell-offs.
d) And keep patience, you will get lot of stock-charts in coming future where outlier performance would be there ( stocks moving against the market-trends),the stocks turning around before the market turns around.

9 Likes

Muthoot Finance

Importance of 40 months moving average - for long term investors.

This stock is trading below 40 Months moving average after 6 years ( except in March 2020, where it went below 40 months moving average but did not close below that)

Keep a watch - if it closes below 40 months moving average , the first taget would be lower line of the rising channel (currntl near 970) but it can fall far-far below the same.

Here are few recent as well as not-so-recent where stocks corrected a lot after trading below 40 months moving avearge . Calulate the corrections your self.

Amazon

Broke 40 MMA after 15 years

Manappuram Finance

Borke 40 MMA in Dec 21 after riding over it for 6 years, the price was 145 ( now near 90s)

Dr. Reddy

Broke in 2016 ( was riding over it for 7 years ,since 2009)

The fall was brutal.

Disclaimer : These are lessons one can learn from the past falls. May or may not work in future, but no harm in being cautious.

10 Likes

50 and 200 DMA is used by even professional money and hence the high signal to noise these look back periods carry.

40dma may have over fitted x number of hindsight charts but it has no widely accepted value.

Anyways just my anti thesis point. Not to demean any observation.

1 Like

Hi

What is the source of these charts? Do you have any software?

Is this available freely in the public domain?

As per stage theory, where could be bottom of this stock ? Do you see more pain ?

Also how do you see Arti Industries ? To my layman eyes, 660 levels could be a support.

A follow up on GMM Pfaudler chart posted on 30 March, when stock price was 4550. Post that stock prcie went up to 5000, but failed to go any further and started going sideways/down and today seems to have broken down below a distribution range with higher than past few days volumes.

Someone who has studied Wycoff method will immediately identify the distribution phase with all its subsegments. From the look of things, there could be more pain to come.

disc: no positions, but the typical chart structure of a frothy upmove followed by distribution piqued my interest and hence following up. I saw quite a few seasoned investors considering this company as a SIP candidate whereas I feel this is typical cyclical company (ancillary of chemical play) which had a great time, but as is usually the case all good (and bad things ) come to an end sometime or the other.

Something similar happened in Deepak nitrite chart too. Will update that one too. I had put up deepak nitrite chart on 30 March on this very thread.

12 Likes