Nifty PE crosses 24|A statistically informed entry-exit model!

NIFTY REACHING CROSSING 28 PE MULTIPLE

DATE PE PB NIFTY EPS BOOK VALUE ROE % = EPS/BOOKVALUE GRAHAMS NO=PE * PB GRAHAMS NO: / ROE
11-Feb-00 28.47 5.11 1637 57.5 320.3 17.95 145.5 8.11
8-Jan-08 28.29 6.55 6179 218.4 943.4 23.15 185.3 8.00
31-Jul-18 28.22 3.7 11356 402.4 3069.2 13.11 104.4 7.96

Above is a tabulation of Nifty when crossed 28 PE. Here the difference from 2000 and 2008 scenario is that PB ratio still is very much below the levels of 2000 and 2008. So I tried to combine all the ratios to find what was common in 2000 and 2008.
Here I took Graham Number = PE * PB.
Then I took ROE as EPS / Book Value. (This assumption is not accurate).
Then I took Grahams Number / ROE
In both cases in 2000 and 2008 I got the Number as around 8.
So I had earlier decided to exit the portfolio when the this metric (Grahams number / ROE) reaches 8.
Now Grahams number / ROE is approaching 8 (As on 31.07.2018 closing it is 7.96)
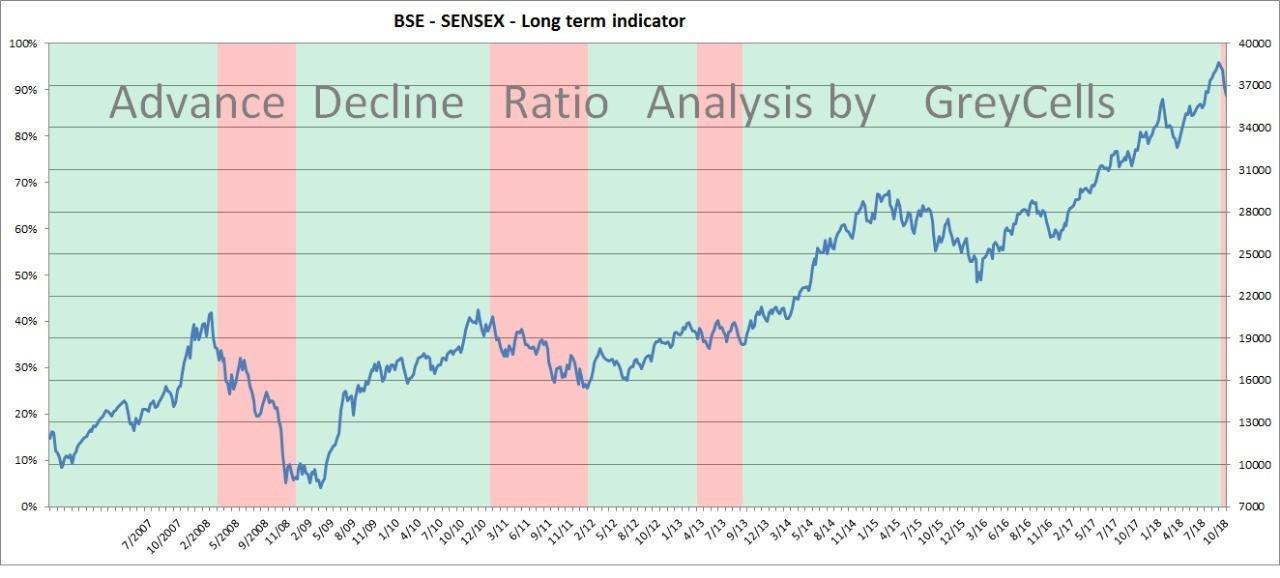
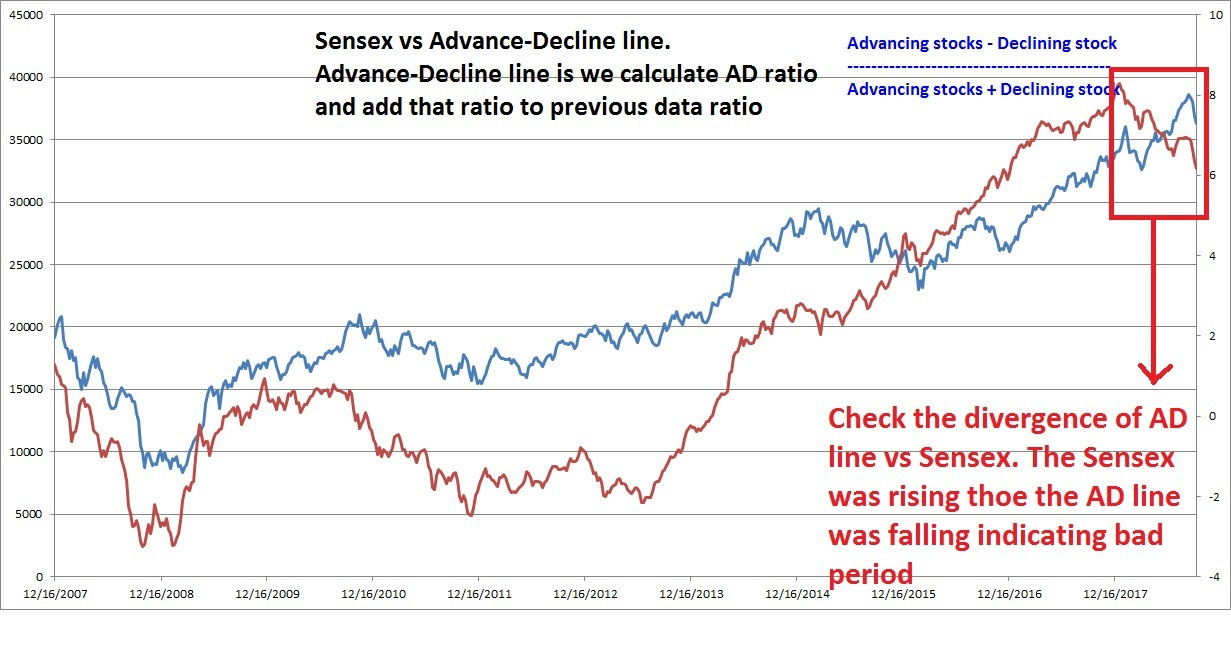
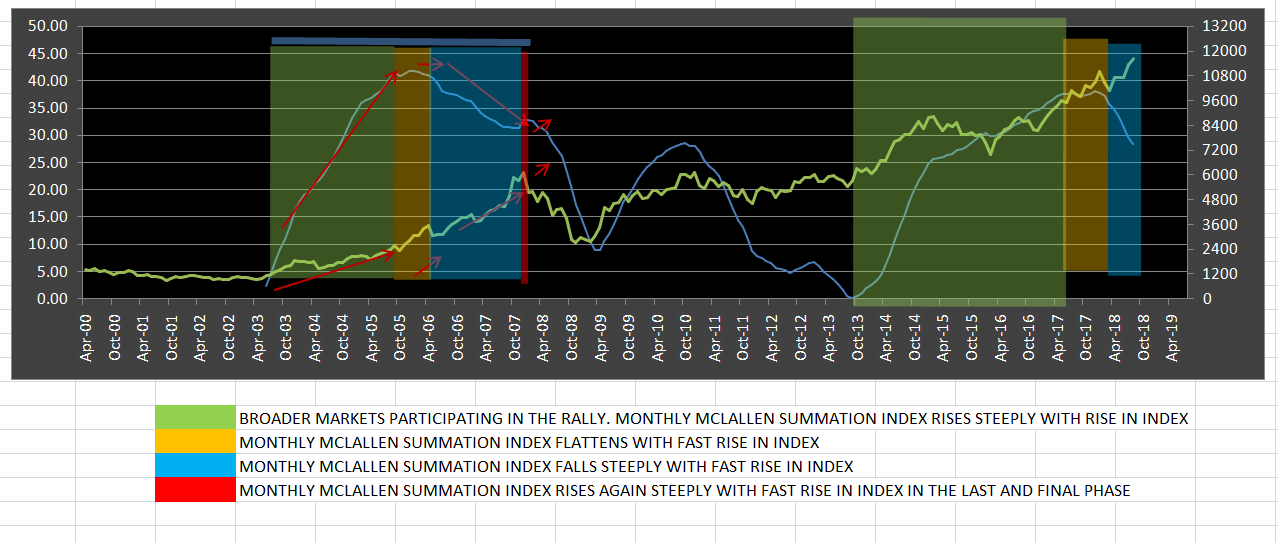
MONTHLY ADVANCE DECLINE RATIO AND ANATOMY OF BULLL MARKET
This analysis I had done with monthly advance decline ratio of NSE listed stocks
Here I took the Mclallen Summation Index and have observed a few things in the bull market of 2003-2008
First stage of bull market: 2003 - 2005: steep rise in Monthly Mclallen Summation Index along with rally in Index indicating broader market participating in the rally
Second Stage:First half of2006: Flattening of Summation Index along with steep rally in Index indicating smart money starts getting out of broader markets and entering index stocks. But still broader markets are held due to retail participation
Third stage : second half 2006 – end 2007: Steep fall in summation Index along with rally in Index. Heavy fall in broader markets due to exit of fund houses from them and towards end due to panic by retailers.
Fourth Stage and final stage : 2007 Nov, Dec: Again Monthly Mclallen Summation Index rising. broader markets once again starts to perform due to retails coming back.
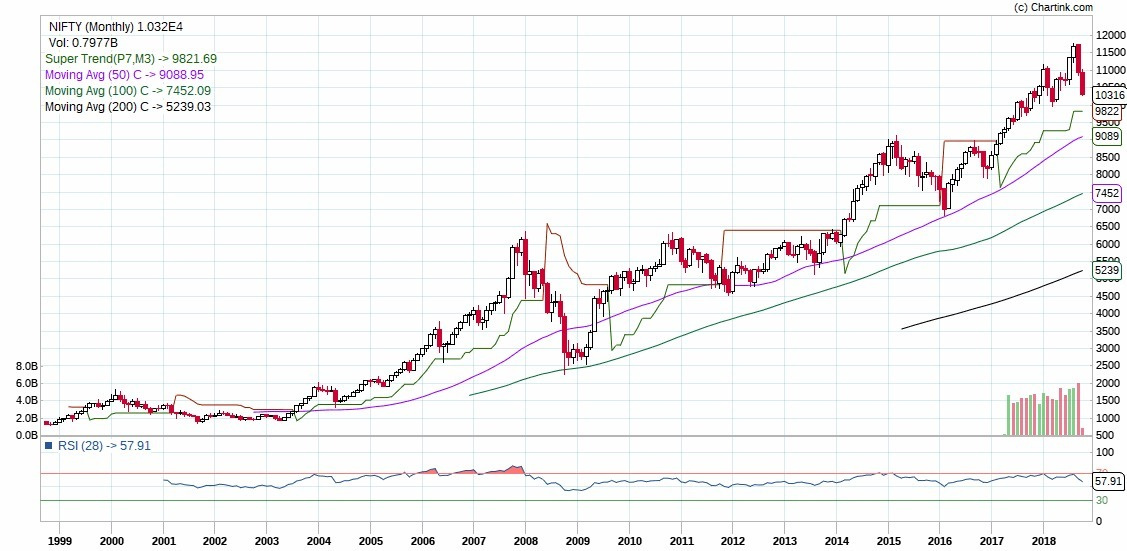
By this time in 2008 January the Index had crossed 28 PE


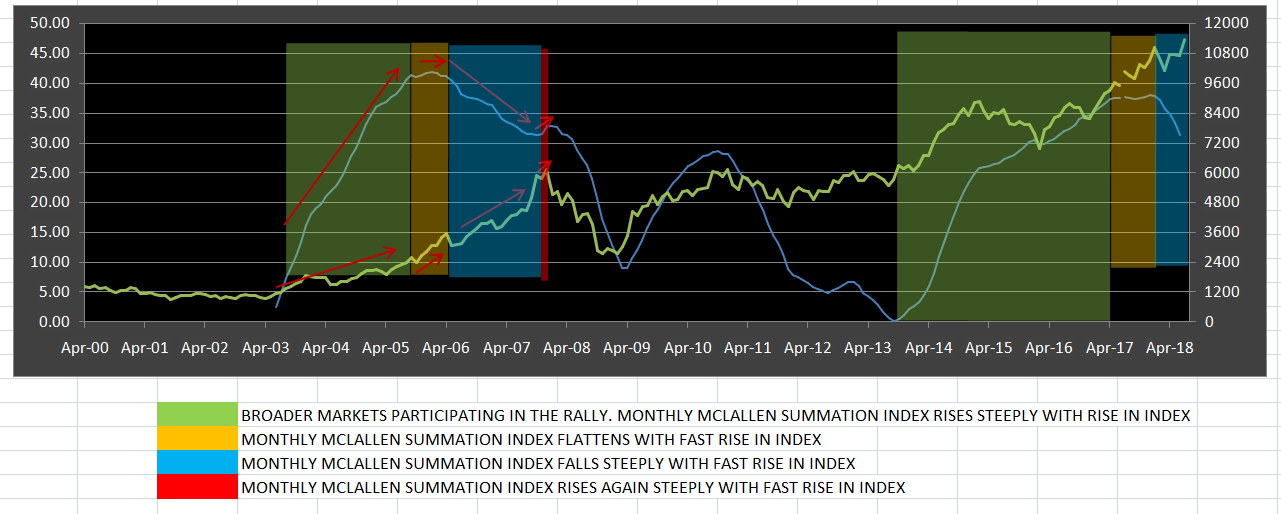
The same situation is being repeated now…And …a huge participation for HDFC AMC IPO…I feel quite uneasy and also a bit confused as a strong India growth story is ahead
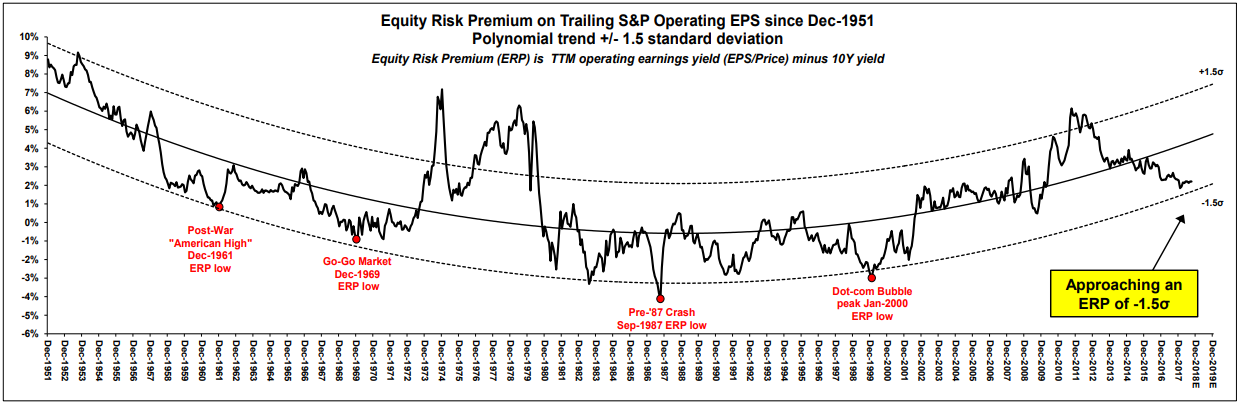
This is a tweet by Raoul Pal regarding US 2yr rates. what ever situation occurs in any country ultimately it is the US markets is what controlls the global markets
https://twitter.com/RaoulGMI/status/1023193406397448192

This is my study regarding fib time zones in nifty
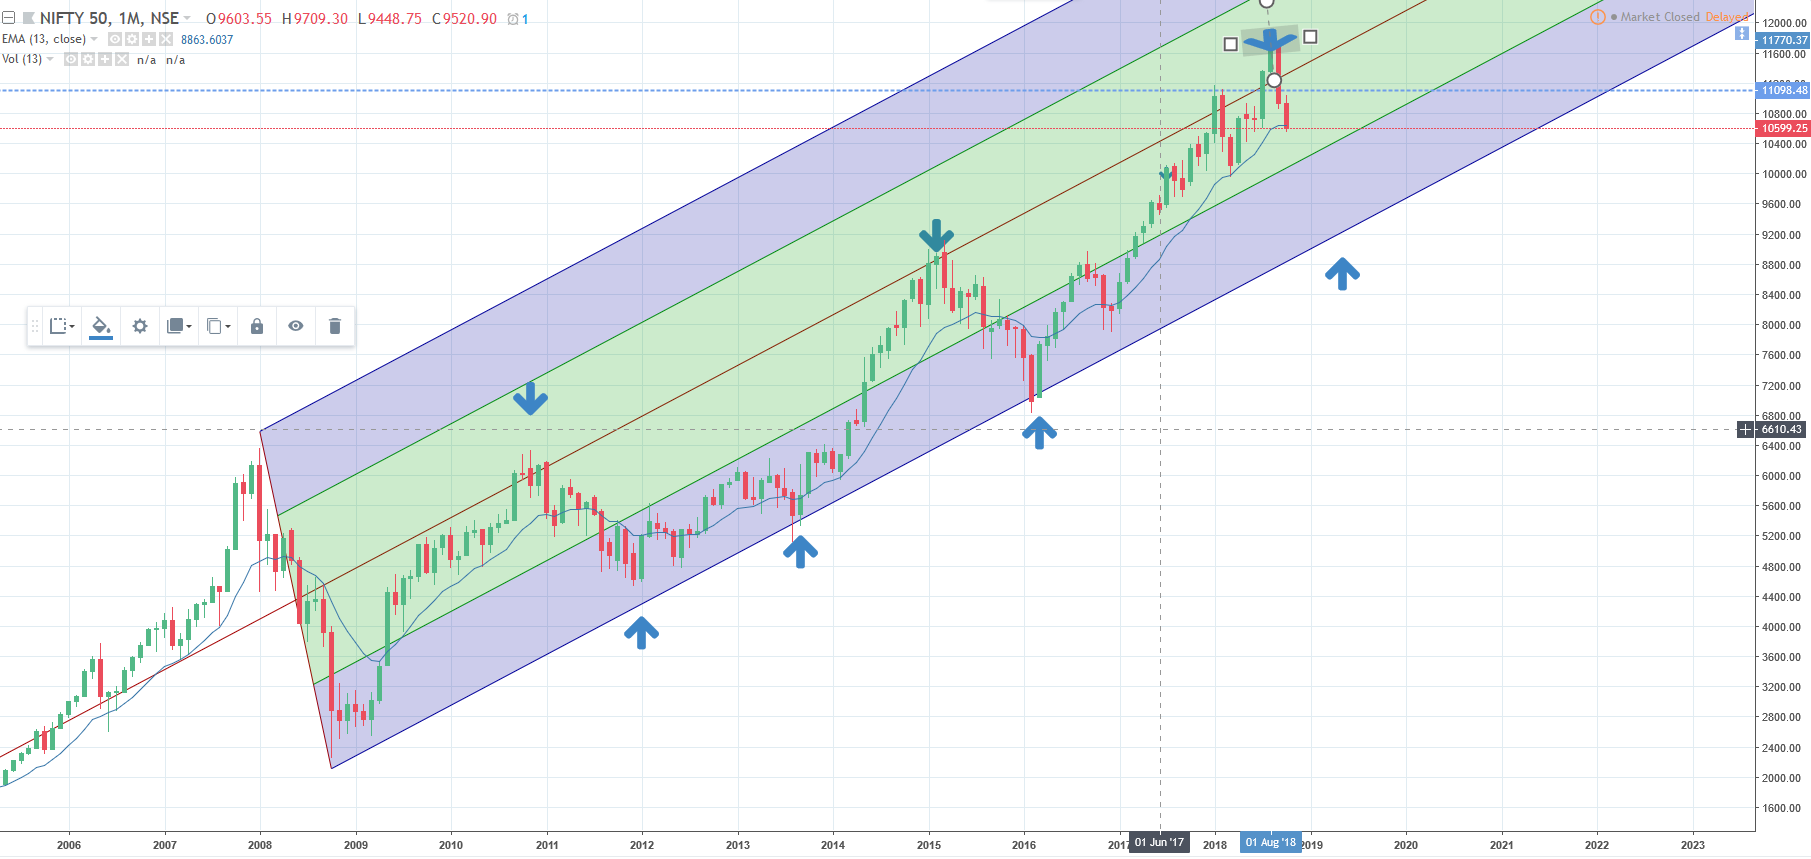
7 Likes

Surprisingly, markets are not showing any signs of weakness. They have converted a bear like me into a visitor applying burnol to its wounds, wondering about losses, watching and reminiscing the quote, “The market can remain irrational longer than you can remain solvent.

5 Likes


Current environment
Negative
1.oil rising
2.trade deficit widening
3.Inflation interest rate upcycle though might be shortcycle with Msp overhang
4. Liquidity tightening by us fed
5. Us dollar strengthen and attracting global money
6. State and national elections could effect sentiments
7. Valuation risks
8. Trade war risk
9. Emerging markets like turkey in turmoil could cause pain to Europe growth revival
Positive

  1. Sip the saviour
  2. Sentiments
  3. Earning growth revival

“This time we hope it’s different”
Time for new investors to learn old lessons maybe

2 Likes

Interesting read…

2 Likes

Equity risk premium of last 70 years :

A good correlation diagram between 10Y treasury yield and market EPS. Worth a look.

Source : marketwatch

5 Likes

Can you please explain as what it means? is it that EPS of companies are low when 10Y yield is more?

At any given point of time, an investor has multiple options for investment; e.g., stocks, sovereign bonds, corporate bonds, bank deposits, real estate, precious metals etc. In general, all these asset prices stay in equilibrium, as whenever one asset class becomes pricier, the investors switch. Only when investors become euphoric or panic stricken about stocks, the chart tends to overshoot or undershoot.

The above chart indicates correlationship between 10Y treasury yield and TTM earning yield. Now its approaching -1.5% which is almost the bottom of the cycle for last 70 years. It does not mean markets are going to crash in immediate future. Rather, it indicates that there is higher probability that equity markets are going to under-perform for an extended period of time in comparison to other asset classes.

6 Likes

Why this chart EPR not touching -1.5 mark during the time of Sept 2008?

2008 was not a peak in US equity market. The markets crashed as a fallout of burst of housing bubble.

If you look at nifty historical PE, it hit an all time of 28.72 on the 27th August 2018. We can argue saying, nifty composition has changed so its not apple to apple, the reported number is standalone earnings only, it has some loss making companies making the pe look high, earnings will revive at a faster rate, low bond yield (last year), dont look at nifty pe, be stock specific etc. But one thing i observed is that this reported nifty pe ( although its not an accurate number) ratio is a very good parameter to measure the mood of the market.

2 Likes

Makes for interesting reading with regards to the nifty valuations
https://www.morningstar.in/posts/48871/is-it-time-to-buy.aspx?curator=alphaideas&utm_source=alphaideas

Not come across gold/silver ratio before to measure liquidity. Others have any views on it? Seems intriguing

Nifty long term pitch fork which I had posted 4 months back -

Nifty dipping below 13 month EMA for the first time since Demonetisation.

NIFTY 10K is in sight again (probably after a dead cat bounce). INDIAVIX is above 20. Some more distance to go…

Disclosure: No equity purchases since Feb-2018…only selling. Portfolio: 1/4th in Equity, rest in gold ETFs, Liquid Funds and FDs. Thanks to @valuestudent, @deevee

1 Like

This post is more like a disclosure & might not add value to the thread.


Hi @vasuadiga

Thanks to @jamit05 and @valuestudent too. I personally didnt want to lose money and I always felt it is better to get lower returns (7-8% pretax) than to get no or negative returns. I didnt have the pressure to show my portfolio performance to anyone. I had family members giving me chunks of money to manage but I didn’t buy a single share in their accounts. I am a firm believer in reversion to mean and I also think we are just getting started.

In Jan around republic day I reluctantly started selling a portion of my portfolio thanks to @jamit05. By the time I lowered my equity exposure my proportion was 35-65 (equity-fixed). Since the last 2 odd weeks I have deployed perhaps 2-3% of cash mainly in my daughter’s coffee can portfolio and 1-2% in my personal portfolio.

Also I think in this thread there was some discussion I had with someone on readjusting hedges. I had also hedged my portfolio with long dated puts. And just today I closed my puts due to certain reasons. Now my 33% portfolio ie equity is completely unhedged.

We have had ~7% correction in Nifty since Jan and ~10% since Aug peak. In this period we have consistently been 97-99+%ile level on trailing index PE levels (these PE are wrong but I used them as a trend analyzer so it doesnt matter to me, correct one is captured in another thread)

In my opinion this last 25 trading day drop in the nifty is not a doomsday event as it is being made out to be. Yes in midcaps and smallcaps there has been a lot of beating down. But say for midcaps its still quite high.

Aside, being a slow reader it has taken me a lot of time to even add a company or two to my shopping list. So I prefer staying more in the safety zone of slightly higher caps.
I hope they are safe enough though :confused:

Rgds

4 Likes

Dear @vasuadiga @deevee and the pm from @kdjolly Thank you so much for remembering me. I am still in hibernation though :wink:.

I will be honest, I think you guys are too kind to tag me. I have a rustic way to communicate and it might not have helped much. I really feel that @deevee and @jamit05 deserve all the credit as they really articulated much better than me and they have much better experience and temperament.
They are the real rockstars who bought structure to our musings in a way everyone could understand.
On my part, I will simply do my donkey predictions again. Yes, there is some correction. It’s still overvalued :grinning:, I am 90 percent in cash and I expect a grinding bear market for 12-24 months. But I am very selectively now open to deploying to one or two stock a month with very little allocations and the total new investments over last month are around one percent of the portfolio. There will be ample time to buy over the next couple of years. I am in no rush.
There sure will be short term bounce backs but they will turn to fizz.
The FIIs seem intent on showing who really runs Indian stock market. The power show has begun and I will predict again, FII’s will win. As always. They are our mummy and daddy. The fii’s that is.
Deploy over a few years and very very selectively.
Please remember, Fools rush in. I have no intent to rush in inspite of bear market rallies that will come to trap any still alive bulls.

  • please note - I am an inexperienced person and with no (zero) skill. So sure feel free to read but none is investment advice and I am not Sebi registered and will never even pass their test :sweat_smile:.
    Please pick very carefully and stagger over the next few years. You will not miss anything.
    Pick Highest quality, good roe’s and roce’s No even a single doubt on management. And preferably zero debt. Preferably majorly owned by mnc,s. Don’t pick junk when everything gets marked down. This is a rare chance if the crash continues then load up only on quality.
    God bless you all and may you make 100 times of the money I ever make. Wish you all the best.
    I will now go back to hibernation.
19 Likes

I have been going through your earlier musings. Though you have cashed out a bit too early, I concur with your view of a prolonged bear market lasting an year or two. After the FII exodus, you will have deceleration in SIP flow and mutual fund redemptions. Almost all had an inkling of what may come but unfortunately I too could not cash out a substantial portion in time.

2 Likes

Although this thread is about Nifty valuation w.r.t. Nifty PE, allow me to bring a few more data point.

The first chart is taken from the blog (Indian Market: Statistical Valuation). This chart is a ratio chart of BSE-100, BSE-500, Midcap & Small cap versus Nifty or Sensex. This is developed by dividing every index (BSE-100, BSE-500, Midcap & Small cap) by Nifty or Sensex. Then plotted on chart with lower values as extreme values and higher values mean cheaper. We all know that bull market ends with very rich premium valuation of small/mid caps. That is indicated in 2008 and 2013 period and those were golden period. Currently we reached a peak in Jan-2018 and correcting on mid/small caps.

image

Second chart is about Advance Decline ratio & line chart. The advance decline ratio is calculated for each week like this
(Advancing no. of Stock - Declining no. of Stocks)
------------------------------------------------------------------ (divide by) → Lets refer it as AD Ratio
(Advancing no. of Stock + Declining no. of Stocks)

Then we take 12 weeks average of AD ratio. Then if it goes below certain levels then a bad period starts until it rises above certain levels. Below is the chart…

As you can see this chart has been able to predict bad period of 2008, 2011 and 2013. This was developed by reading Charles Krikpat book during 2014 period. This chart or model has predicted bad period currently in Sept-2018 first time … so take it with pinch of salt.

Other charts below are just supplementary charts to support the thesis that we are in bad period.

First one is Advance Decline line
This is calculated as AD ratio calculated for each day and added to summation of each day and so on so you get a line of advancing and declining line. This will rise if there are more advancing than declining stocks. There is divergence in this charts where AD line is declining vs Sensex

RSI Divergence seen on Nifty monthly charts

RSI divergence seen on Sensex monthly charts

Finally the monthly chart of Nifty with 50, 100 & 200 month moving averages. During smaller corrections of 2016 we take support at 50 month moving average and during big correction we take support at 100 month moving average.


This is not to put any target on Index but just hinting after looking at charts. Whatever has to happen will happen.

Finally, All this Negative Advance/Decline ratio, High valuation (NSE 500 PE x PB chart), ratio chart of Small/Mid Cap vs Sensex just posted above & RSI divergence are happening at Nifty PE > 25 or at 28+ PE which is a bubble zone.

10 Likes

Awesome data. I
have compiled another data. i took monthly advances and decline ratio from NSE website. https://www.nseindia.com/products/content/equities/equities/historical_advdeclines.htm
I took the McLallen Oscilator for the monthly data and computed the McLallen Oscilator Summation Index. The observations is described in the chart.


In the second phase of the bull rally the Mclallen summation index is flatening despite rally in index.When it starts to dip it is the right time to exit from all the mid and small caps.

3 Likes

Can you please explain this in a bit of detail? What level should it go below for the bad period to start? All previous years this level seems to be around 35. Currently it is close to 85.