
One of the best documents I have seen recently.
Disclaimer- Author May have conflict of interest in data compilation and presentation
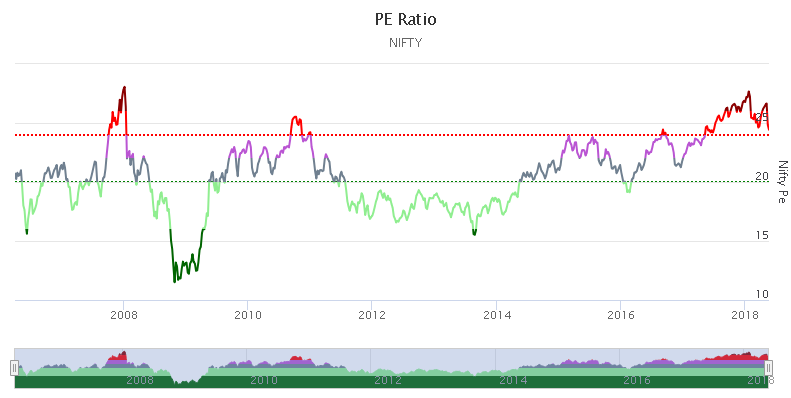
Nify PE is 24.85
Value: 10300
EPS: 414
Historically, median PE is 20
EPS: 414
The median Value then becomes 8280
Nifty could be considered cheap at any value below the median. Lets go only 3 points away at PE 17
PE 17
EPS 414
Nifty value then becomes 7038
At Nifty 7000, market PE is only a agreeable 17. In 2008, 2012, 2016 market has touched PEs as low as 12, 16 and 17.
Earlier in this thread @Yogesh_s started a conversation regarding the possibility of beating the performance of the index, and how the wide swing of prices can help us in the pursuit.
delswings.xlsx (11.2 KB)
Companies are up for sale akin to FK or AZ dhamaka sale. Some of these companies have even reached ones target purchase price, while others fall short.
I suppose, conversations on managing a Nifty 50 portfolio deserves an entire thread.
Good Analysis
Is there a way, you could get 10 year low and 10 year high and compare the draw down.
It would be interesting study.
Fairly Evident.
Very little should come in the way of PE reaching the green line (PE 20). For index investors or large cap investors, starting a portfolio between PE 15 to 20 is wise. or “timing” SIPs.
So today was a wonderful day in the stock market. All the indexes rose. All the stocks rose, everyone who is a stock investor had a slight smile on their face, nothing could go wrong today. Even the traffic didn’t feel as heavy. It was a wonderful day.
Heart warming memories of many such beautiful days of 2017 came back in the heart, when stocks used to rise and rise and making money was easy.
Could it be the end of the damn bear finally? Could it be the end of pain? Is this it? Does this mean today marked the bottom?
Fingers crossed? What should I do? Is it the time to enter? Time to deploy? Will I miss out on the rally?
Come on, faith is the first requirement in stocks!
Well, no actually. Rationality is the first requirement in the stock market.
So, yes, no doubt the indexes and stocks have corrected. But where do we stand today?
There have been many views on the Nifty PE being Standalone VS Consolidated.
So I had started tracking the Nifty 500, which I have posted a few times above in my previous posts. The Nifty 500 is a constitution of the top 500 companies in India by market cap. It has domestic facing companies, exporting companies, and everything in between. The most important thing about the Nifty 500 is that it comprises of 90 plus % of India’s total listed market cap. So basically below the Nifty 500 is thousands of companies, which are no more than 7-10% of India’s total market cap. This is a very inclusive index according to me.
I have it mapped out in a highly professional manner in which any person with reasonably great skills can figure out when to deploy cash. Here I present ladies and gentlemen; drumroll, the very professional chart.
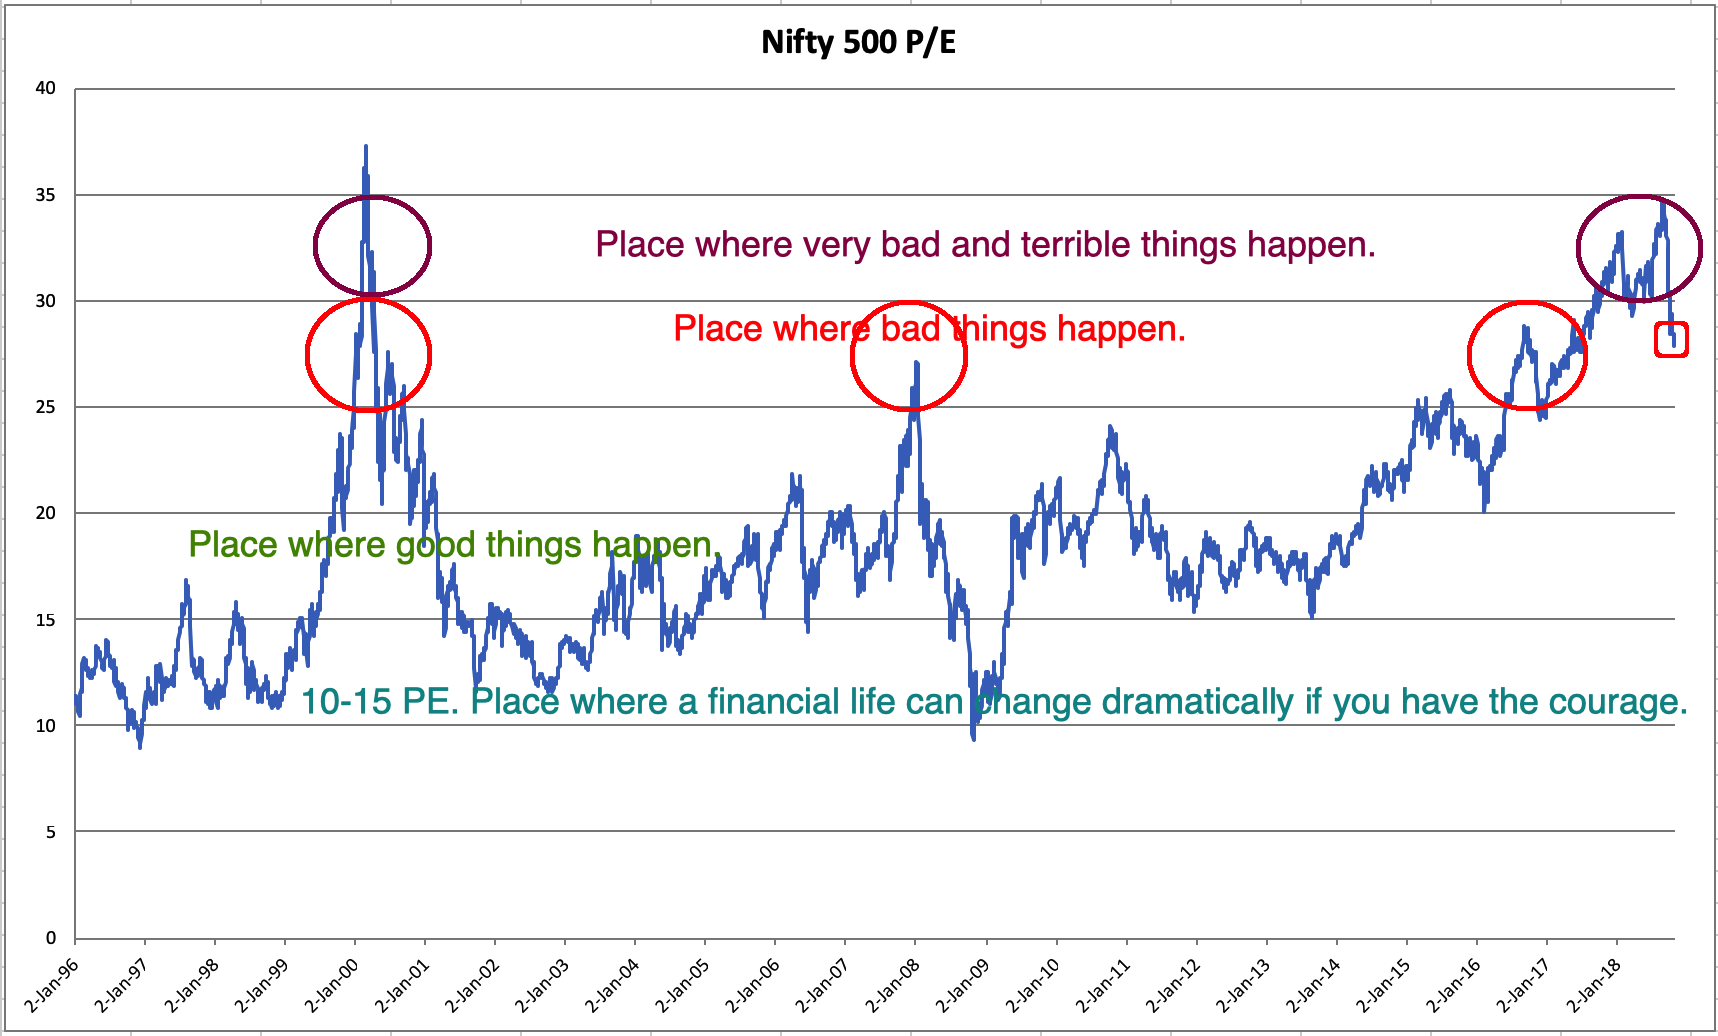
I believe one should deploy cash when the Nifty 500 is at the “Place where good things happen”.
I don’t know what will happen tomorrow or in the next 90 days or 2 years; but I know I can wait for the good place because it will come one day. Keep my fixed deposits, and invest only the interest from those deposits if I have the urge to speculate, and wait for the place where good things happen.
That’s what I am thinking in my coconut. What you are going to think in that coconut of yours is up to you.
Chart and Data Attached: 1996-2018.xlsx (228.1 KB)
Speaking of rationality, the recent flattening out and rally today may be because:
- Technically NIFTY is oversold on most indicators
- Fundamentally Oil prices have confirmed a short to medium term downward trend
- Fundamentally, quarterly earnings so far have been positive or are being perceived as positive
- Fundamentally, there are signs elsewhere and in recent commercial paper issuances that NBFC stress has been overstated
what if we think in other way and just say markets are matured over the decades and indian markets new long term going forward premium will be something close to 20…if nifty PE falls to 10 just saying its obviously a screaming buy…if you dont have money…sell your home and invest though…but i hope that may not be coming anytime soon…its always good to do a staggered buying than to watch the nifty PE IMHO…Good Luck 
@valuestudent, you seemed to have passed the XL Ninja undergrad course with distinction! ![]()
What do you make of this second order chart ?
Dear @timedimpulse and Dear @Mahendra243. None of us knows the future. The points you all mention are also valid. I am unable to predict my own company’s turnover for next month, I am always surprised by the numbers, so I at least cannot predict what the future earnings will be. So that’s why I said we need to use our individual coconuts. But we can share thoughts. That’s helpful.
Dear @arunsg
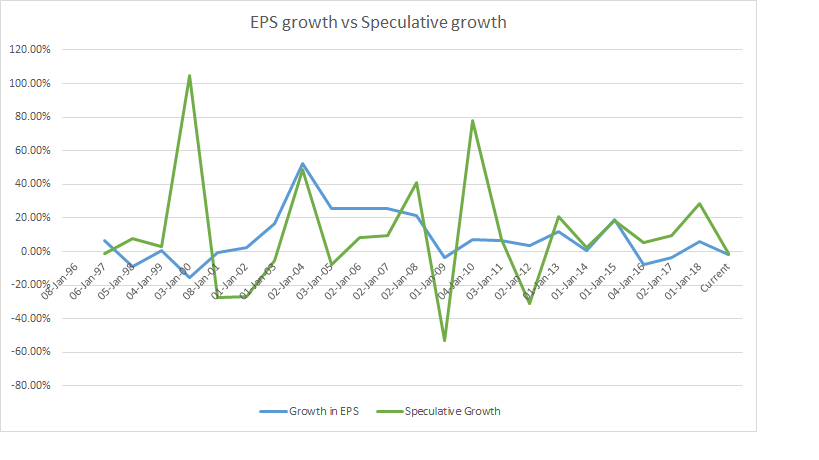
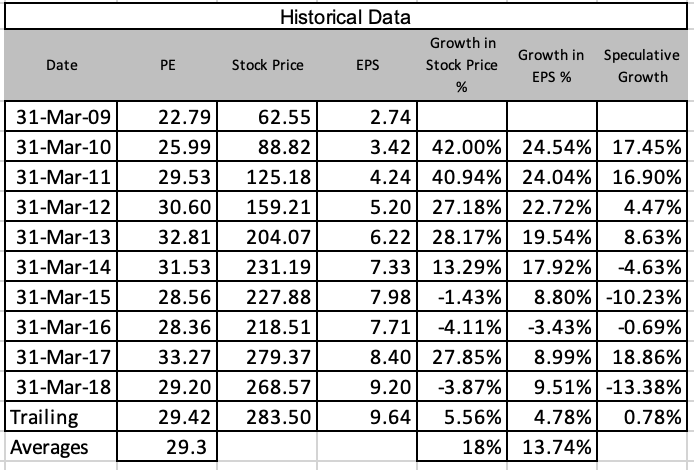
Thank you. I am happy that I passed :). I am actually a big fan of the late Mr. Parag Parikh. I use his simple model of EPS growth vs Speculative Growth as one of the test’s of undervaluation on my screener sheet, but only for bluechips. Here’s an example of ITC. ITC is so well tracked but still one can find points where it becomes undervalued even with so many people tracking it, only never by much.
I have not maintained one for the Nifty, but by the image above posted by you, it seems, it is now converging. If it comes down by 25 or so percent it would be a compelling case to start deploying more than just interest of deposits.
@jamit05 I know maintains one for the Nifty, and if he has an updated one, that would also be quite useful addition to the one you posted.
The Speculative growth in Nifty, as discussed by Parag Sir in his book “Value Investing And Behavioral Finance”, shows whether the market is “heated”. Whether there is too much speculative interest in the market.
Evidently enough…
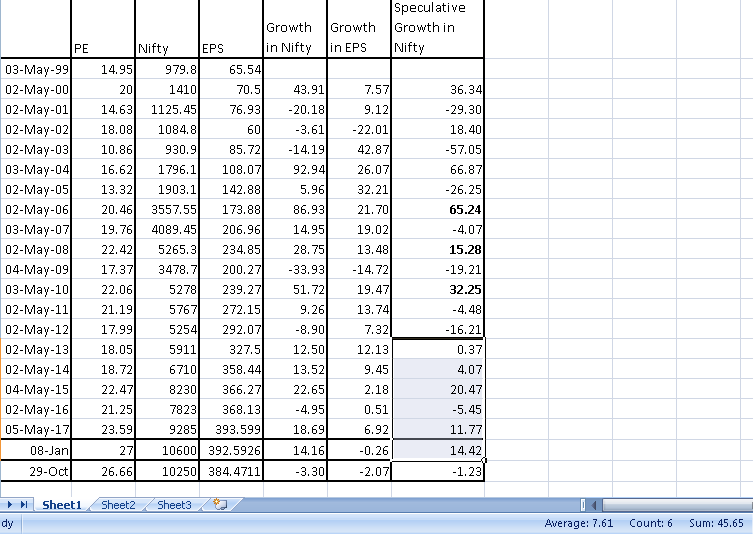
The sum of last four years is a strong positive. Indicating that the market is clearly heated. A true blood value investor looks for a market situation when the steam has (all) fizzed out, and this “sum of four years” is a mild negative atleast.
On the contrary, currently the Sum of last four years is a little over 45. The markets have been this speculatively heated only once before, that is in 2005-06.
Now here comes the interesting, really curious, part:
Its in ones best interest to wait for these 45 points to be chopped off. If this were to happen quickly, in a span of a year or so, then the market must slump to as low as 6400 (which happens to be PE 15, and a multi-year support and resistance turned support on Nifty long term charts)
However, if 45 points were to be decimated over a longer period, then there would be respite because EPS would catch up… (and god help, if not)
Over and Out.
PS: The Sum of four years is the creative addition of yours truly. Parag Sir, left it to our imagination.
PPS: Fair warning, I am strong proponent of buying cheap. So I may sound like a perma-bear, but am really not. Just pragmatic.
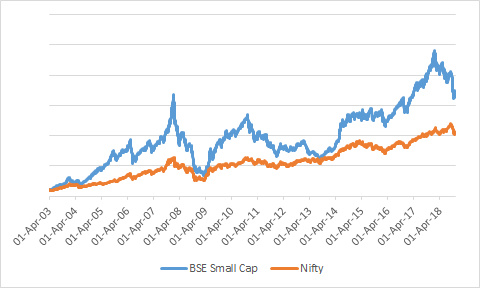
Observation:
Bse SmallCap has come back to touch its 2007 highs. Whereas Nifty is around 60% higher from its 2007 highs.
I remember having a discussion which concluded with me saying that one should invest in small caps only if he is really good with understanding businesses from what is given in their books, AND, more importantly, what is not. Else, large cap investment is what you should do.
Now, I have proof to back it up.
I think this is selective picking of data point …on an average small cap returns are always higher than large caps but with more volatility/risk…
Below are returns for both BSE small cap and Nifty over varying periods
BSE Small cap (5,10,15 year) - 137%/269%/762%
Nifty (5,10,15 year) - 64%/255%/576%
May be the best time to ride the bull run and make money is now. PE expansion can last for a decade and outgrow earnings growth consistently. Waiting for correction can turn out to be a huge opportunity cost. Stock market cycle precedes earnings cycle & earnings cycle precedes economic cycle. We had Nifty PE of 15 in 2013. Since then PE has expanded consistently. **5 years gone. May be 5 more years to continue- Till Aug, 2023 !!!
https://ritholtz.com/2005/08/earnings-or-multiple-expansion/
"Conventional wisdom states that share prices follow earnings. Over
very long periods, this statement is correct. However, the time
necessary to validate this assertion is much longer than is relevant to
most investors.
In order to test the conventional wisdom, we examined the growth in
earnings in each decade, beginning with the 1950s. We chose 10-year
periods because they’re long enough to allow the cyclical peaks and
valleys to offset each other, yet short enough to be a reasonable
planning horizon for most investors. The results of the study are shown
in one of the accompanying tables.
There is very little correlation between earnings growth and
share-price appreciation. During the 1950s, earnings grew less than 4%
a year, yet that was one of the best decades for stock-price
performance. The 1970s saw the fastest earnings growth in the past 55
years, but that was the worst decade for investors in the stock market.
(Fortunately, the book is still open on the 2000s.)
The average rate of earnings growth clusters around 6% a year,
reflecting growth in the economy which tends to average 3% to 4% per
year. Add 2% to 3% annually for inflation and one is back to
approximately 5% to 7% growth in nominal gross domestic product and the
growth in profits for the companies in the S&P 500 Index.
How you do it matters. If one is a value investor, to whom margin of safety is of prime importance, then he may not find this the best time to invest.
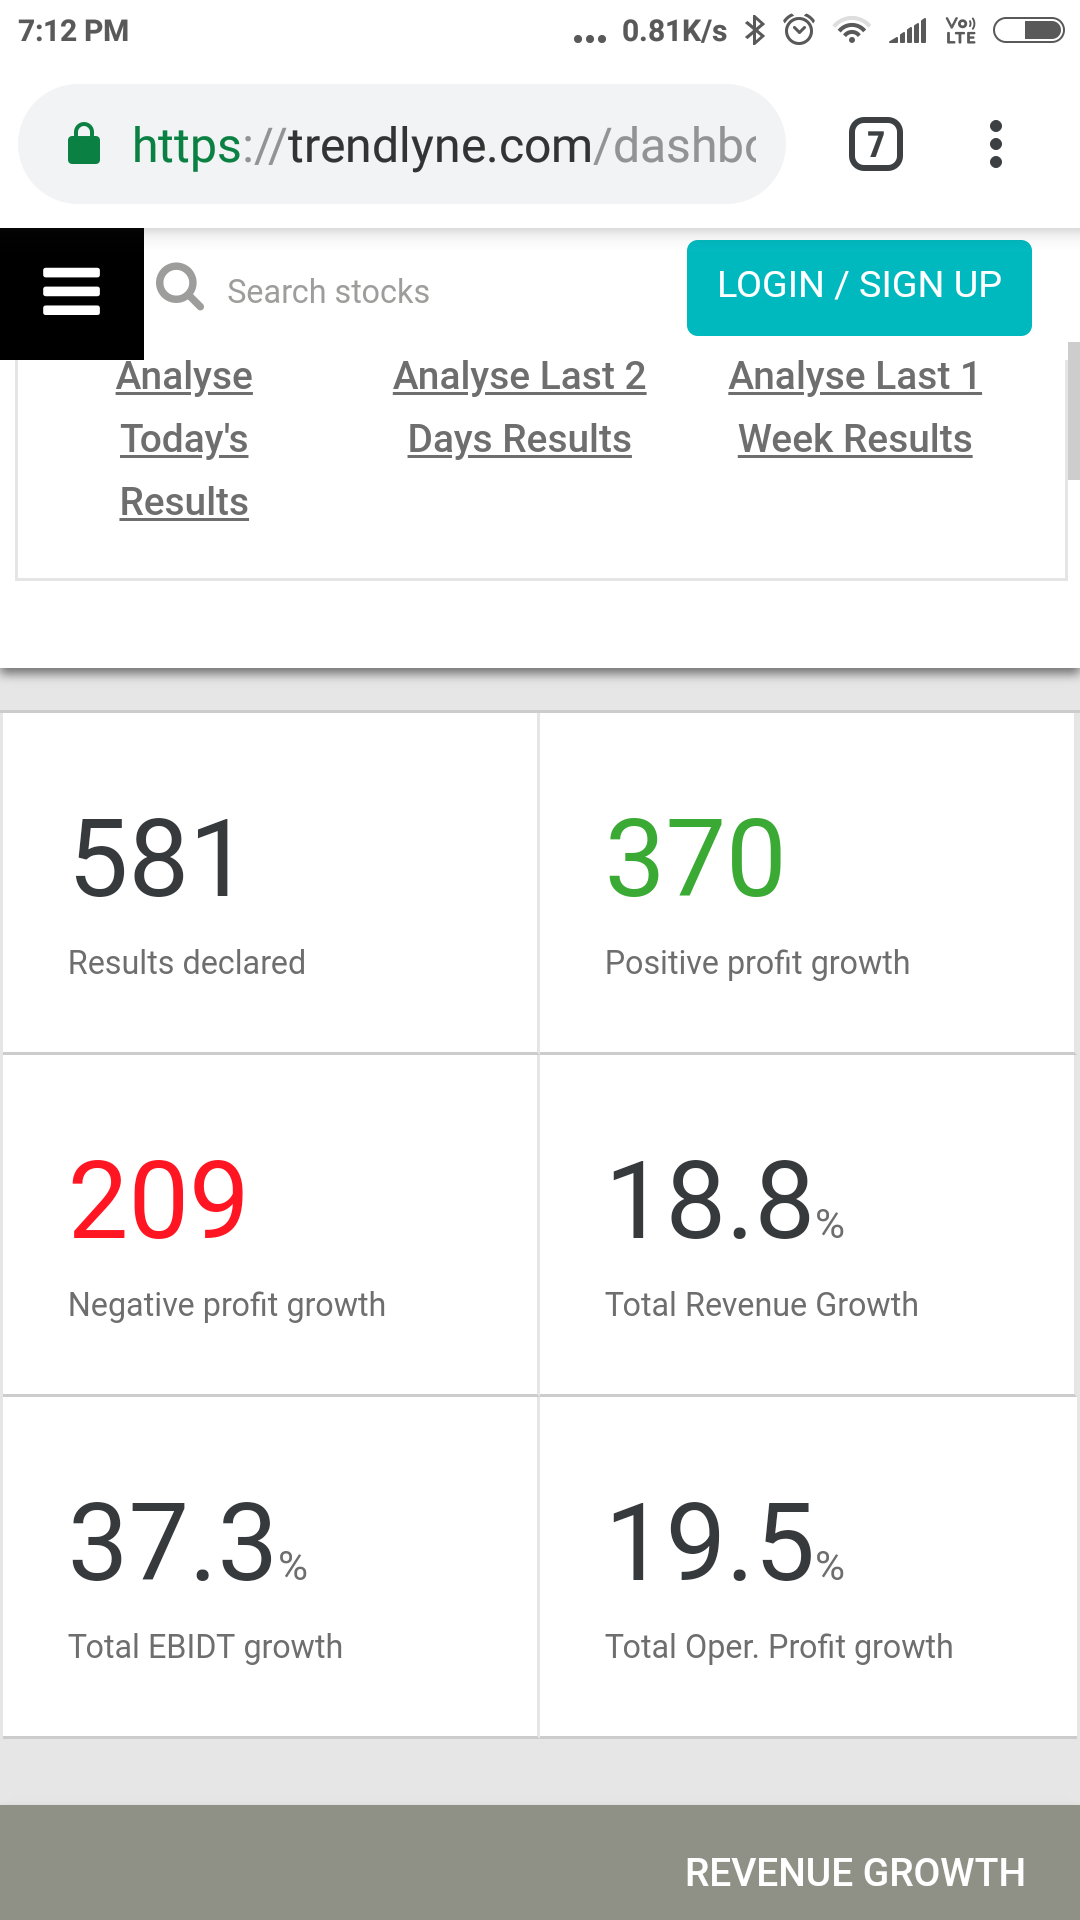
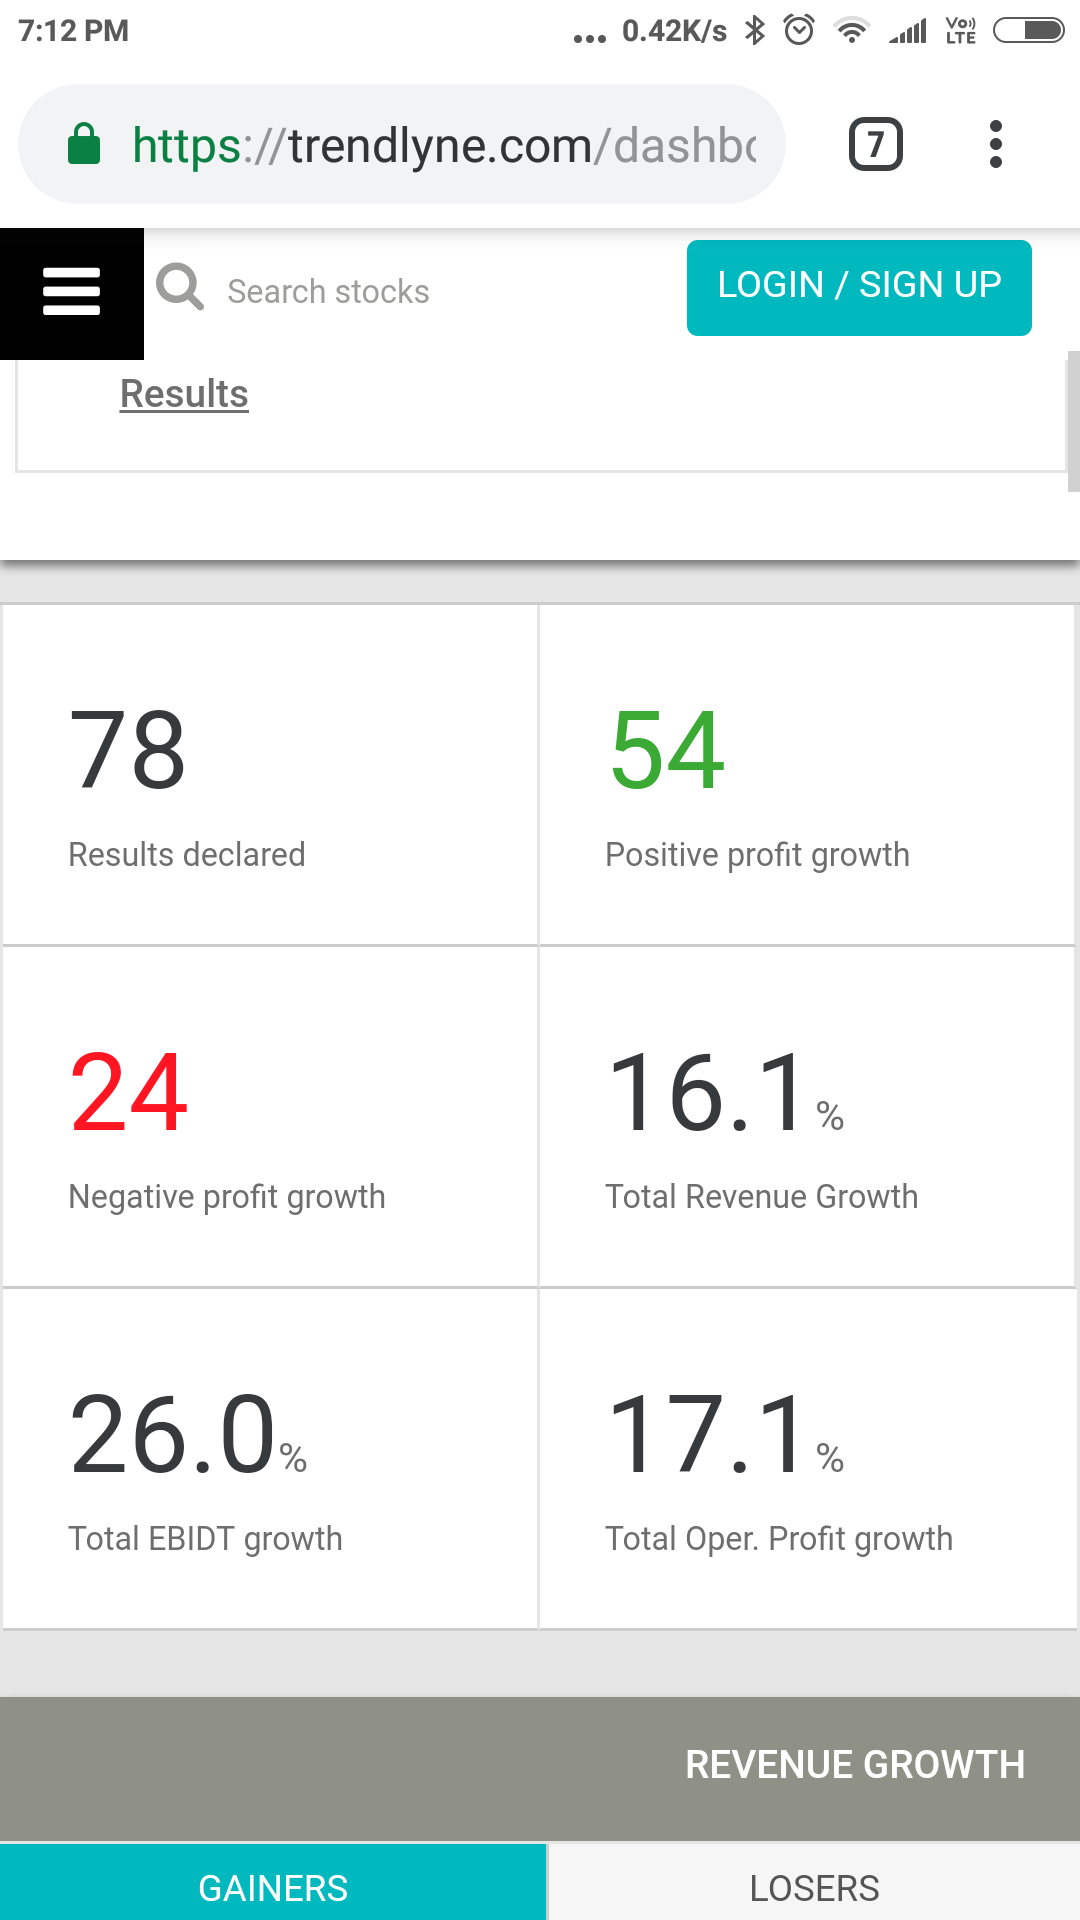
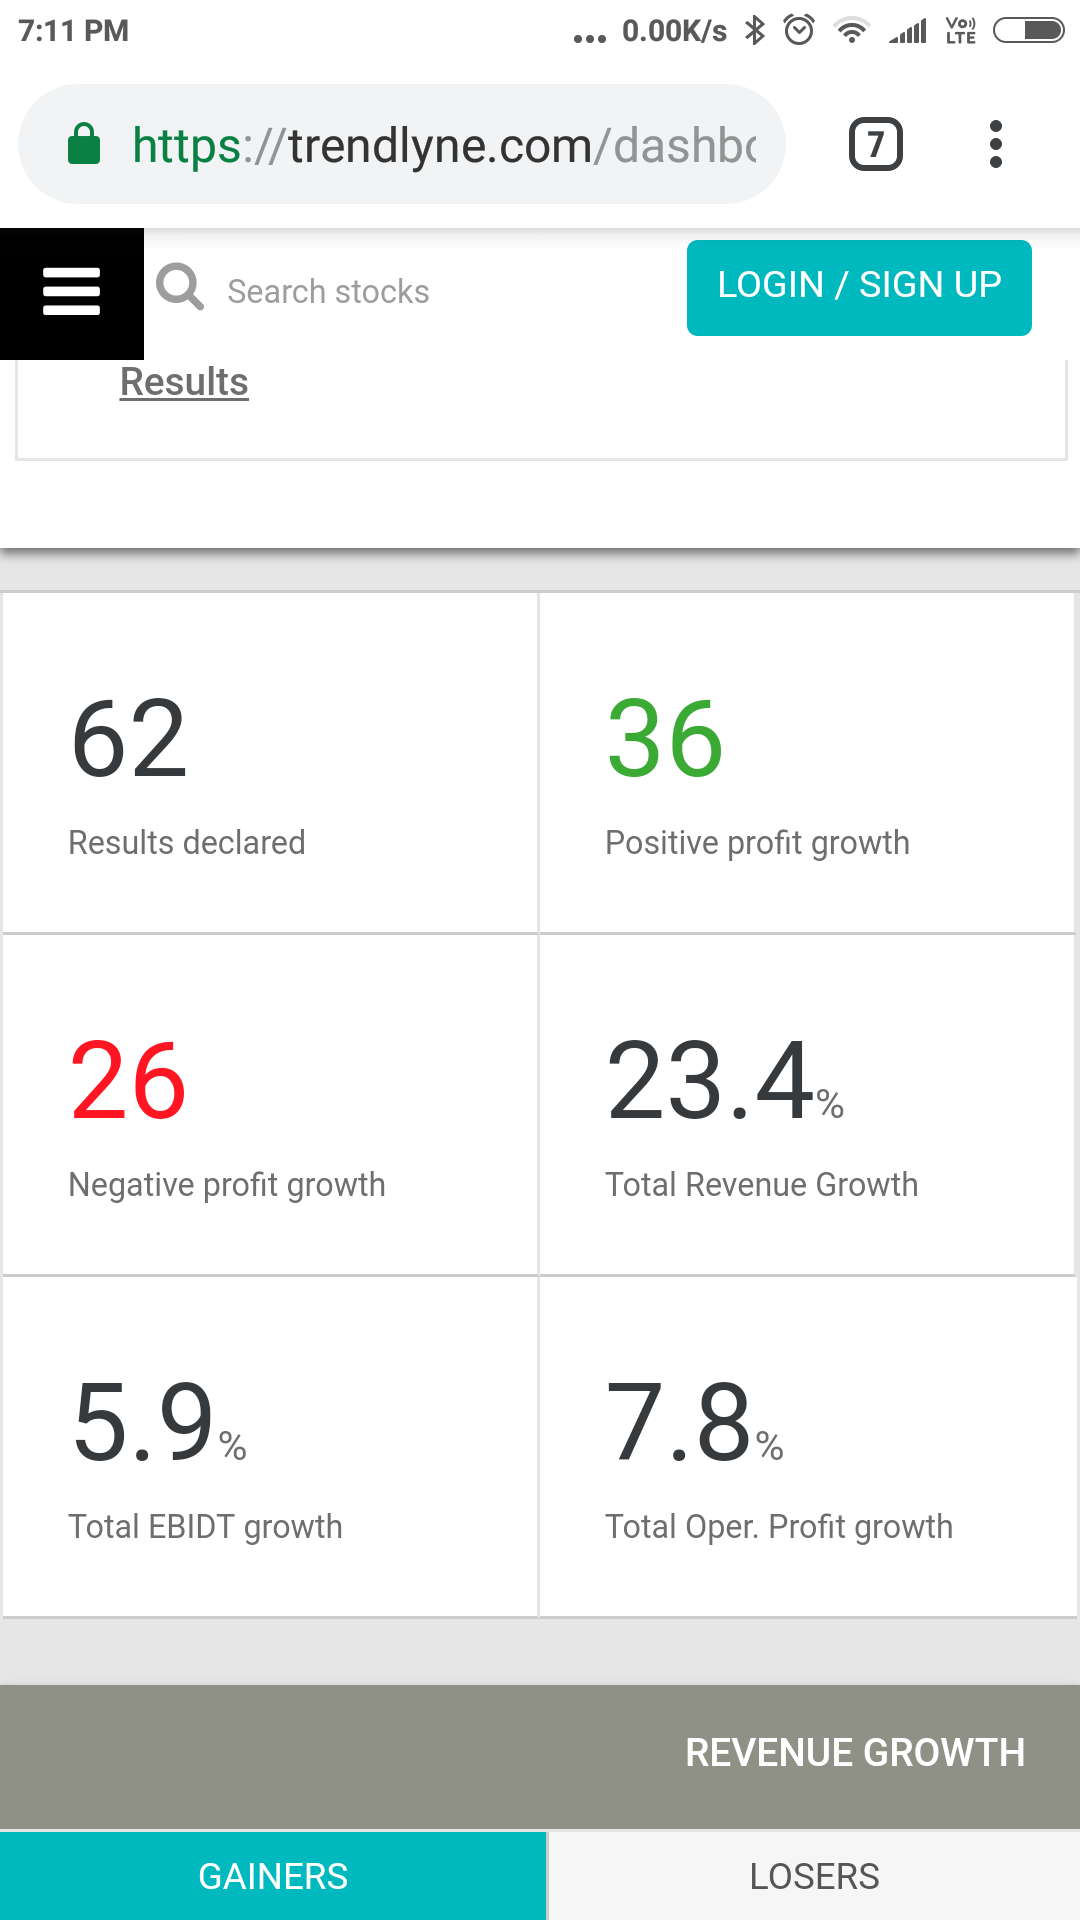
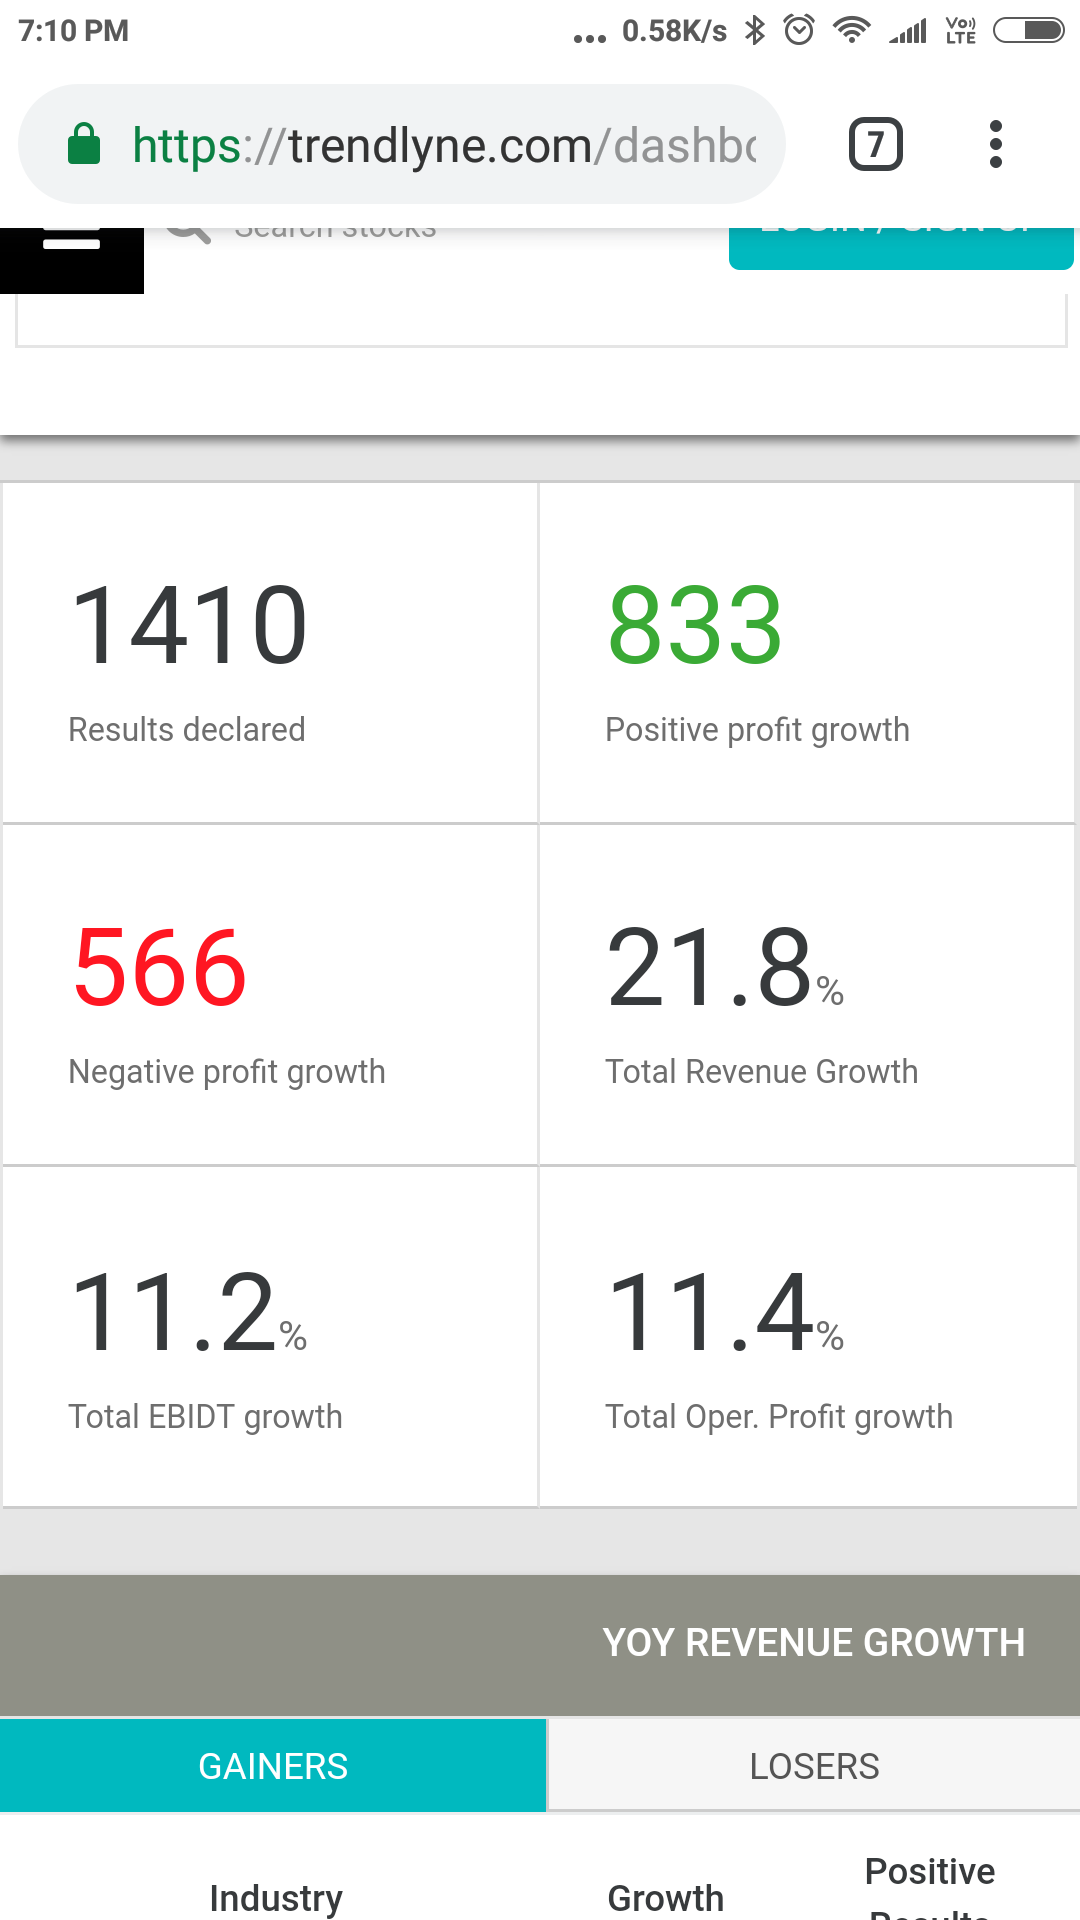
These are consolidated Q2 numbers from trendlyine site for small cap, mid cap and large cap sector . Key points
-
Small cap earnings growth as a basket has been very impressive followed by mid cap n then large cap
-
Large cap earning still struggling and overall market earning yoy just hitting double digits .
-
Looking at top 50 may give genuine concerns on growth n valuations but there are pockets which have corrected significantly n earnings ve been good and encouraging
I think more and more , the markets alpha creates will be either specialists or generalists with strong behavioral abilities. What I personally see is there r segments of fair valuation with good growth if not undervaluation and then there are segments of over-valuation . I think key lies between skimming them following a specialist approach to pick and choose opportunities OR be at the top of behavioral abilities to sit like a duck for most of times but strike big like a shark when those rare opportunities strike. To each his own but one needs to be superior at his game n process to generate alpha.
Also, would be great to double check the numbers because the way overall state of market is painted , we always ignore looking deeper into numbers slicing them but just want to be sure that numbers r right by double checking
Ridham Desai interview where he talks about PE, E & P/B and compare it with historical metrics
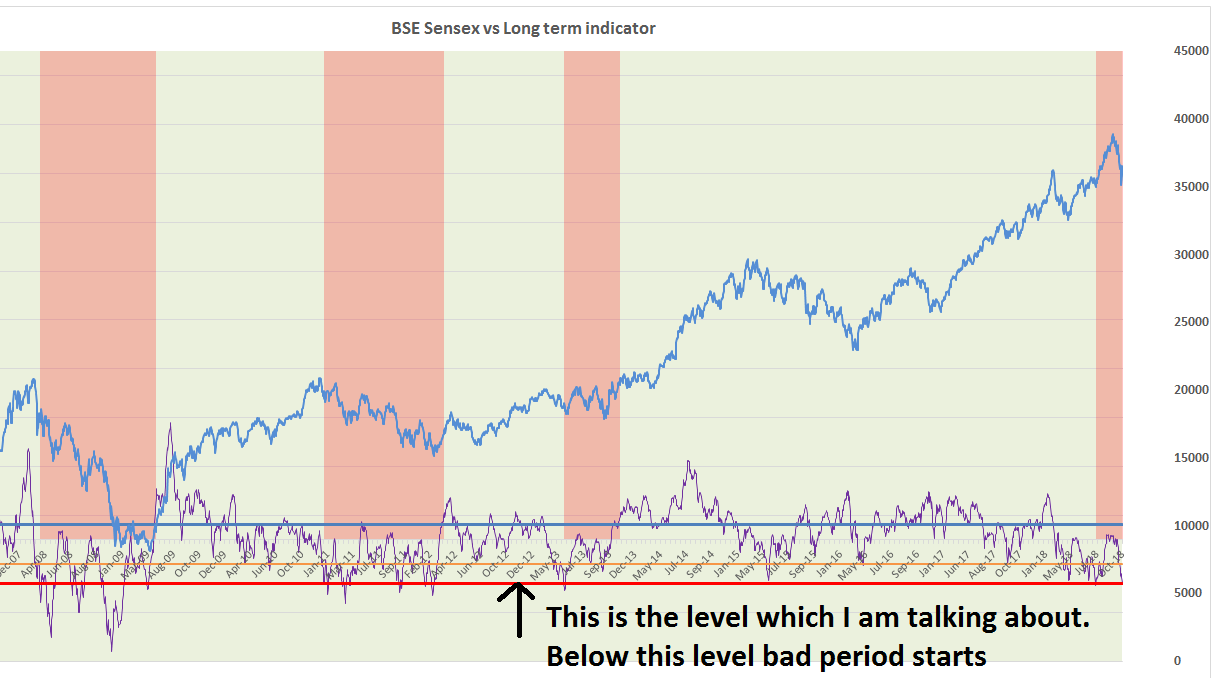
Good data points. How to interpret it?
McLallen Oscillator is down after certain level then its bad period? As you marked it in 2007-2008 by the red line. We are already below that level.
Also if you could update the current data then it would be good
Thanks
GreyCells