
AMAZING EFFECT OF FIB SEQUENCE CONTINUED
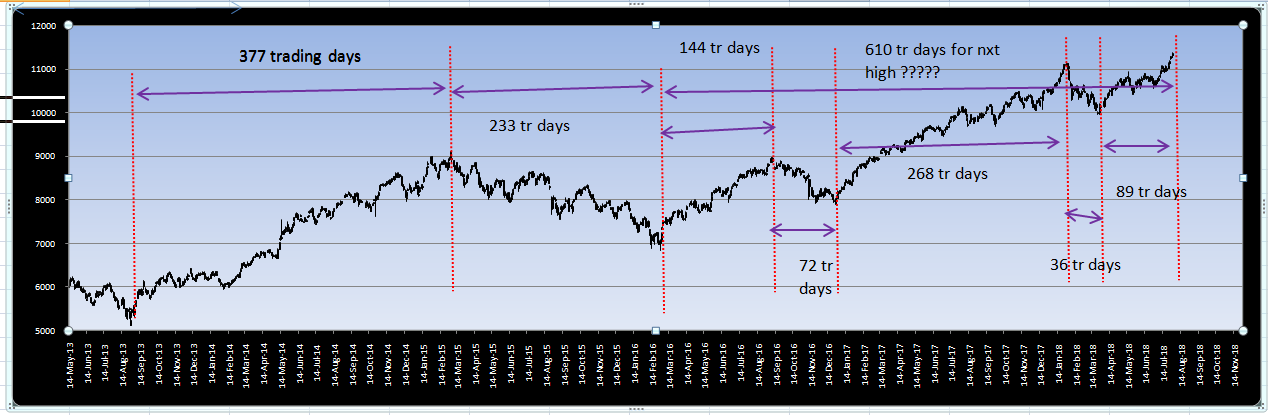
Gap between 2016 dec demonetization low and 2018 january high 268 days = 233+34 both are fib numbers
Gap between 2018 january high and 2018 march low = 36 trading days very close to fib number 34
Now august 1st week falls 89 (fib number)trading days after 2018 march low
This coincides with 610 trading days (fib number)from 2016 feb lows
The previous rally from 2013 august lows to 2015 march highs was for almost 377 trading days (fib number). The fall from 2015 march to 2016 feb lows was for 233 trading days. So as per fib time zone theory the next rally should be for 377+233 trading days ie. 610 days. 610 trading days from 2016 feb lows almost falls at August 1 st week
This coincides with a high of 28 PE multiple for Nifty. Historically nifty hadn’t survived 28+ PE multiple. This is my study about nifty PE multiple and Anatomy of bull markets