You are right. I did look at it. Many stocks show a PE of 0. That means they have no earnings, so they actually have losses. Some have very little minuscule profit but are trading at very high valuations. But in computing the index the profits and losses should be considered. Please sort by PE ratio to see what I mean.
Sorry, I saw your sorted by PE. Right, so then individual stocks will show the losses mounting up.
This is a reflection of the current state of small cap universe.
NSE does not do it I think but we should remove <50 cr market cap companies else the whole data will suffer from multiple anomalies . I was doing analysis for one of my blog posts and realised this and hence filtered out these companies from universe to make the data representable . Typical case of anomaly removal in my opinion
If some companies are loss-making, then their P/E is indeterminate (not zero). If you combine all loss-making companies, their P/E is indeterminate. If you add some companies which are making profits to the mix, the P/E is still indeterminate. If these are subsidiaries within a company making losses, it makes sense to adjust their losses against another subsidiaries profits in the consolidated statement but doing this at index levels (if at all they are doing it), is just plain stupid IMHO. It doesn’t tell if the index is expensive or cheap. It just says nothing at all and no conclusions should be drawn from it. This is a classic case of no data is better than bad data.
Actually this reminds me of something I read in “Thinking, fast and slow”.
Consider this:
SET A of a dinner set contains these:
Dinner plates: 8, all in good condition
Soup/Salad bowls: 8, all in good condition
Dessert plates: 8 all in good condition
Cups: 8, 2 of them broken
Saucers: 8, 7 of them broken
SET B of a dinner set contains these:
Dinner plates: 8, all in good condition
Soup/Salad bowls: 8, all in good condition
Dessert plates: 8 all in good condition
When asked to value these individually (single evaluation), SET B was priced much higher than A, at $33 vs $23 for SET A. Why? Because it doesn’t have anything thats defective in it.
When people compared these in a “joint evaluation” i.e both together, people were willing to pay $32 for SET B and $30 for SET A - Still higher for SET B.
But, SET B is a subset of SET A! All you have to do is buy SET A for cheap and throw away the broken pieces and you will still end with 2 good cups and 1 good saucer more for much less the price.
This comparison of index with loss-making companies is just the same thing! Throw away the loss-making companies - shutter them and this I feel is how you should evaluate them in combination as well.
Not growth but lot of small cap companies which turns from loss to profit will ve exceptionally high PE. I remember repro, majesco having 100+ PE at one point of time. Let us say the small cap universe had 20% of companies in such scenario (highly probable as 30-40℅ of companies listed ve market cap less than 50 cr ) in small cap and let us say due to this anomaly , mean PE of this 10% was 100 , it means mean PE of basket is (assume 25 pe for other 80 out if 100 companies in a stretched small cap driven bull market ) (8025)+(20100))/100 = 40. So, 20% companies inflate PE by 60% almost 3 times more . Though 100+ PE looks shocking. Let me go to my database n see PE of <50 market cap companies
@suru27 - Shouldn’t we consider weight of the stock in the index while calculating the weighted average of P/E? (If at all we are doing something of that sort and it has some sort of meaning)
Oh yes you r right . Totally forgot n Missed it. Any idea what’s upper limit of small cap marked by exchange ? If it’s more than 200-300 cr then for sure my point does not make sense at all.
@phreakv6 by the way I ve a basket of 200 companies in my watchlist on screener . I just tried to sort it in reverse order of PE n look what I saw. Not sure if these PE numbers r correct but one of big one SBI has a PE of 3000+. So, I think unless the anomalies r taken care, 100+ pe may be possible . Again lot of assumptions if screener pe is correct
I came across an interesting study on the ability of " experts" to predict the future.
In a landmark study by Mr. Tetlock, a psychologist at the University of Pennsylvania, he explored predictions of experts in a milestone 20 year study, which he published in a book called Expert Political Judgement. Tetlock interviewed 284 people who made their living commenting or offering advice on political and economic trends. He asked them to assess the probabilities that certain events would occur in the not so distant future, in areas of the world in which they specialised and in regions about which they had less knowledge. E.g.: Which economy will become the largest emerging market, will countries go to war,etc.
A total of 80000 predictions were collated. They were also asked how they reached their conclusions- by reasoning or by intuition.
There were three possible outcomes- maintenance of status quo, more of something or less of something.
The results were painful,devastating.
Experts had performed worse than dart throwing monkeys. People who spend their time, resources to earn their living, attaining expertise in that particular field performed worse than had they assigned equal probabilities to the three outcomes.
Even in the region which they knew best they were just slightly better than those who know less.
Those who are most knowledge often perform worse than others because they’ve developed an illusion of skill and the belief of their invincibility.
When participants were confronted with the results, most cited extraneous factors influencing their ability to predict. Few could admit their poor performance.
This study proves that there’s no reason to believe that those with fancy degrees, extensive experience at big funds, years of experience are necessarily better than any of us. Sometimes the results are simply due to blind luck. And,it’d be wrong to blame the experts for failing. The world is simply unpredictable. If someone tells you they’ve been very successful at predicting market moves run away from them as quickly as possible. The person mistakes his luck as skill.
Hope it helps,
Thanks to the fine work by Mr. Philip Tetlock.
Is it our hard earned money or Philip Tetlock’s money?
So if you want to read a theory and use it up to you.
We are working hard at studying the underlying data and they are not random thoughts.
The MF inflows are still strong, but you are not being provided redemption data, only the inflow data including new accounts. If you see the redemption data, you will go . The current redemptions are now crossing 50%.
Let us see how much of the SIP money now comes in the next week after salaries. Thus the wait for 1-2 weeks.
The indexes and stocks though optically if viewed from a pure “previous price to today price lens” are now lower, but most of them are still very expensive. So still do not make sense to buy. There is relative cheapness and there is absolute cheapness of prices. If this issue did not exist then buying the dip would not happen; buying the dip is done by only viewing the current price in relation to previous price. That is not the right way to buy stocks obviously.
The Nifty 500 (which is around 90% of the total market cap of Indian stocks) is still at a valuation which was only breached once before in the year 2000 and this is the second time. If one still thinks that those index valuations will sustain and this time is different, there is not much more another could say to them. We are still in a very expensive stock market.
This is not random calling of prices are high or prices are low or wait or buy. There is sense to this madness.
I am referring to current March data not yet officially published but being publicly disclosed by fund managers. Sorry, please don’t ask for source but you can look it up. Should get the info.
Dear @valuestudent,
You seem to have misunderstood the conclusion of the study. The sole conclusion of the researcher was that experts err more often than not. The world is simply unpredictable. You’re free to assess the data, perform number crunching but that in no way will improve your ability to predict market movements. We usually suffer from the fallacy that more information improves our ability to make decisions. Not always. More information improves our confidence not accuracy always. And, confidence is the coherent story your brain has concocted. Motion doesn’t always lead to progress. It doesn’t need an expert to say that markets will crash after a massive bull run. Even I know it as a beginner. It simply is regression to the mean. What goes up will reverse to the mean and what goes down will reverse to the mean. It’s a rule of nature. But, can we predict when that regression happens- Unequivocal no.
If assessing numbers would have improved our ability to predict market moves, fund managers would have done well. They have access to the best talent, latest information. Yet, they fail often. We don’t know what’s discounted by the market. Only time will tell. We can make educated guesses all day, yet we wouldn’t be one step closer to the truth. Because markets are the complex whole of emotions, cognition. More often than not, we are driven by emotions. Cognition is just our post hoc rationalisation for our decisions.
I was only having fun and mentioning to Vasu that his dream has come true.
All of what you said above is because you are saying “you cannot predict” you need to learn the value of patience. You are right, no one can predict. I have personal experience of that but you can prepare.
There is no one forcing you or me or anyone to invest at all points in time and at all prices. We can simply wait for the fat pitch which comes along once in a year or two. If you cannot hold onto cash for 12-18 months then patience is the only art to master.
Anyhow, cannot discuss this further. Wish you the very best in your investing journey.

 . The valueresearchonline links I provided are not the one’s displaying a PE of 350. Those are just links to get to view the stocks from the respective index. The PE data is from NSE website directly:
  (8025)+(20100))/100 = 40. So, 20% companies inflate PE by 60% almost 3 times more . Though 100+ PE looks shocking. Let me go to my database n see PE of <50 market cap companies
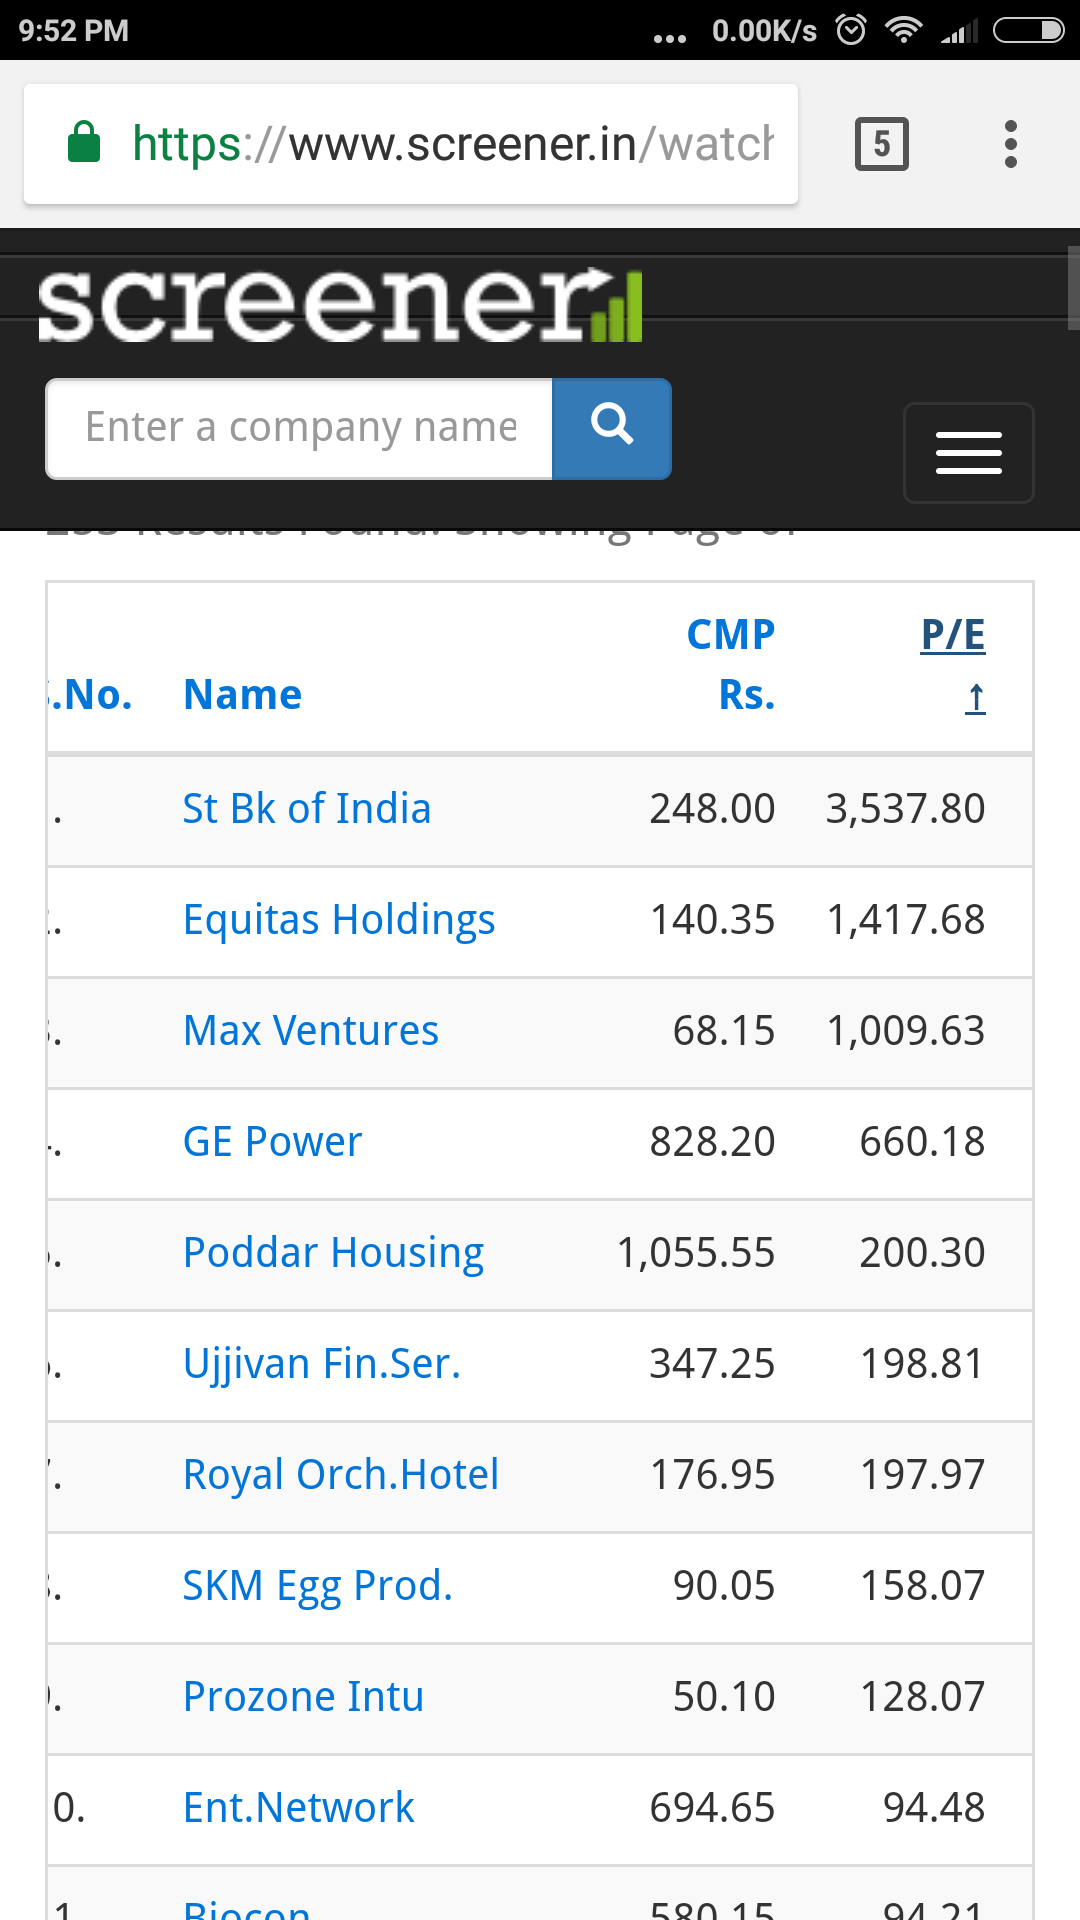
 . The current redemptions are now crossing 50%.
 but you can prepare.