
Brilliant article to understand why predictable FMCG companies trade at high PE despite moderate growth. Also, why some overvaluation is best ignored by long term investors.
3 Likes
The famous buffet Indicator. MCap to GDP ratio: Whom to belive
Bloomberg says that Mcap to GDP ratio has crossed 100% where as gurufocus says that it has only reached 66%. Can any members in the forrum
put some light???
https://www.gurufocus.com/global-market-valuation.php?country=IND
66% seems to be too low. Close to 100% appears more accurate unless they are trying to exclude holding company mcap to avoid double counting
Our MCAP-to-GDP ratio is ~89% currently.
Total MCAP of BSE listed cos is 145.75L cr as on March 5, 2018
India’s GDP would be ~164L cr (+/-3L cr) at the end of March 31, 2018
MCAP source: https://www.bseindia.com/
GDP source: http://www.imf.org/external/pubs/ft/weo/2016/02/weodata/weorept.aspx?pr.x=55&pr.y=8&sy=2000&ey=2021&scsm=1&ssd=1&sort=country&ds=.&br=1&c=534&s=NGDP%2CNGDPD&grp=0&a=
5 Likes
Guys,
isnt there a flaw in market cap/gdp theory?. because GDP will have a lot of unlisted companies.
1 Like
To some extent yes. But also look at other way : Holding companies which leads to double counting of mcap. e.g. HDFC Bank contributes a significantly to HDFC mcap also. So effectively it adds to about 6 lakh cr to BSE mcap.
2 Likes
Here’s a good resource to determine valuations and performance of each sector before drilling down to individual stocks in that sector: https://www.indiainfoline.com/markets/sector-overview/
Valuation: https://www.indiainfoline.com/markets/sector-valuation/
Performance: https://www.indiainfoline.com/markets/sector-performance/
4 Likes
when all the global markets are going up…India for sure has under performed all markets i think in 2018…what may be the factors behind this? LTCG selling to book profits before march? MSCI warning of not sharing data to SGX Nifty from 6 months now…any other factors ?
Nifty 50 moves in tandem with global indices as can be seen from the chart below.
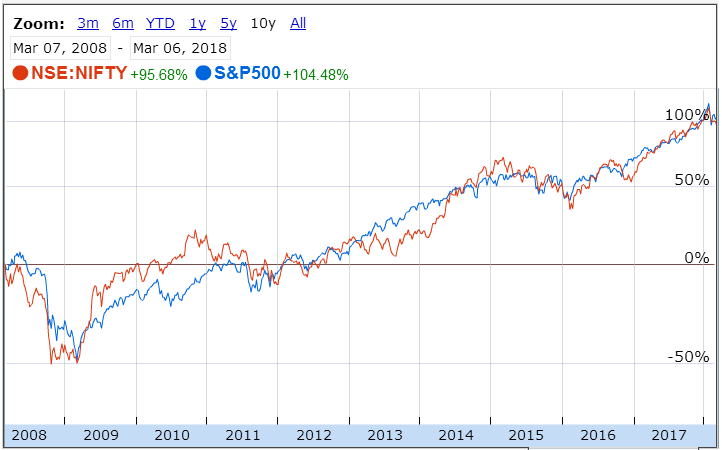
Source: Google Finance
The only time our index moves away is when there is some India specific event like general election or demonetization. Even then it catches up quickly.
Looking at PE ratio of such an index and making decisions based on that may not be optimum since earnings are driven by domestic factors while price is driven by global factors. Yes, large caps do have a sizable export component but domestic economy does play a big role in earnings.
Perhaps a better index would be a small or a mid cap index as most of the VP members invest in small and mid cap stocks. However, PE ratio of NSE Small Cap Index is 90 and that of Midcap index is 51.
9 Likes
Another great article from Lindselltrain. Why high RoE companies are generally good buys despite high valuation. Rings “ITC” bell in my mind
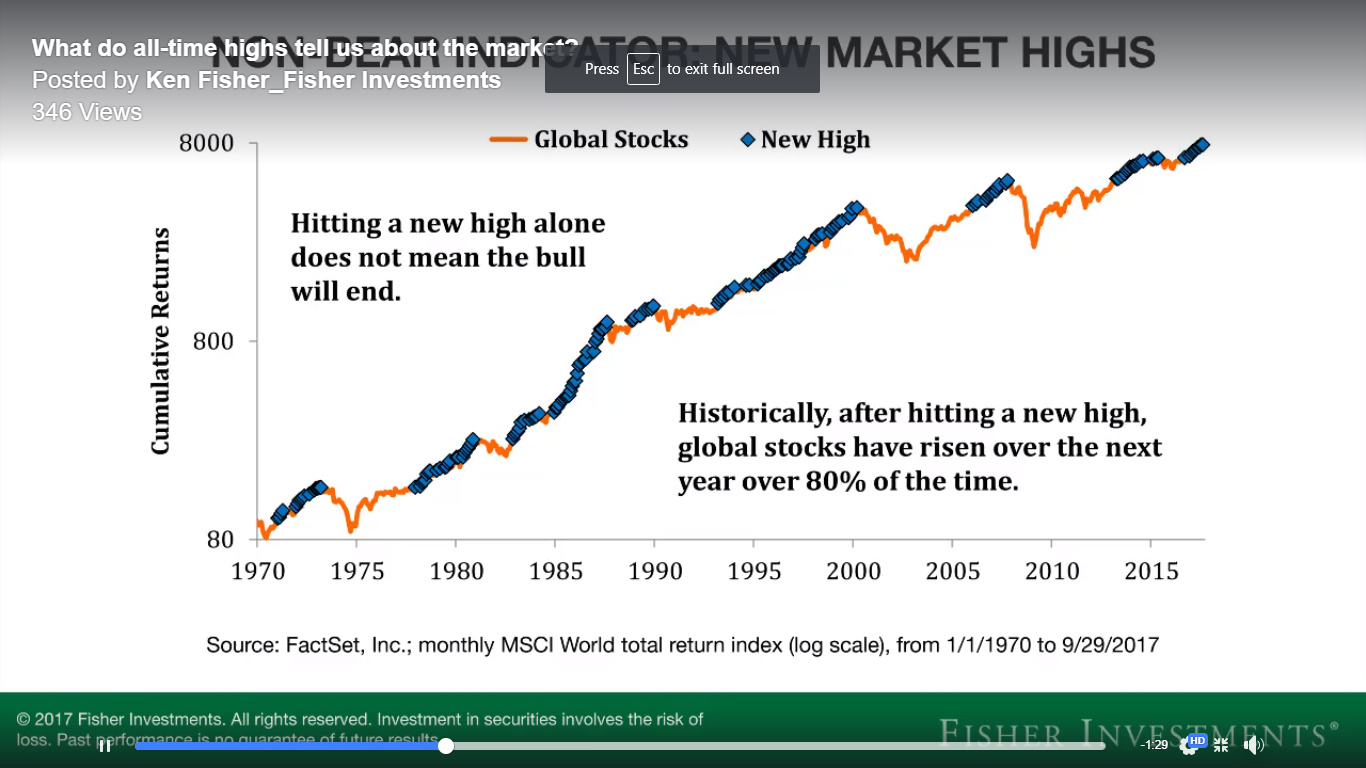
From Ray Dalio: Why India is great investment for a decade and why worrying about 2008 type of meltdown is futile…
9700-10200. This shopping range has just come into play today.
8 Likes
1 Like
Shopping range came into play again.
1 Like
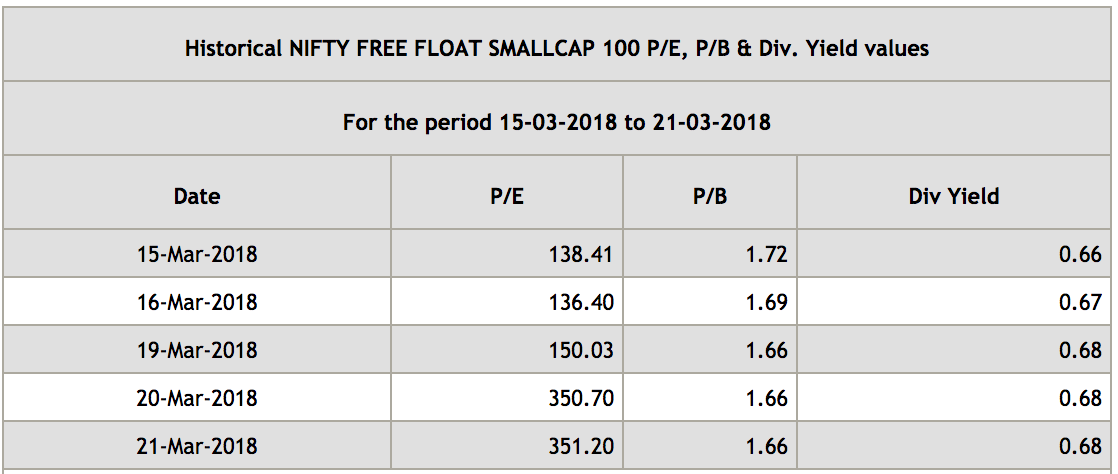
Update to the Free Float Small Cap 100 Index… what a number ![]()
Sure. There can be no correction from these levels. It is all due to growth that is coming soon, literally anytime. Correction is over. Are we really counting on it. Not me.
2 Likes
Any idea how can PE change from 136 to 150 to 350 in a day? Do the stocks in free float smallcap index keep changing everyday? I dont think any companies are announcing results OR stocks are climbing that higher.
Hi Tushar. I cannot say with a guarantee, but the most probabilistic answer is that earnings of last quarter are now updated and reflected. So many companies do not change in an index for that to be a reason.
Bullish on earning growth 
Here’s the link:
Free Float Small Cap 100: https://www.valueresearchonline.com/stocks/StockSelector/default.asp?index=173
Free Float Midcap 100: https://www.valueresearchonline.com/stocks/StockSelector/default.asp?index=91
Most of the stocks on the small cap index are near 52 week lows, and earnings are not growing but in fact earnings have come down.
https://www.valueresearchonline.com/stocks/StockSelector/default.asp?index=173
If you sort by P/E in that only 5 stocks out of 100 are even over a P/E of 100. What am I missing? How is NSE data showing P/E of 350 for free float smallcap 100 index? It doesn’t even remotely make any sense that P/E would jump from 150 (already ridiculous) to 350 in a day. Shouldn’t we first just see if the numbers are plausible at all before jumping to conclusions?
1 Like