
Below are the NIFTY50 historical charts illustrating P/E, Dividend Yield and P/B (high and low) levels.
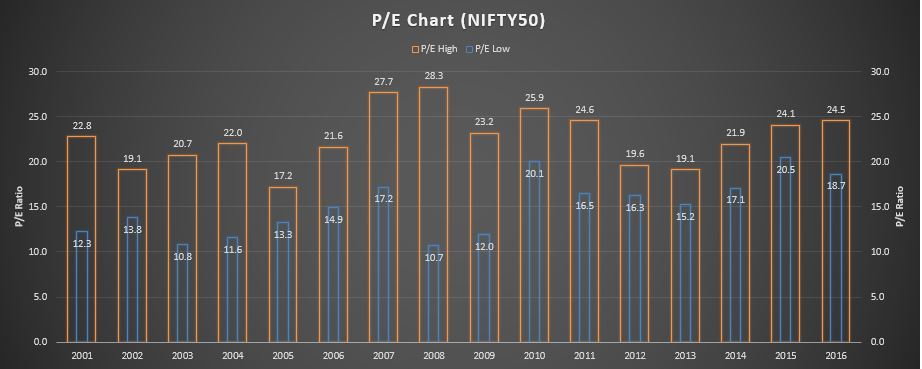
This NIFTY50 P/E has standalone v/s consolidated numbers issue. See Nifty PE after all earnings have been declared for more details. Market has traded at >17 P/E for last 3 years. If waited for <17, then would have missed Feb 2016 and Jan-Feb 2014 entry points.
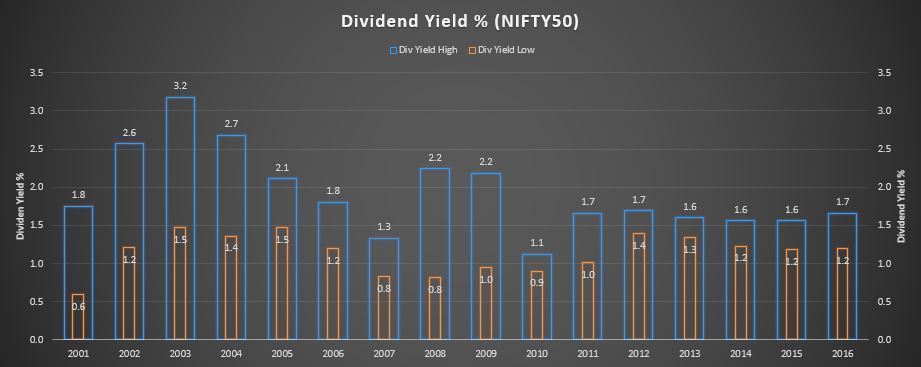
Thanks @vasuadiga for highlighting >1.6 Dividend Yield level. Seems usable in current market. Curious - How do you calculate market-wide Dividend Yield? The above chart is for NIFTY50 Div Yield.
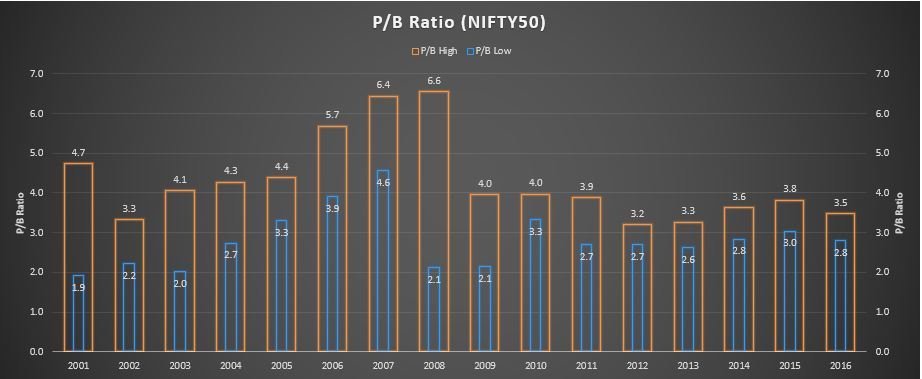
@kb_snn - Is the P/B range in your post giving correct buy signals? Seems tweaking needed.