At the outset would like to thank founders for creating such a valuable forum and the multitude of boarders who have contributed and enriched it. I have been amazed at the enthusiasm, wisdom and deep insight shown by everybody including Ayush, Donald, Hitesh and the other ‘regulars’ to ensure that the ‘wheat is separated from the chaff’ in a professional dialogue.
This is my first post. Hope it is in the right section and follows all rules.
These are 5 stocks from my 21 stock portfolio that I have built over the past few years.
Initially being naive, I bought and further added quantities but also sold periodically to cover my total purchase costs. As you can see the net purchase value of four stocks is negative while one is approaching zero.
For past few months, I have been trying to learn how to measure portfolio performance but am not sure how to calculate returns for those stocks where net purchase value is negative. Can someone please guide me.
Sr.No Company Wt % Net Purchase Value Last purchase date
1 Piramal Enterprises Ltd 13.69% -15.2 23-04-02
2 Exide Industries Ltd 10.60% -66.9 03-07-03
3 HDFC Bank Ltd 10.29% -37.2 07-05-08
4 Whirlpool of India Ltd 8.36% -302.9 03-02-05
5 Cummins India Ltd 4.59% 12.1 16-01-03
Measuring portfolio performance is vital and from whatever I read, I have veered to believing that a good number of us do not measure how well our financial assets perform over time. We measure either performance of individual stocks or on a pool of changing capital which is incorrect if you are measuring how much your wealth is growing via investing alone.
So I think your question on measurement may sound deceptively naive but exceedingly important. My suggestions are as follows:
Define the pool of capital whose performance you are trying to measure along with a start date. There is a temptation to change the date over time; avoid it.
Adjust the capital for any external additions or depletions. This is where I differ from most measurements. This adjustment is often critical when measuring short term returns. What I do and I read others do from various magazines will take a longer post and we can take it offline
Adjust the capital for internal additions like dividends, splits and others corporate actions.
Measure the fair value of this capital at the end of the period, say end of quarter or even a year. Typically this will be the market value of the stocks (assuming all are listed). Please do not measure it more frequently as it will create only false excitement and stress
Find out the compounded growth of the capital end of the period vs the beginning; the period should be atleast a year otherwise you will be getting results that do not matter at all.
So in this process net purchase value etc do not directly come into play as I understand your query. If I have misunderstood then just pm me and we can talk.
Measuring Portfolio Performance - Do it like a mutual fund
There is an old Chinese saying which says “what cannot be measured cannot be improved”. I have thought about how I invest in the markets. As I get a monthly salary, I tend to put money into the markets also in monthly tranches.
After a while it is difficult to measure the returns that I have got from my portfolio as a whole and not from individual stocks. All the websites that are out there that I have used does not really give a true picture of portfolio performance because it tracks the current holding and provides the percent gain or loss. I looked at various softwares, websites and did not find anything that actually helps me in doing this. So, I built a rudimentary spreadsheet in Microsoft Excel which helps me track my portfolio as a mutual fund on a NAV basis.
If you want you can use a similar concept. The concept is fairly simple and straightforward. The initial amount you start off with, say, Rs 1000 is your initial capital. Take an arbitrary face value (I chose 10 more out of convention, you could take 1 or 100 or whatever number takes your fancy). The number of “portfolio units” you allocate yourself are calculated by the total portfolio value divided by the face value (in this case, 1000/10=100 units).
Once you have the basic framework in place, it becomes easier from here. Every time you put money in your stock account, just calculate the number of “portfolio units” you would get. For example, if your initial capital of Rs1000 has grown to Rs 1200, your NAV would be 1200/100=12 (portfolio value divided by units equal new NAV). So, if you add Rs 60 to your portfolio, you will get 60/12=5 more units. So, you will have 100+5 units. So, your portfolio would be now 105*12=1260.
Keep track of a benchmark index if you are interested to know if your stock picking skills are good enough for you to continue at it. Over a period of time (not less than 3 years) if you are not doing better than the index, it is probably better to get out of managing your funds and hand it over to a mutual fund or an exchange traded fund (ETF).
Since Jan, I have started measuring the overall portfolio performance based on the above NAV concept. Fortunately had records of purchases/sales and portfolio values at various points of time in the past and thus have worked out a current NAV.(albeit with some approximations).
But let me see if I can use this concept to work out individual stock related returns.
Hi. Can you expound a bit? If your pf value has grown from 1000 to 1200 and you add 60 of new purchases, then the pf value is straightaway 1200+60=1260. Why go in roundabout way to calculate by dividing and multiplying by units?
As an aside, i use an excel sheet to plug in my buys and sells (positive and negative cashflows) and use the XIRR function to calculate the internal rate of return of the pf. This is a more accurate measure than CAGR because being salaried i always have fresh money to invest from my monthly income. Plus IRR takes care of the effect of buys and sells.
Vinay, NAV based approach is used to calculate how many new units your additional 60 Rupees would get.
Think of it as equity dilution scenario.
You have 100 shares worth 10 each initially which comes to 1000. Now the PF value has grown to 1200 so each share is worth 12 now. You want to infuse additional money of 60 Rupees. So your 60 Rupees will get you 5 shares. Now you hold 105 shares and each share is worth 12 Rupees.
Abishek’s blog link listed above explains the philosophy of using NAV based approach…If you want to understand the calculations better go through Rudra’s blog lsited below:
Is NAV approach better than XIRR? XIRR based approach is very simple - just need transaction dates and buy/sell amount. One can also add dividend details by showing withdrawals.
XIRR is for calculating returns based on cashflow. So, you need to have either a cash inflow / outflow from the portfolio to determine it. The last portfolio value can be used for the calculation as well. What XIRR lacks is the ability to track interim portfolio returns where no cash inflow / outflow has taken place. So, XIRR will not be able to tell you how your pf has performed, say, every year, or YTD. You will only get a overall return % from the start till date.
Need Your Help.xlsx (25.5 KB)
Attached is a model template that I use for calculating my portfolio returns based on XIRR. I have tried to calculate the return based on the date of each individual investment and also accounted for all re-investments made.
Would appreciate everyone’s views. Please let me know if any flaw with this methodology. Thanks.
Your sample table should give 193% return. From first table, remove all the deposits … just keep the transactions and in last row after transactions put the value of your portfolio and the date. XIRR should now be applied.
Thanks for your view. The reason that I have arranged the table that way is to account for the re-investments made from stocks that have been sold, there by also solving the problem associated with realised and unrealised gains.
"The shortcomings of XIRR originate from the fact that the formula considers both realised and unrealised gains, and it shows returns assuming that any money taken out earns a similar return. Say, you withdrew half of your investment at 50% gain a year ago and today the remaining investment is at a lower gain of only 25%, the XIRR will show a value between 25% and 50% even if the money still invested isn’t earning that much."
I am not sure XIRR works like that as stated in livening. Take a scenario:
1-Jan - amount invested 50,000
30-Jun - Amount double to 100,000 and you takeout 50,000 so you show a transaction of -50,000
1-Jan next year - remaining amount 50,000 grows by 50% so PF value is 75000.
XIRR returns 235%
If XIRR assumes money taken out earns similar return then the above scenario internally by XIRR should have transaction like this:
1-Jan-15 50000. ---- initial investment
30-Jun-15 -50000. — 50,000 out of 100,000 taken out
30-Jun-15 50000. — per livemint XIRR should assume 50,000 is again invested and should double in next six months
1-Jan-16 -175000. — PF value - reinvested amount should double so 100,000 + 75,000
In this scenario XIRR returns 250% which is not same as first … so I guess assumption “that any money taken out earns a similar return” is not correct.
Am attaching a sample working sheet that is based on the NAV calc method indicated by Abhishek and elaborated in different ways by Rudra and Harsha. My sheet is still work in progress as have not used additional formulae. Also this is for a dummy stock. An added twist is the issue of bonus shares.
Is the stock CAGR calculated in the cell highlighted in yellow (L11) correct?
Please advise.
Again many thanks to all for the information and help.
Wanted to point out a couple of caveats in understanding these returns based on the excel spreadsheet.
Cell L5 shows a 53% annualized return over a 14 day period. 53% is a whopping figure till one realizes that the time period is too short. This tells us that even a small tick over a short duration gets magnified when extrapolated to a year. It gets magnified not only because it get multiplied by 365/14, but also because this multiplication gets compounded. It is the same as why a 10% return paid quarterly is superior (10.3813% annualized) to 10% return paid annually (10% annualized). The consequence of this mathematical quirk is that returns over a short duration can get misleading.
Returns computed this way may also mislead if capital injected has a wide variation over time. I have attached a sample working on the same excel using the same methods. Look at cell I 16 to S 20 in the attached. Say I inject Rs 100 in Jan 01, 2001 and Rs 100,000 on July 01, 2001 for the same stock at a 10% higher price. Let’s say I measure this portfolio on 02 Feb 2002`when the stock has moved 20% from Jan 2001. Applying the formula will give you an annualized return of 18.2% on an investment of Rs 100,100. This may give someone the impression that you have actually earned Rs 18,218 on a total outlay of Rs 100,100 (which is ~ 18.2% * Rs 100,100), whereas you have actually made a gain of only Rs 9,210.91. Let’s take this further down to 01 June 2002 when say the price falls back to what it was on July 01,2001 and you carry out the measurement again. The same computation will now give you an annualized return over the period of ~7% again giving the impression that you have earned ~Rs 10,010, but you have actually earned only Rs 10 (Rs 100,110-Rs 100,100)!
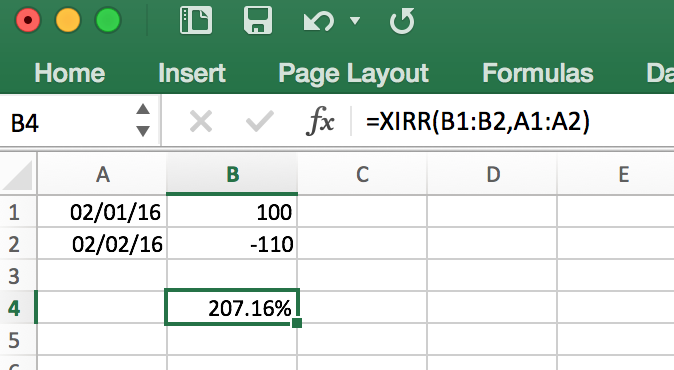
In my excel if i enter 100 as cash inflow on 2nd Jan and 110 as cash outflow on 2nd Feb and if I use XIRR function I get the value as 207% whereas i expect 120% because 10% for a month * 12 = 120%
Is my assumption wrong somewhere or I am missing something in XIRR?
If i wish to use NAV based approach since the time when i started investing does that mean i will need to also have portfolio stock prices for each individual days when trade was executed?
And if i sell any stock and take the cash for personal use, then i should calculate the nav units based on amount withdrawn and reduce those many number of units from total units right?
That’s because XIRR calculates by compounding this every month, i.e. end of month 1 you get 110, which is compounded to 110 + 110*10% = 121, and then another month etc, end of year 12 you will have a 200% odd return, which is the number returned by the XIRR function.