
ideally , yes as quarterly chart concurred also in feb 2010. I use stochrsi and not plain stoch. also filter trix to 7 setting. 14 months trail is too huge for a monthly chart. Better to use multiple range charts before arriving at any buy level. If monthly says buy or quarterly and we are convinced we “WILL” buy the stock, then weekly and daily may offer some advice on some 4-5% extra dip that can be capitalised upon too !! Good that you are trying things out. If StochRSi is not there on ur software, possible you may have Stochmomentum. That too works well. Hence a 250 type entry in Feb 2010, would have doubled your money by Feb 2013.
U missed the point which i wanted to convey with the chart, I just wanted to point that for missing out on 20. -40% gain, u r buying too early. Btw I don’t use Trix i put there just for your observations and stochrsi is there in my chart.
I didn’t miss the point. Seems the reverse. I had said with experience, you get used to how the indicators will behave using different time frames. If i follow too much textbook rules, etc 20-40% late entry will be there which i choose not to miss out on. It can be a personal choice also to buy on further confirmation at higher price. For example i mentioned how Glen is looking the best by both monthly and quarterly. If you take a view now at Glen weekly and daily, you will see a screaming immediate buy for shorter term targets which will only justify a monthly or quarterly entry. You may observe Glen from yesterdays daily candle from a 600 entry for educational purposes. Track next 1-2 weeks move.
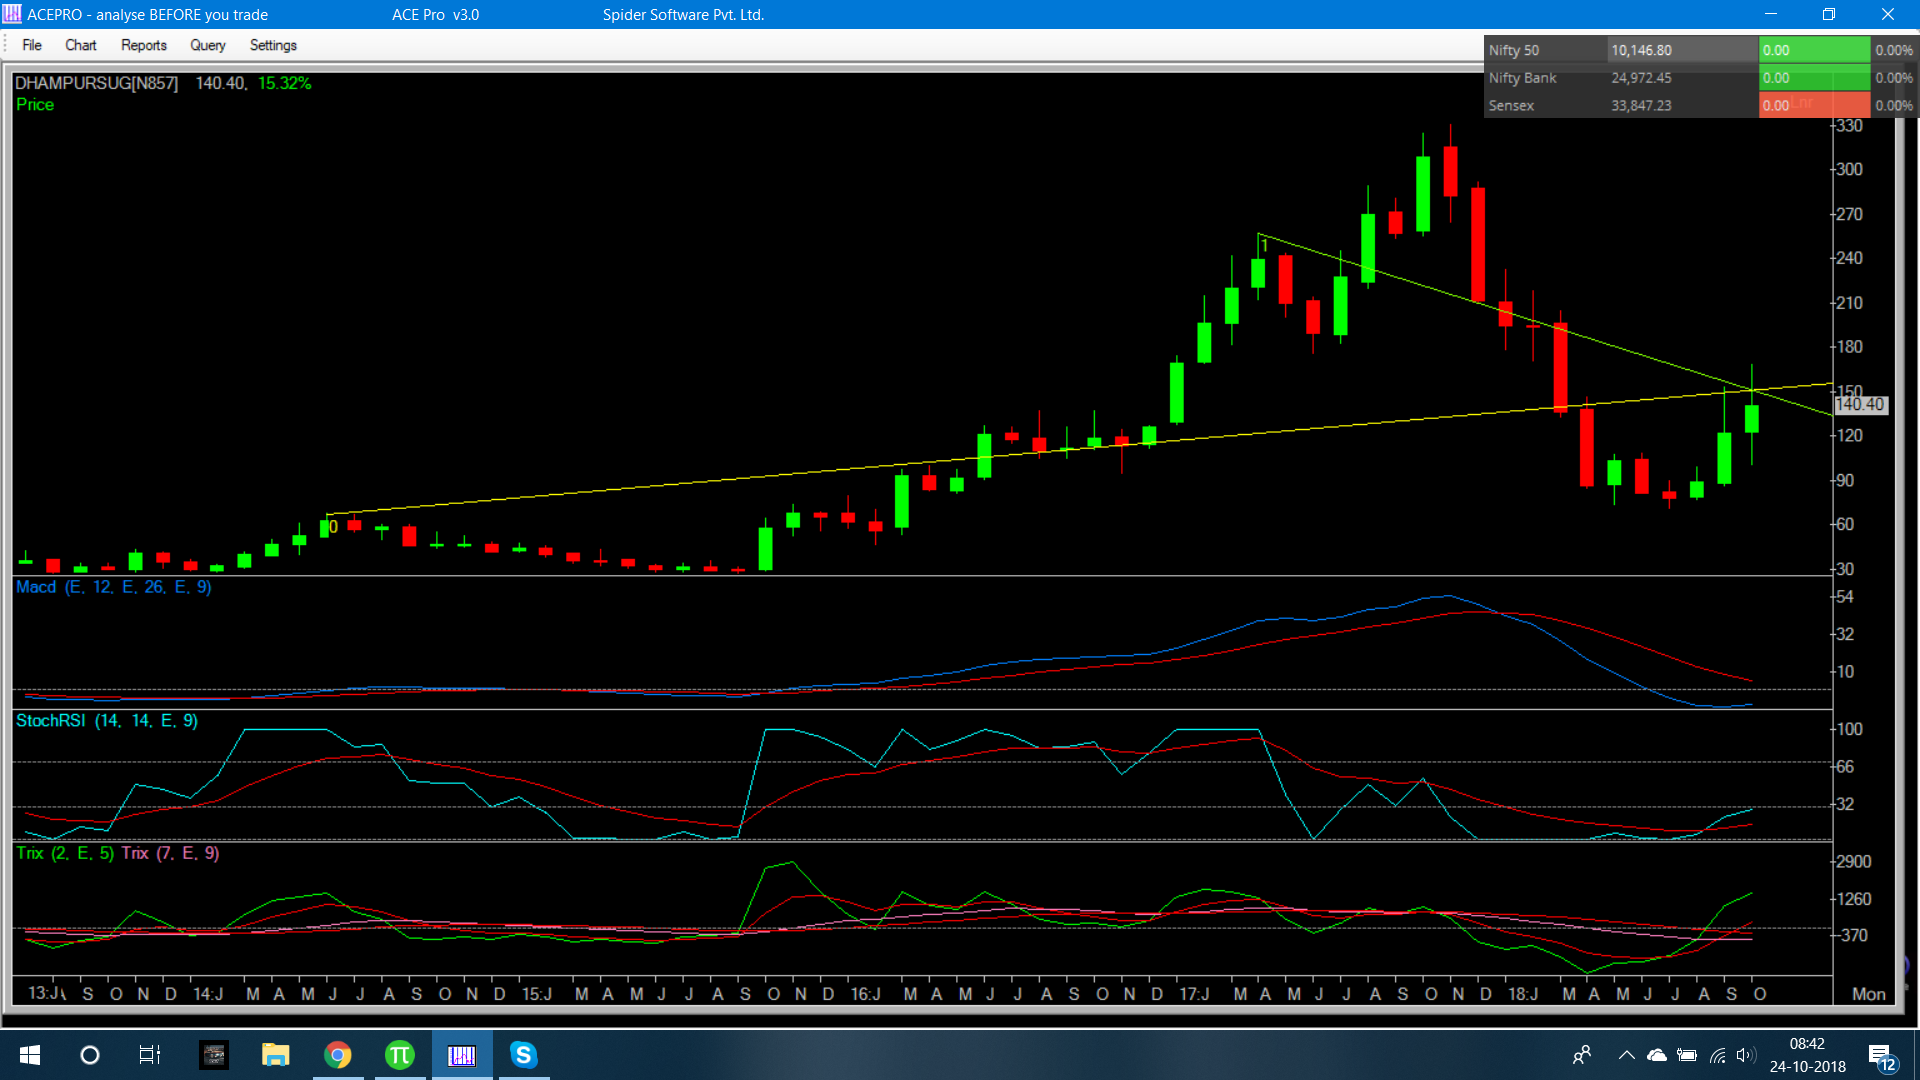
Another sector i would like to point out today is the Sugar sector. After giving up 100% gains of 2016 rise after breakout, this sector now seems to have made a bottom with indicators looking very favourable for the next year and more. The better ones of the pack seem to be :
Dhampur sugars. Well poised monthly indicators and very promising quarterly indicators make this one a great pick. Once jan 2010 high of 158 clears, stock can gain superb momentum. Already volumetric accumulation is seen from 104-10 levels and the stock having doubled price from 80-160 in few months. Convergence point re-test and clearing of the 2 trendlines can provide impetus.
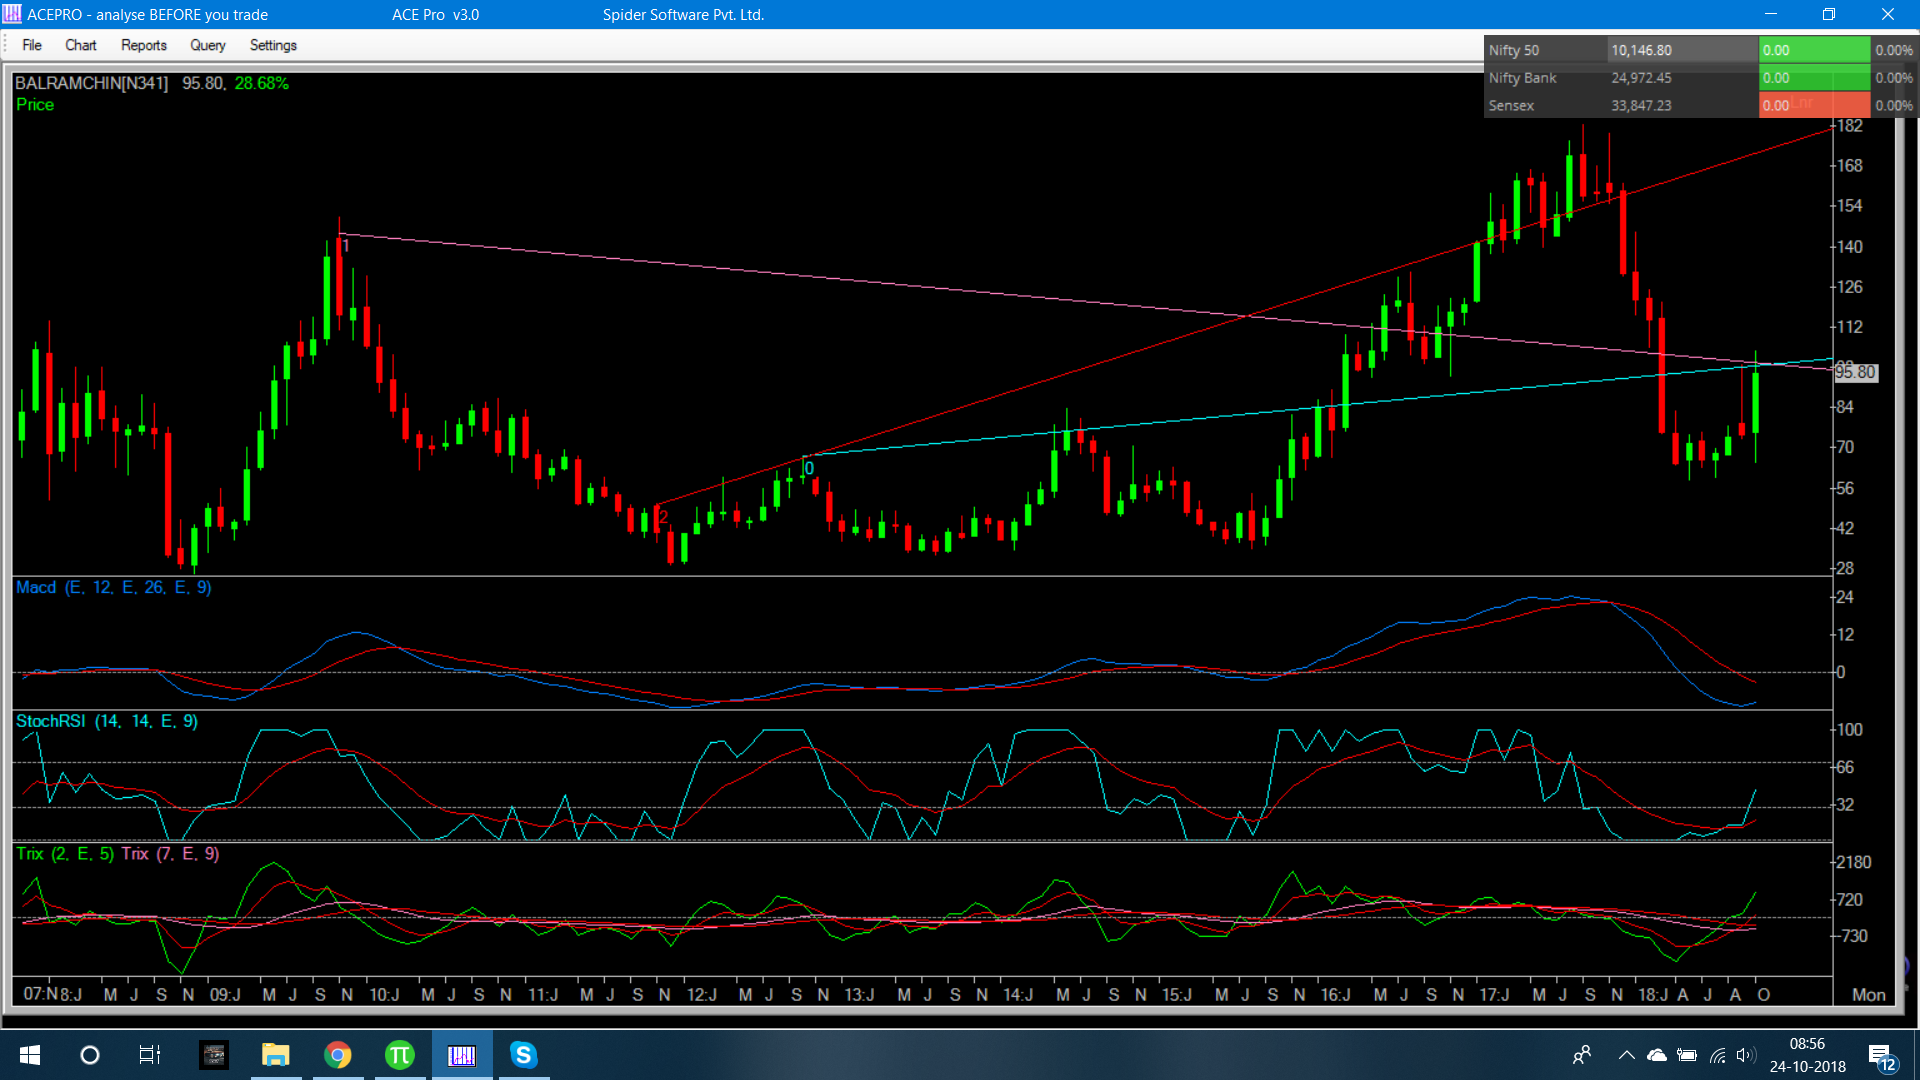
The next would be Balrampur which also has similar structure. Re-pricing of ethanol has given the sector much awaited news now reflecting on charts. Crossover of blue and purple lines suggests breakout point and red line would signify expected movement.
3 Likes
a few stocks which are bullish on Mark Minervini set up and which can perform well in case there is a good pull back in Nifty in November are
Aurobindo Pharma
bang Overseas
sakuma
Universal cables
Biocon
naukri
Astrazenca
Carborandum
CGCL
Glenmark
FEL
JK paper
orient paper
west coast paper
ICICI
ITC
IPAPPM
Orient refr
RMCL
Torrent pharma
Draw the appropriate breakout lines on daily charts and buy on close above the breakout lines…and follow an appropriate stoploss system…market is too volatile and stocks are just breaking down, so an early exit in case of breakout failure is recommended
3 Likes
As the objective of my msgs was to identify stocks at lows and use TA to make a good entry, brings me to another aspect here. Along with index, most stocks have been battered to yearly (multi year) lows besides sectors like sugar and pharma which were down even when indices were up. Many of us may find charts excellent now or valuations cheap. So,…should we buy now??? Can we sink more…? To analyse this, let us directly analyse some indices to see where they can go, and if so, what may be effect on stocks from here.
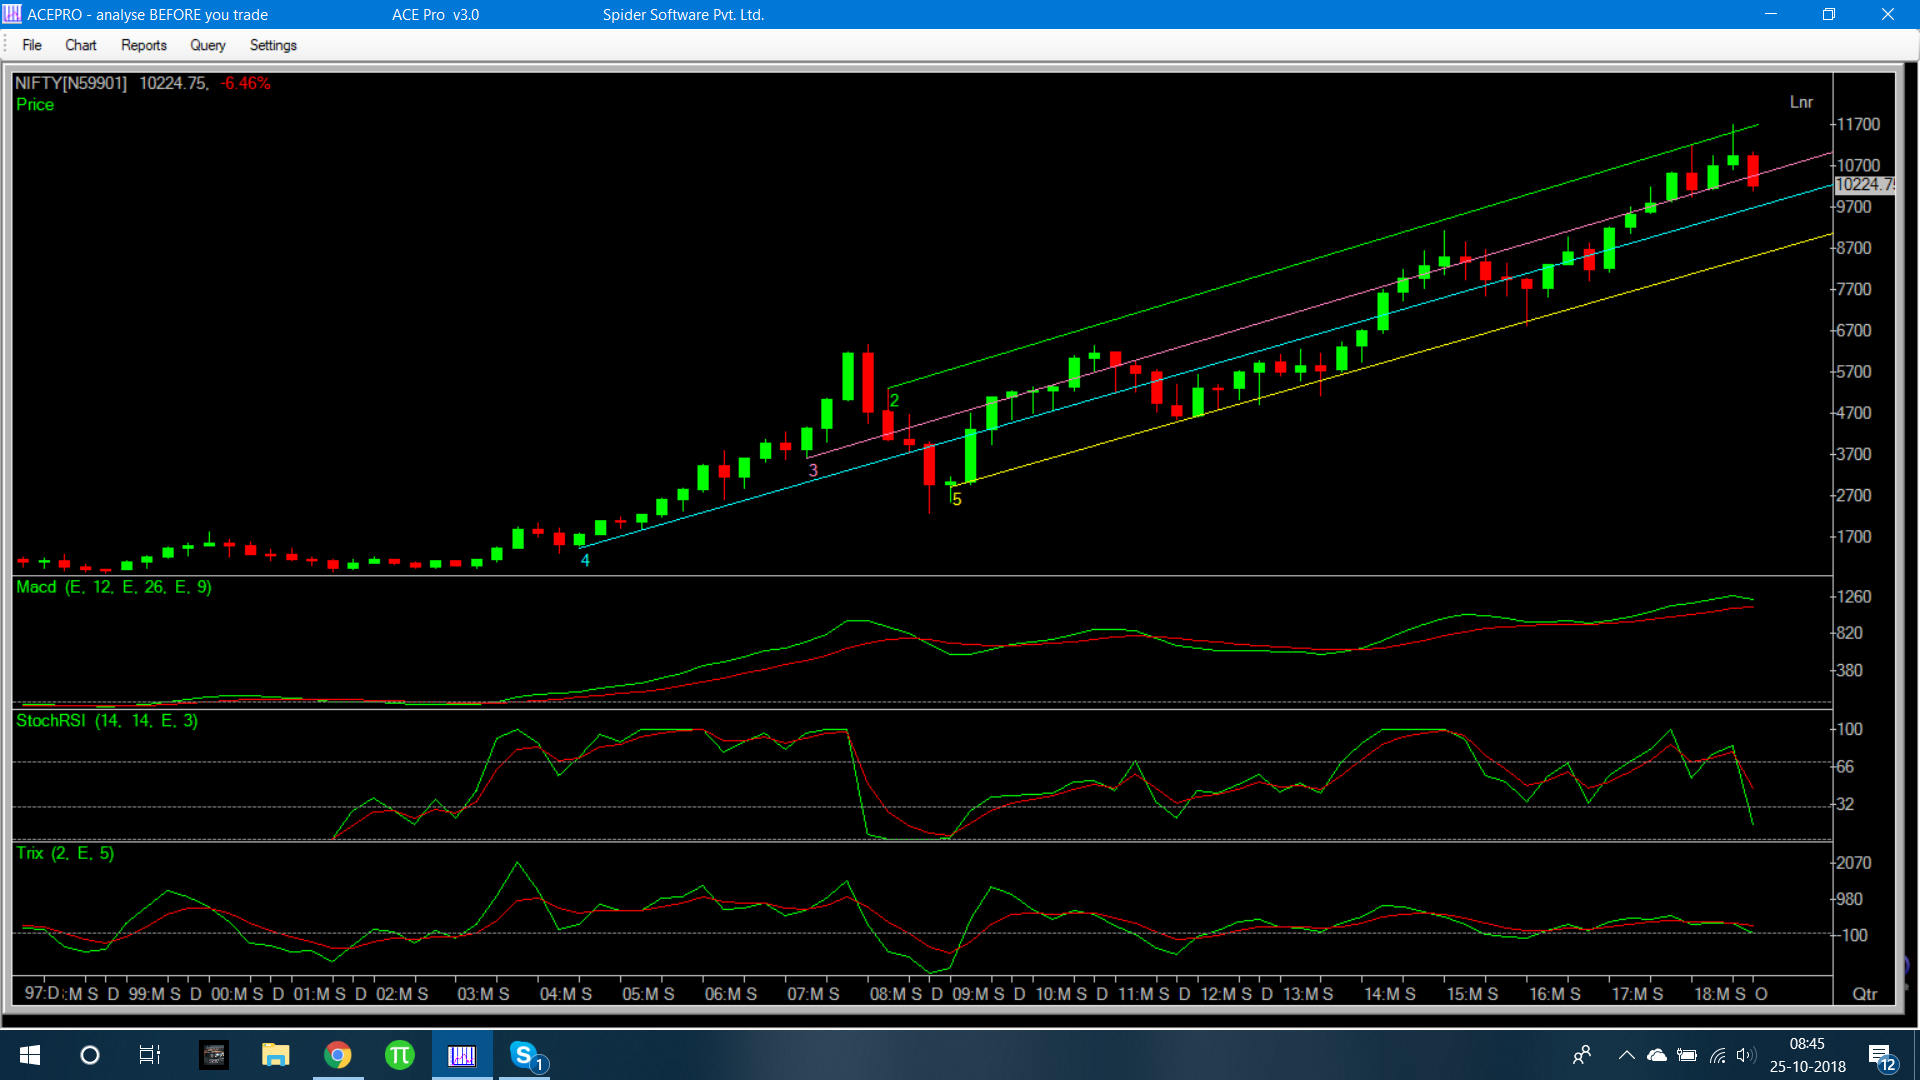
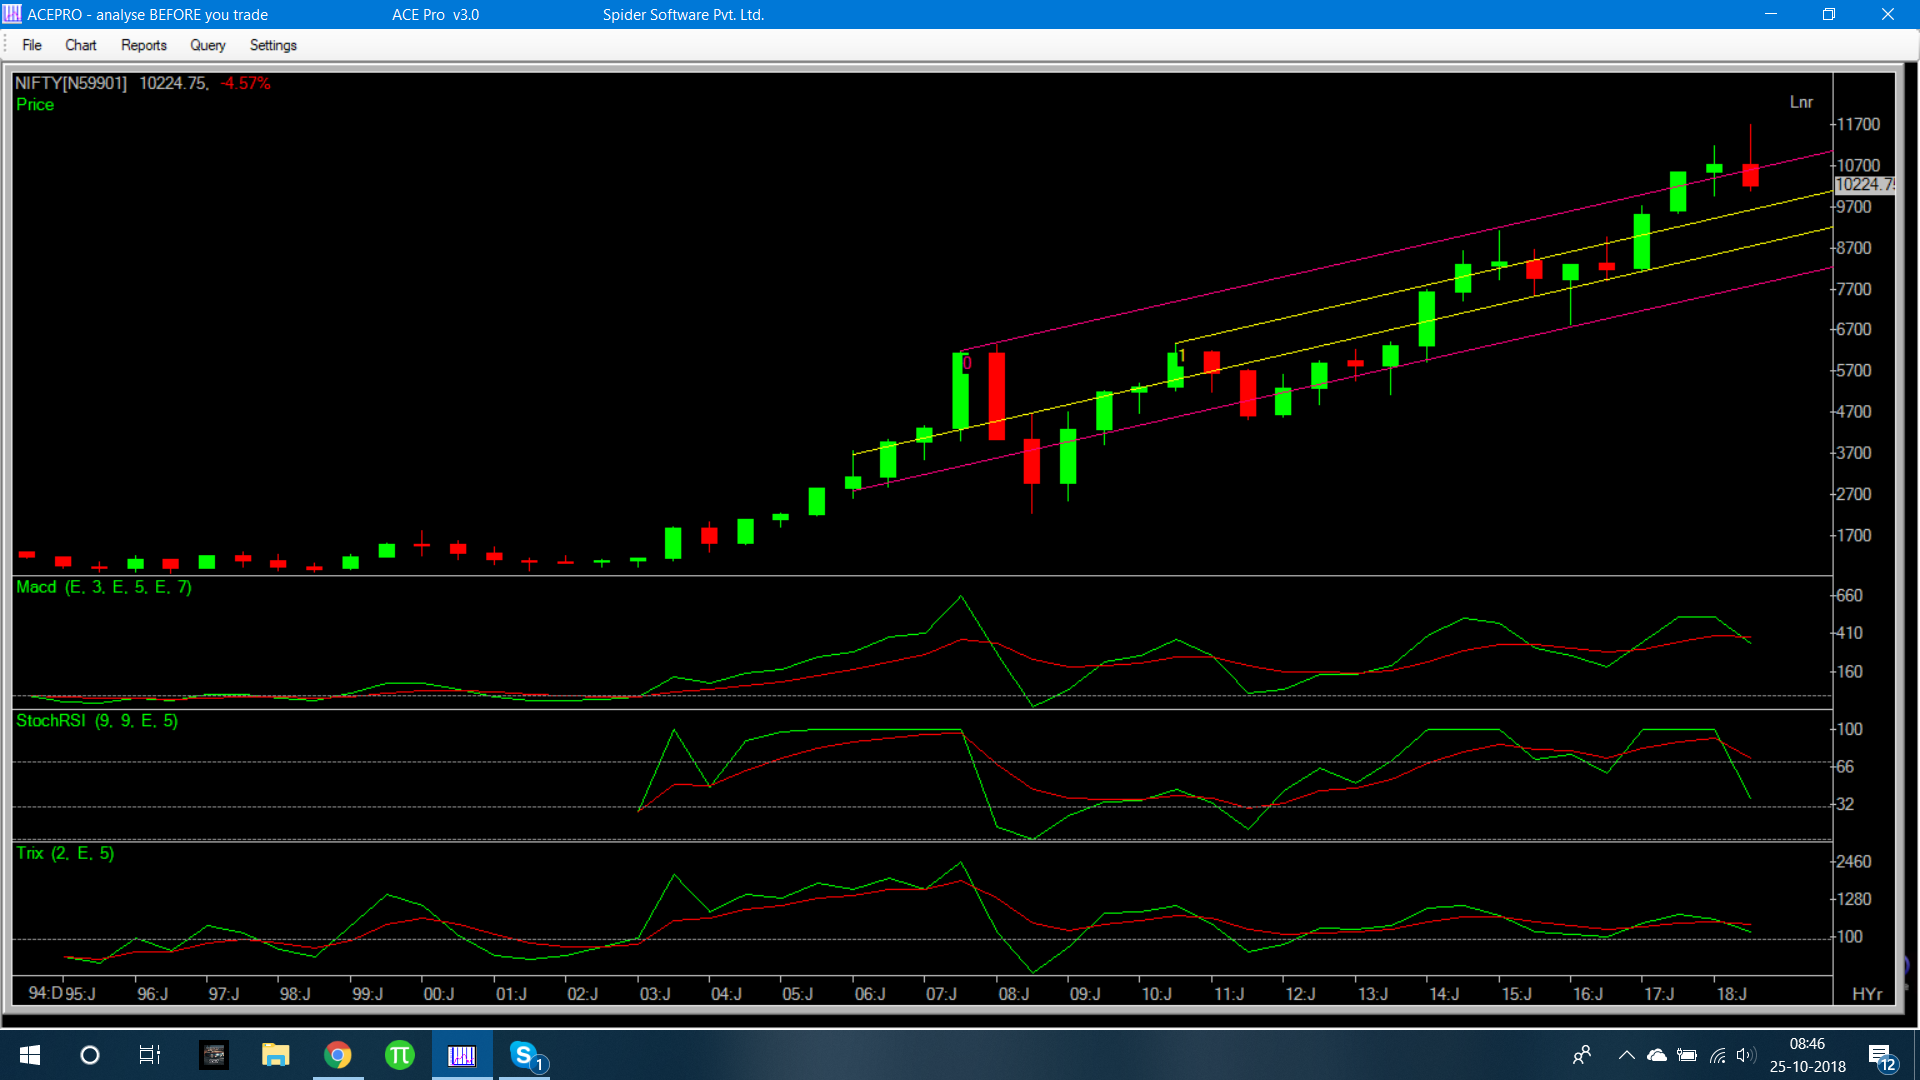
Nifty:
On daily charts nifty is doing it’s best to hold 10100-200 levels despite fall in US markets. This may not last very long. Quarterly charts clearly indicate more pain for nifty with immediate supports at 9800-9600-9200. Indicators had initially suggested to me that 9800 may be worse case scenario, but now with Dow creating the largest monthly candle (month not over yet) since even 2008, leads me to take a closer look at nifty. Hence using data points from Nifty quarterly AND half yearly charts; it seems like not only is 9800 seeming obvious now but doors are opening to fit in 9200 also. Now, these are large frame charts with each candle representing 3 months and 6 months respectively, so do understand that weekly and monthly pullbacks will be on the cards for sure. The tendency for perpetual bulls like us (those who do not short for profits and can only rely on upmove for portfolios to get better), is to feel bottom has been made on every bounce since it makes us feel better. Putting all feelings and biases aside; we should really be ready for a 9300 type situation if we are to make best use of cash in hand for both new buys and to average price on existing stocks in portfolio. Pointless assuming bottom made and pumping all money in at the same time. Trendlines and indicators together hint of chances of 9000-8900 being a worst case scenario. Going by candles on quarterly, this may take 2 more candles at the “least” if not 3, so 6-8 months will mostly go by before meaningful bounce forms. This may also be in time for elections next year.
Now let us see what Dow hints. On weekly, we have a semi bearish flag type pattern with a target of 23680 (taking peak at 27000 and target of 1660 from 25340 type levels. But weekly trendline hints bottom at 24370. TA most often sees patterns achieving targets and hence i will prefer to assume lower target of 23680 being more possible.
Monthly Dow however has a very nasty M top pattern in the making which can lead to 20000 type levels (indicated by black horizontal lines) which should coincide with lower monthly trendline (blue). but somehow i feel indicators as of now (hard to analyse) do not seem to hint the M top may work all the way.
So assuming Dow can go to 23680-22300 (yellow trendline) that would be 900-2280 points. Roughly can be translated as 400-1000 points on Nifty which would give levels of approx 9800-9200.
for those finding stock levels attractive now, my only advice would be to start buying in tranches and break up into approx. 3 buys. One now, one near 98-9700 and one closer to 9200 if it does come.
3 Likes
Today i would like to analyse another beaten down sector which had been on bull run for quite some time in recent past. Cement. As in any sector the very large cap companies tend to offer less in returns Y-o-Y but are more consistent. For this reason i mostly like dealing with larger small caps and small to medium midcaps. I have chosen cement companies from 2000k-5000k MCap for this. Out of these i have shortlisted 3 companies which look good both fundamentally and have very good upside technically in years to come.
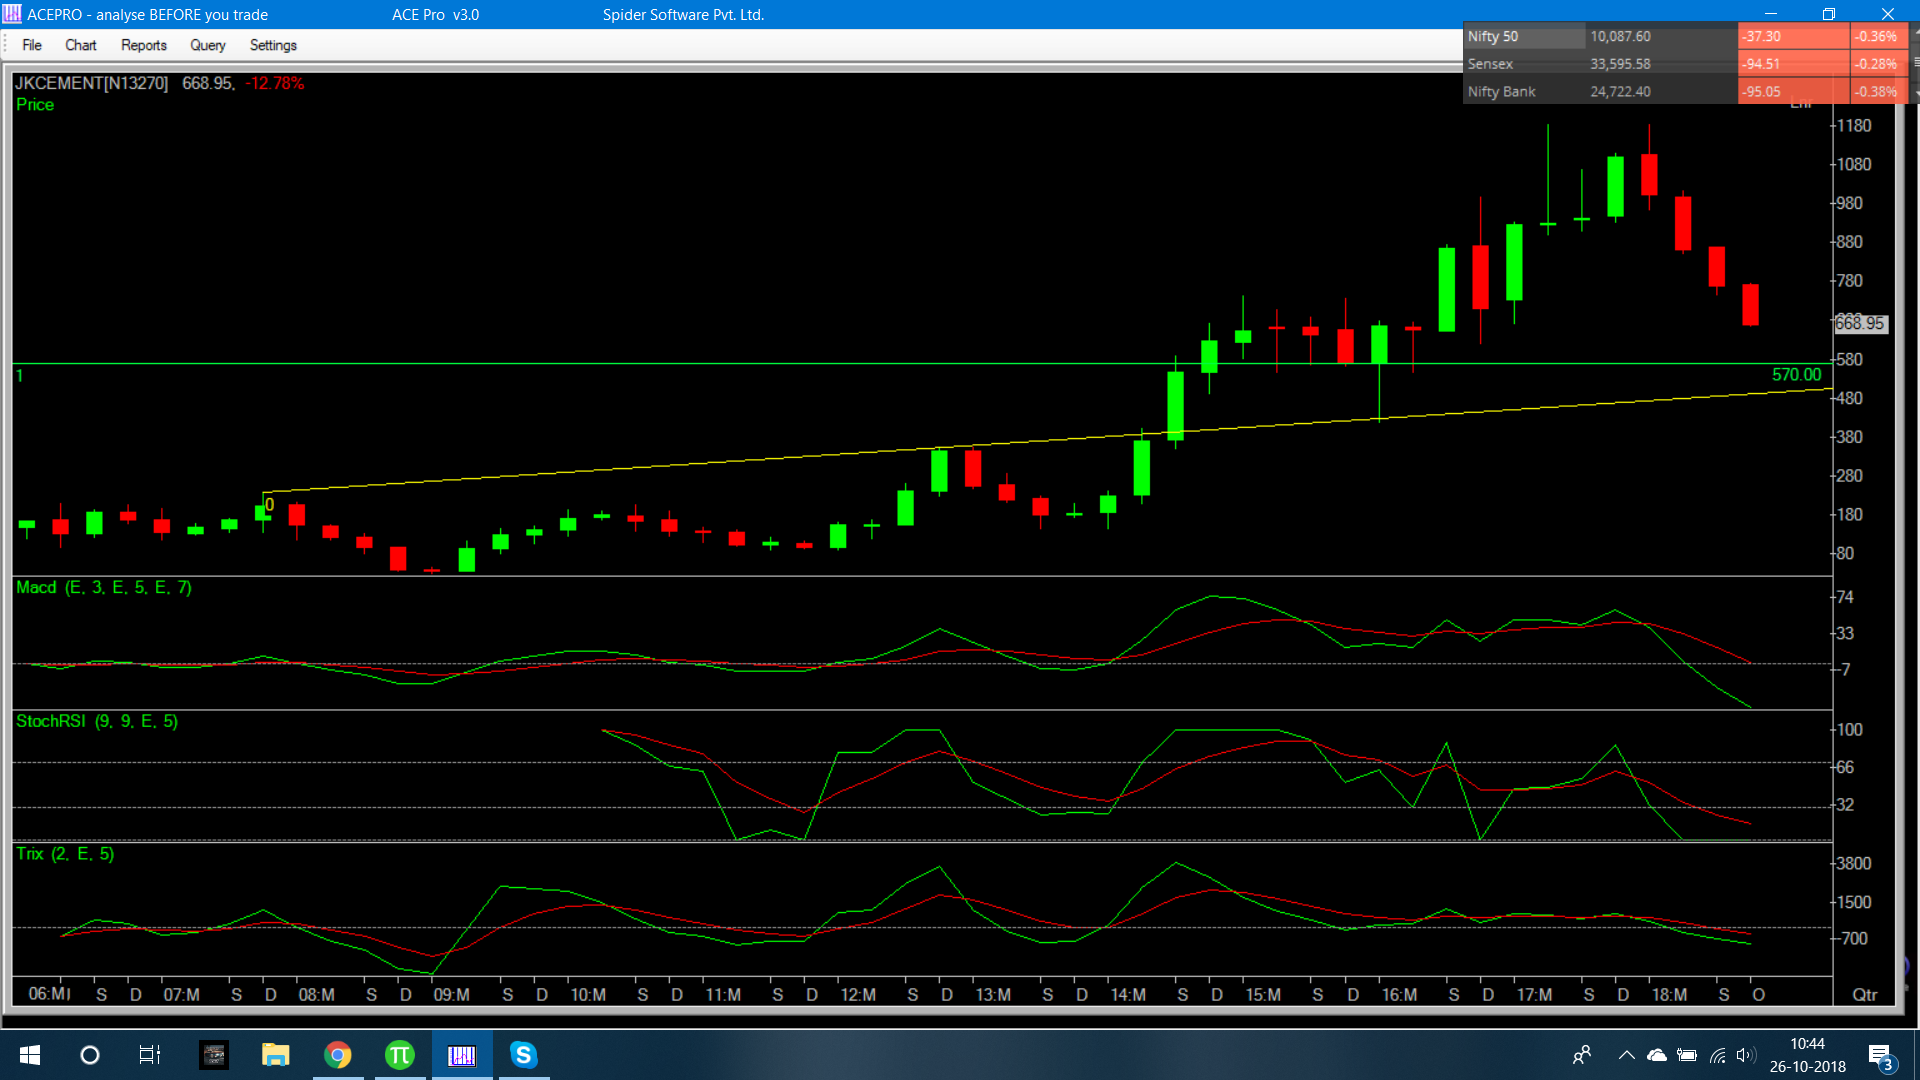
J K cement:
Constant reduction in debt over 4 years is inspiring. ROE and ROCE OF 16 and 15 is very good with ample space to grow further. 5 year topline growth and very consistent bottom line growth.Strong holding by promoter group of 64%.
Quarterly charts hint very strong support can come in at multi quarter lows around 570 levels (cmp 669).(green line) but chances of testing lower trendline at 495 levels also seem quite possible based on index analysis done yesterday. Well formed inverted Cup on monthly charts which can see bounce around 640 levels to form the handle for Inverted cup and handle pattern.
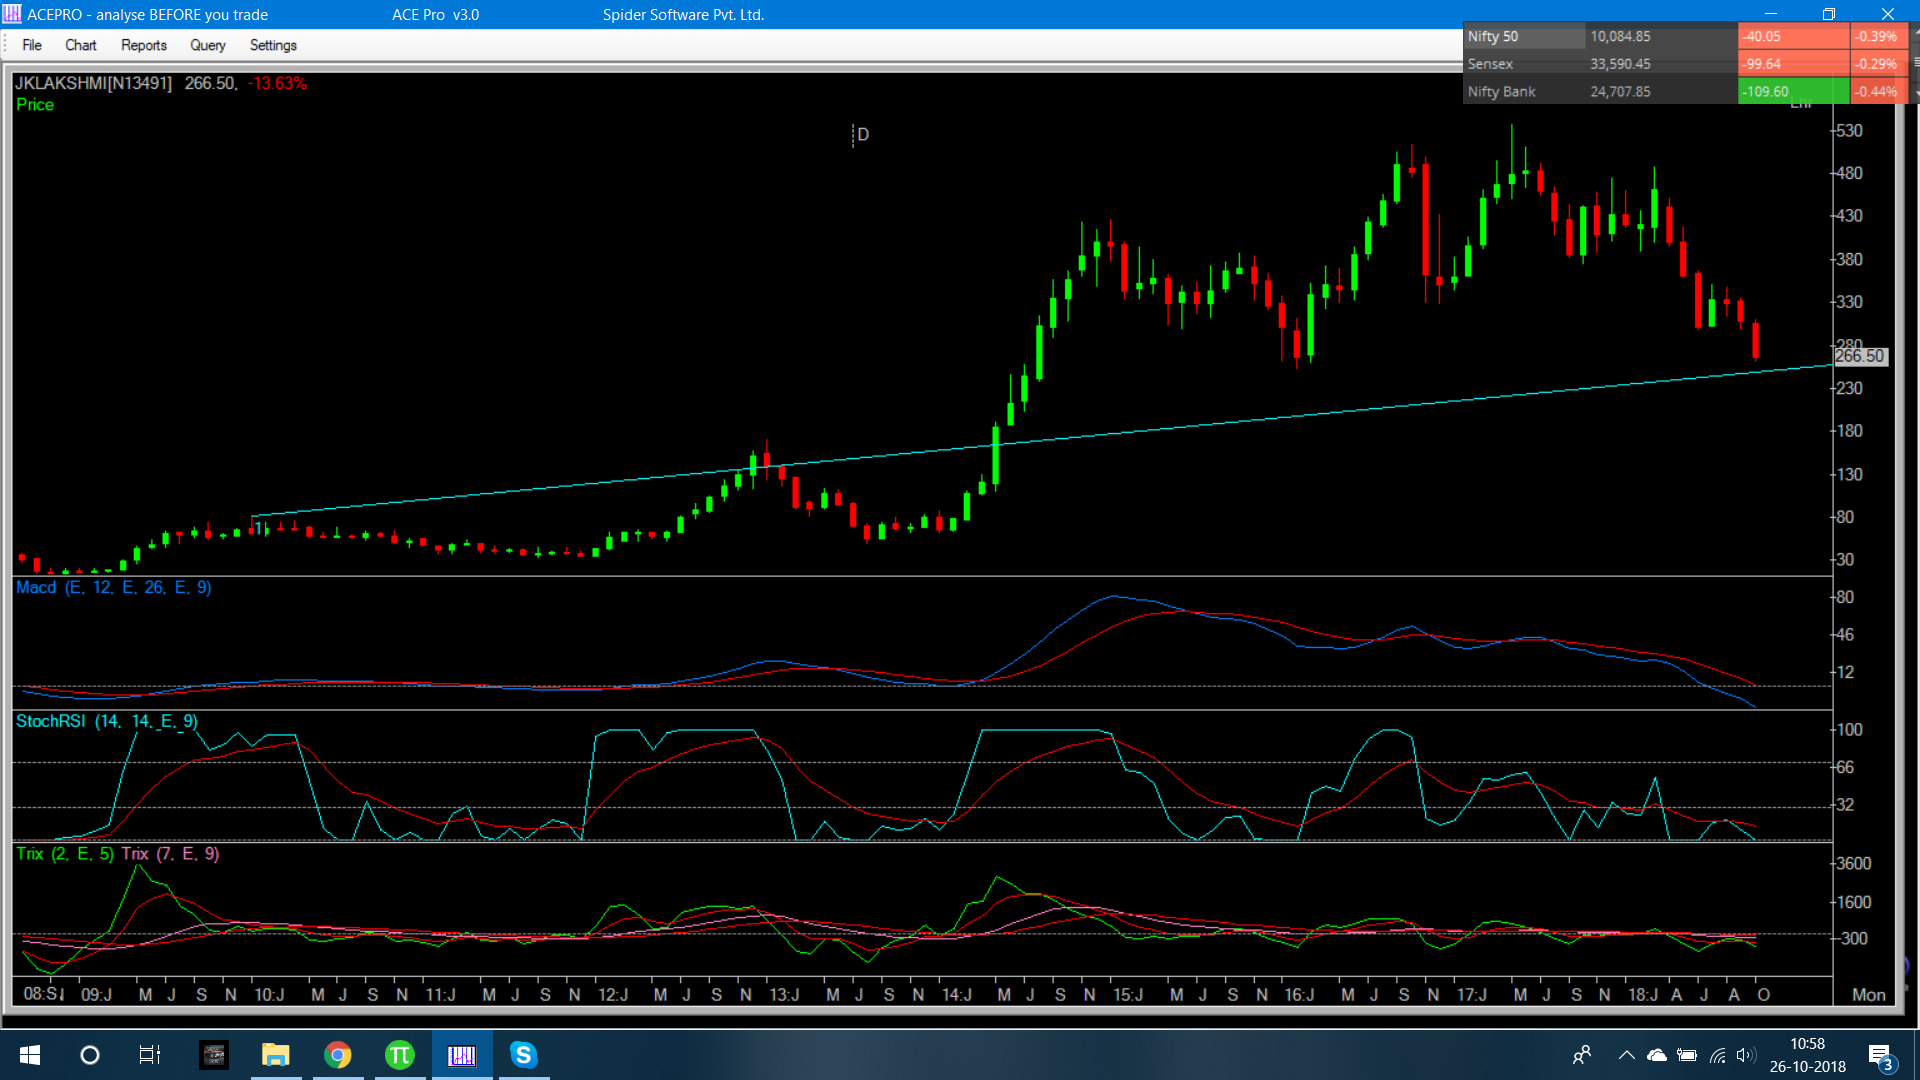
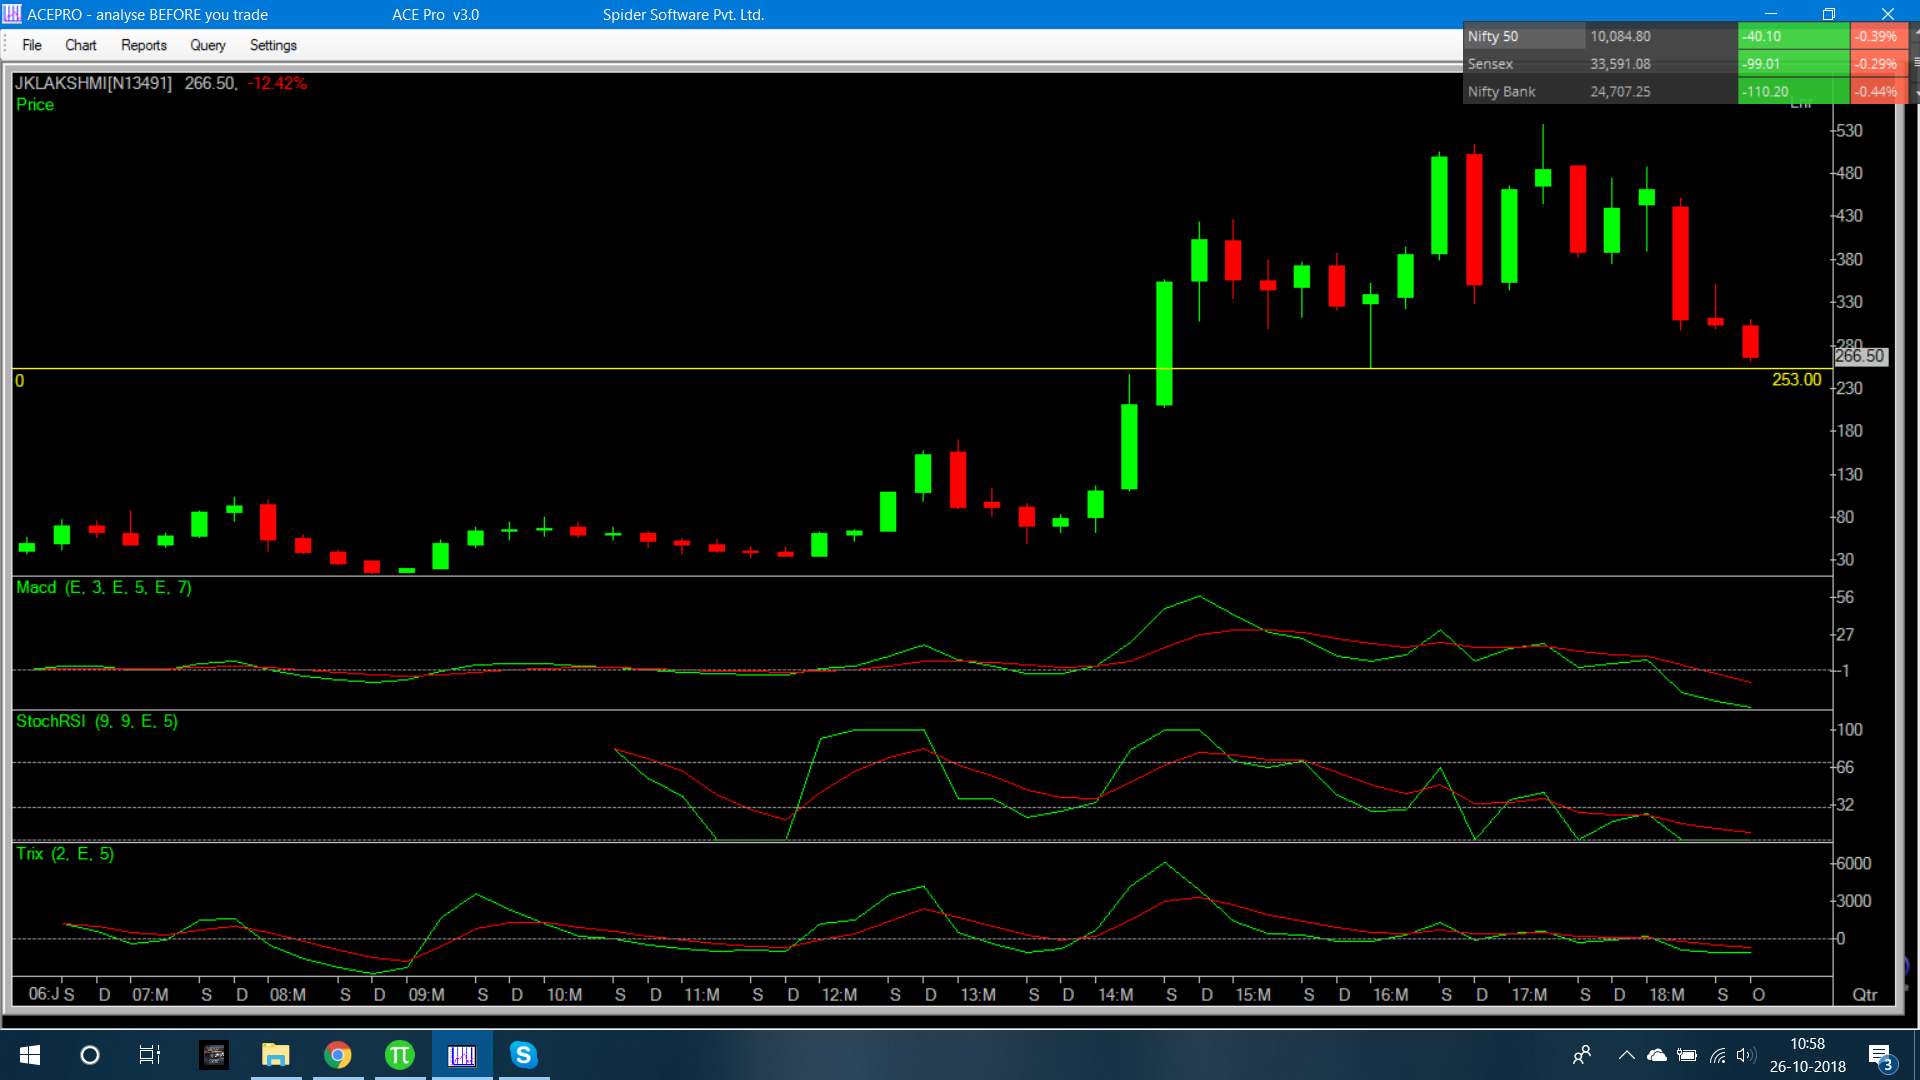
J K Lakshmi cement is next. Decent promoter holding of 46%. Excellent topline growth but slightly inconsistent bottom line which could be due to many reasons which my FA friends could analyse better than me. ROE and ROCE of 6 and 9 is fairly okay as BV is only 123. D/E has dropped from 1.42 to 1.25 in past year.
TA wise stock appears to be near bottom with quarterly test of support at 253-50 (yellow line) and trendline test on monthly at same level. Any fall below that can be grabbed in tranches again at 210-190 if stock does go there… Both JK and JK Lakshmi would have corrected over 50% from peaks at mentioned levels.
Finally would like to analyse Indiacem
The smallest of the 3 in Mcap. 36% of shares pledged. I would like FA people to shed light on how safe this may be for the company considering D/E is just 0.5 compared to the other 2 companies with double the debt. Slightly inconsistent topline and bottomline but have to consider MCap is lower than other companies also. Very low ROE and ROCE compared to other peers. Some discussion would be interesting and informative too.
Technically, stock has corrected sharply from 225 levels to cmp 83. Monthly test of 67-64 seems impending and quarterly indicators seem well balanced to make a floor soon.
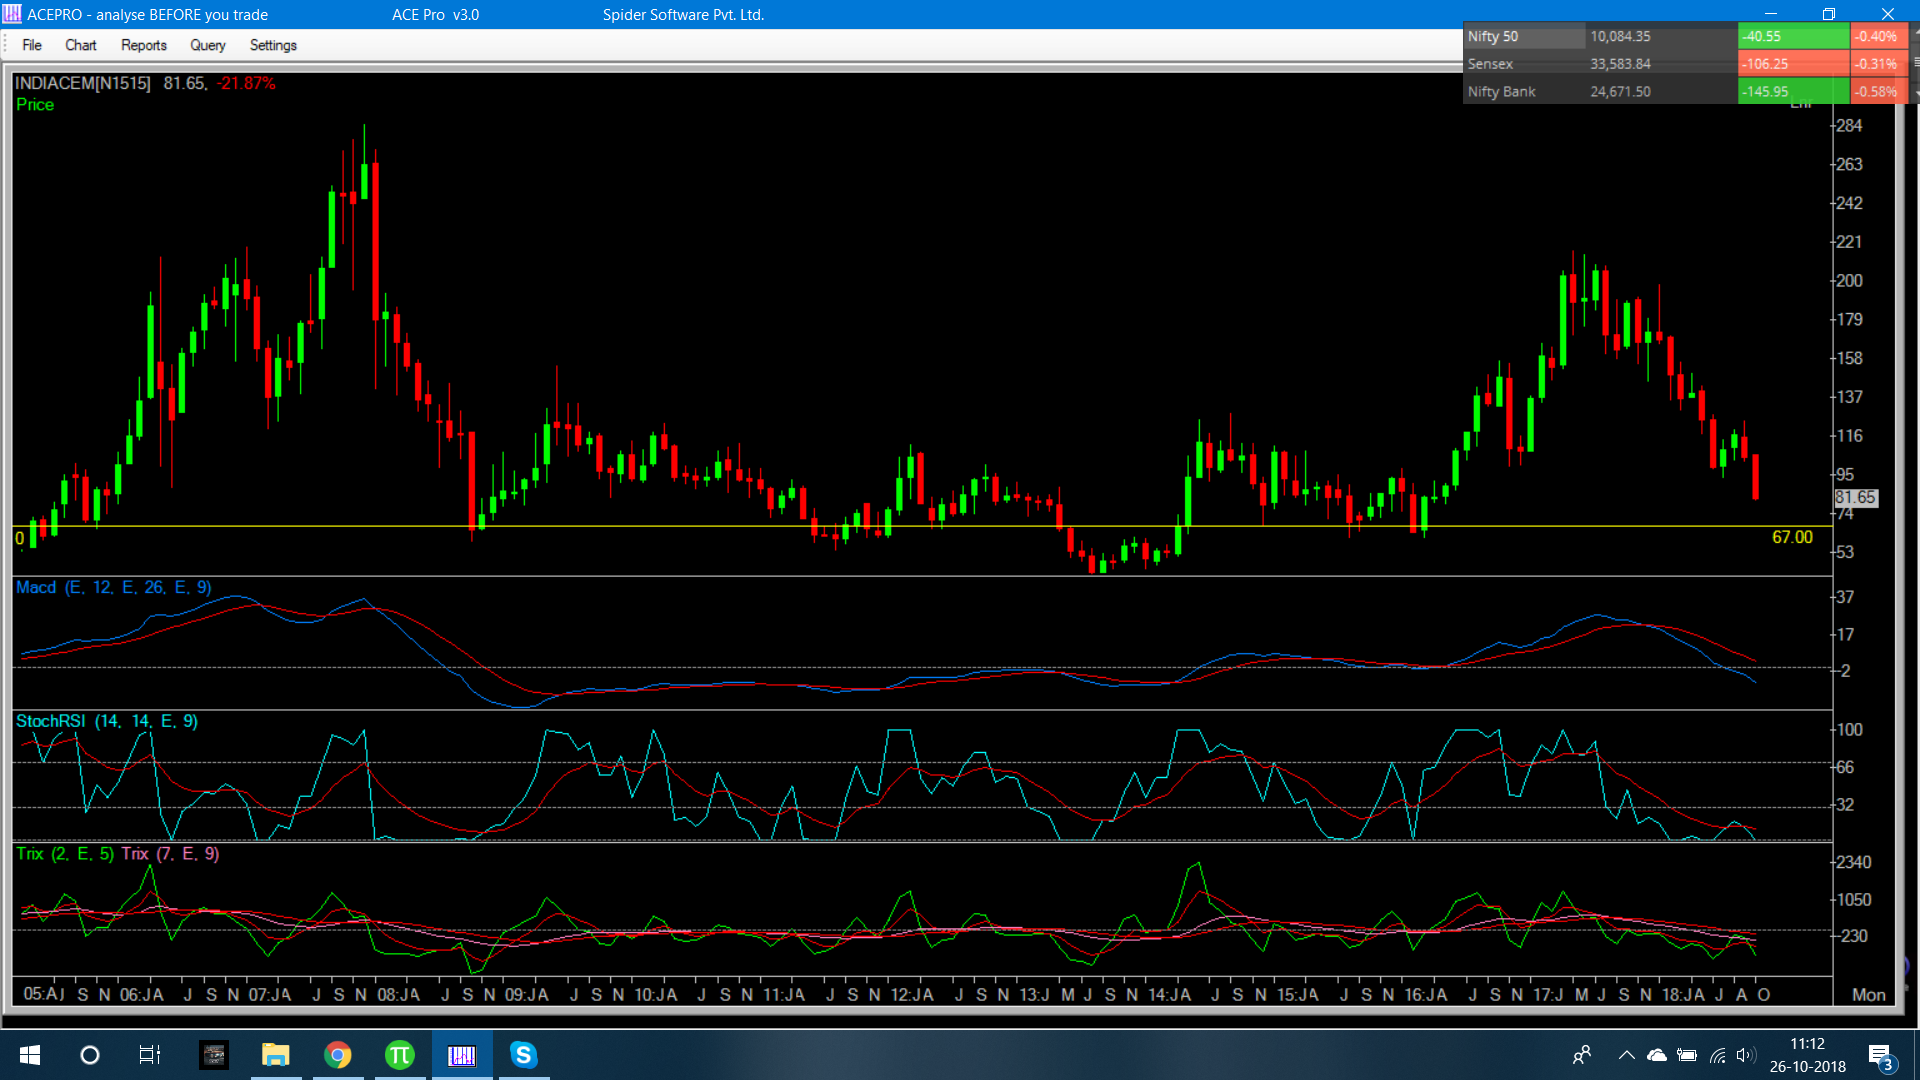
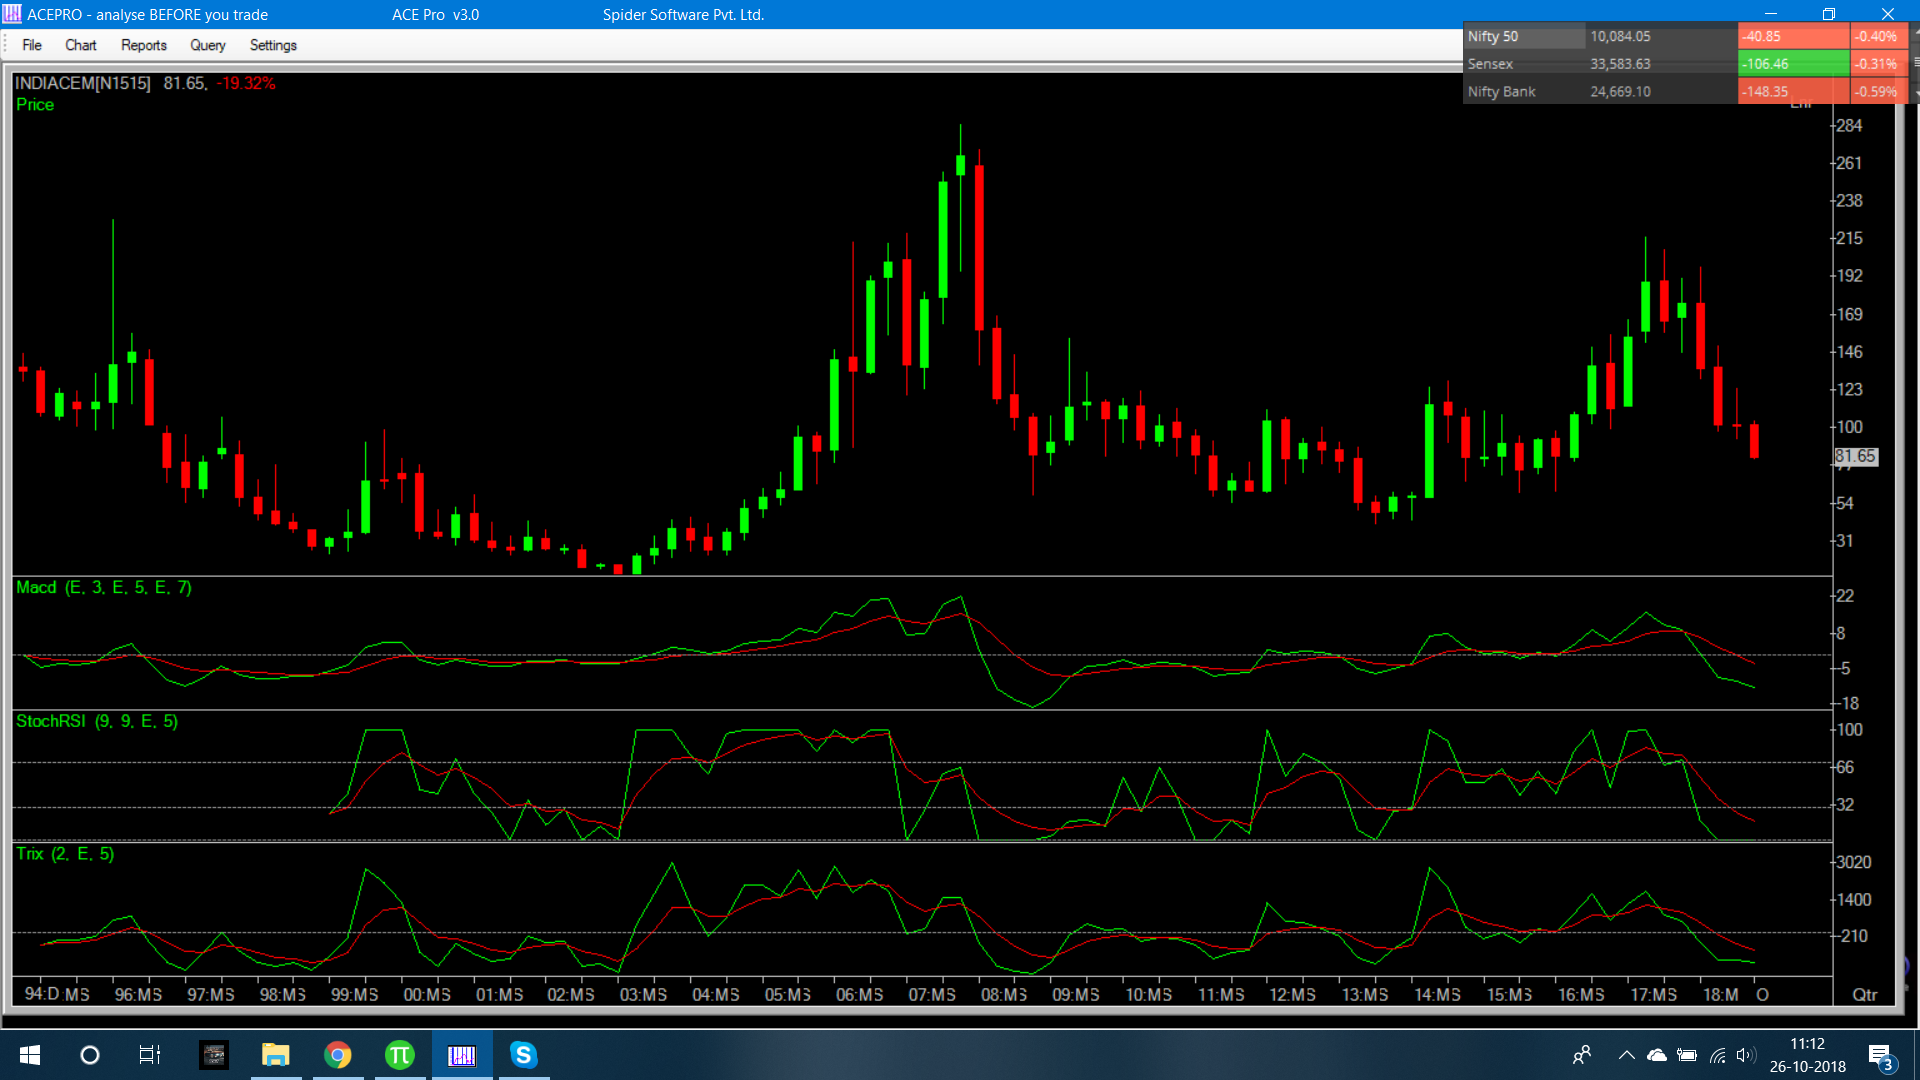
Disclaimer: invested in Indiacem.
@harshrulz
quite a large list. I will give technical levels for entry below current price (2 support levels) where i feel stock may slide till. You will have to do the FA on ur own. Also won’t be showing charts for them as it will clutter the thread.
Indiacem has already been covered above.
Praj Inds. The stocks has been in a 68-124 band for 10 years. Wonder why you would even bother. Even at upper end of band, candles suggest when demand tries to supercede supply, forced supply (offloading) is brought in to control price. It may be best to buy as and when stock clears 135-40 zone whenever that happens. Almost every bullish pattern which emerges has failed showing high degree of manipulation. If you still want to buy , then maybe lower end of band at 76-66 levels for a small trade at best.
Trident: Very well poised monthly and quarterly indicators. Any dip till 58 can be used to enter. Stock looks ready to start upmove very soon.
Shree Renuka: Though i am bullish on sugar, this has to be one of the worse charts for the sector.18-11 seems current band. At best a trade from 11-18 that too if lucky or a buy above 23 whenever stock shows strength. Seemingly ethanol price or any other good news for the sector is not helping Renuka much.
Yes Bank: Lovely correction from 400-200. Weekly trendline and monthly one clearly broken. 168/147 would be decent entry points.
Hind Copper: except for one stint in 2017, stock has been in 100-48 zone from late 2012, with lower end being tested more in recent times. Not the best of charts again. I have given the band so you can only try your luck between that.
IOC : 106-8 would have been good entry at base support but that has been done and bounced off. Depending on crude, may present another chance. 123-108 key supports.
SunPharm: 500/440 key supports. well balance quarterly indicators with buy signal already triggered around 554 tqo quarters ago (stock currently has dipped back to same level)
Nalco : Yet another chart within band of 97-46. Bleak charts unless 100 clears.
Tata motors: Crucial monthly support of 270 broken with volumes. Currently close to 162 quarterly support. may slide to 120-114 also. Evaluate and buy in tranches.
Thanks dear for your kind response. 
1 Like
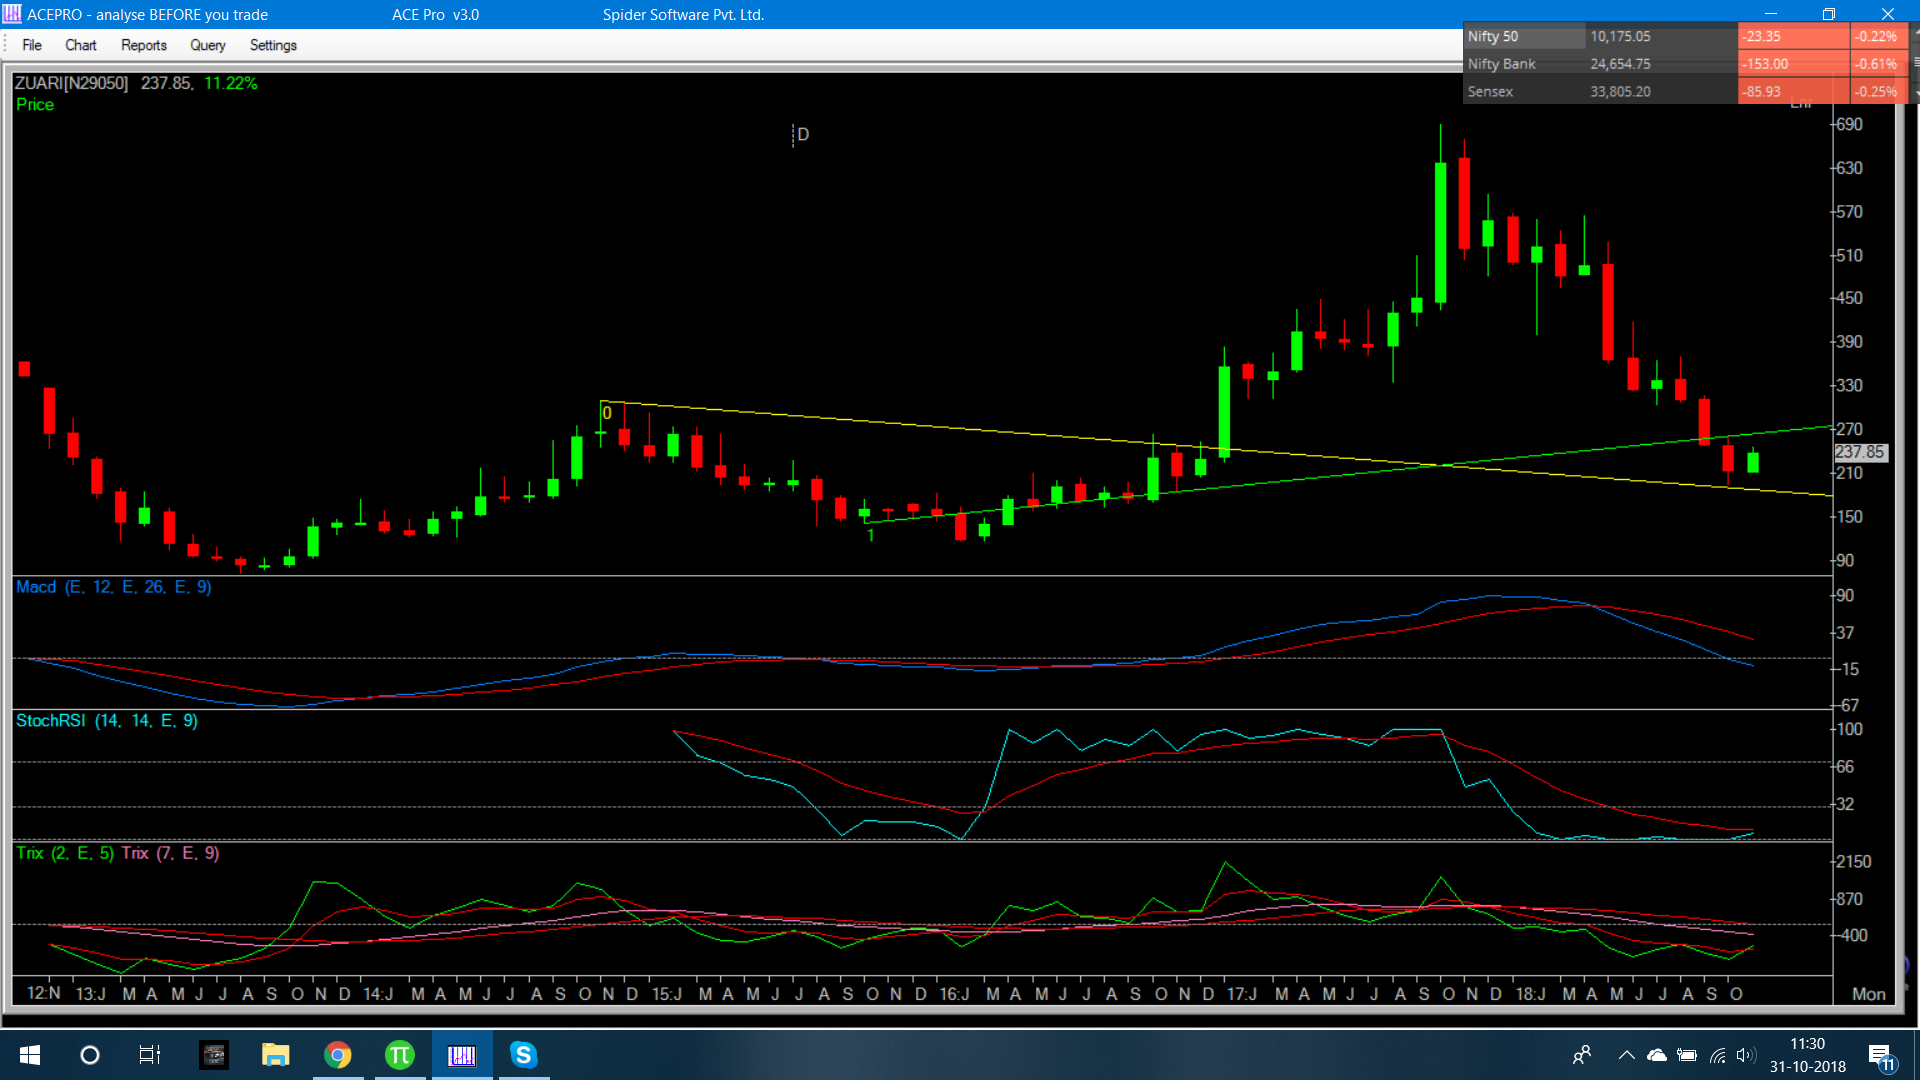
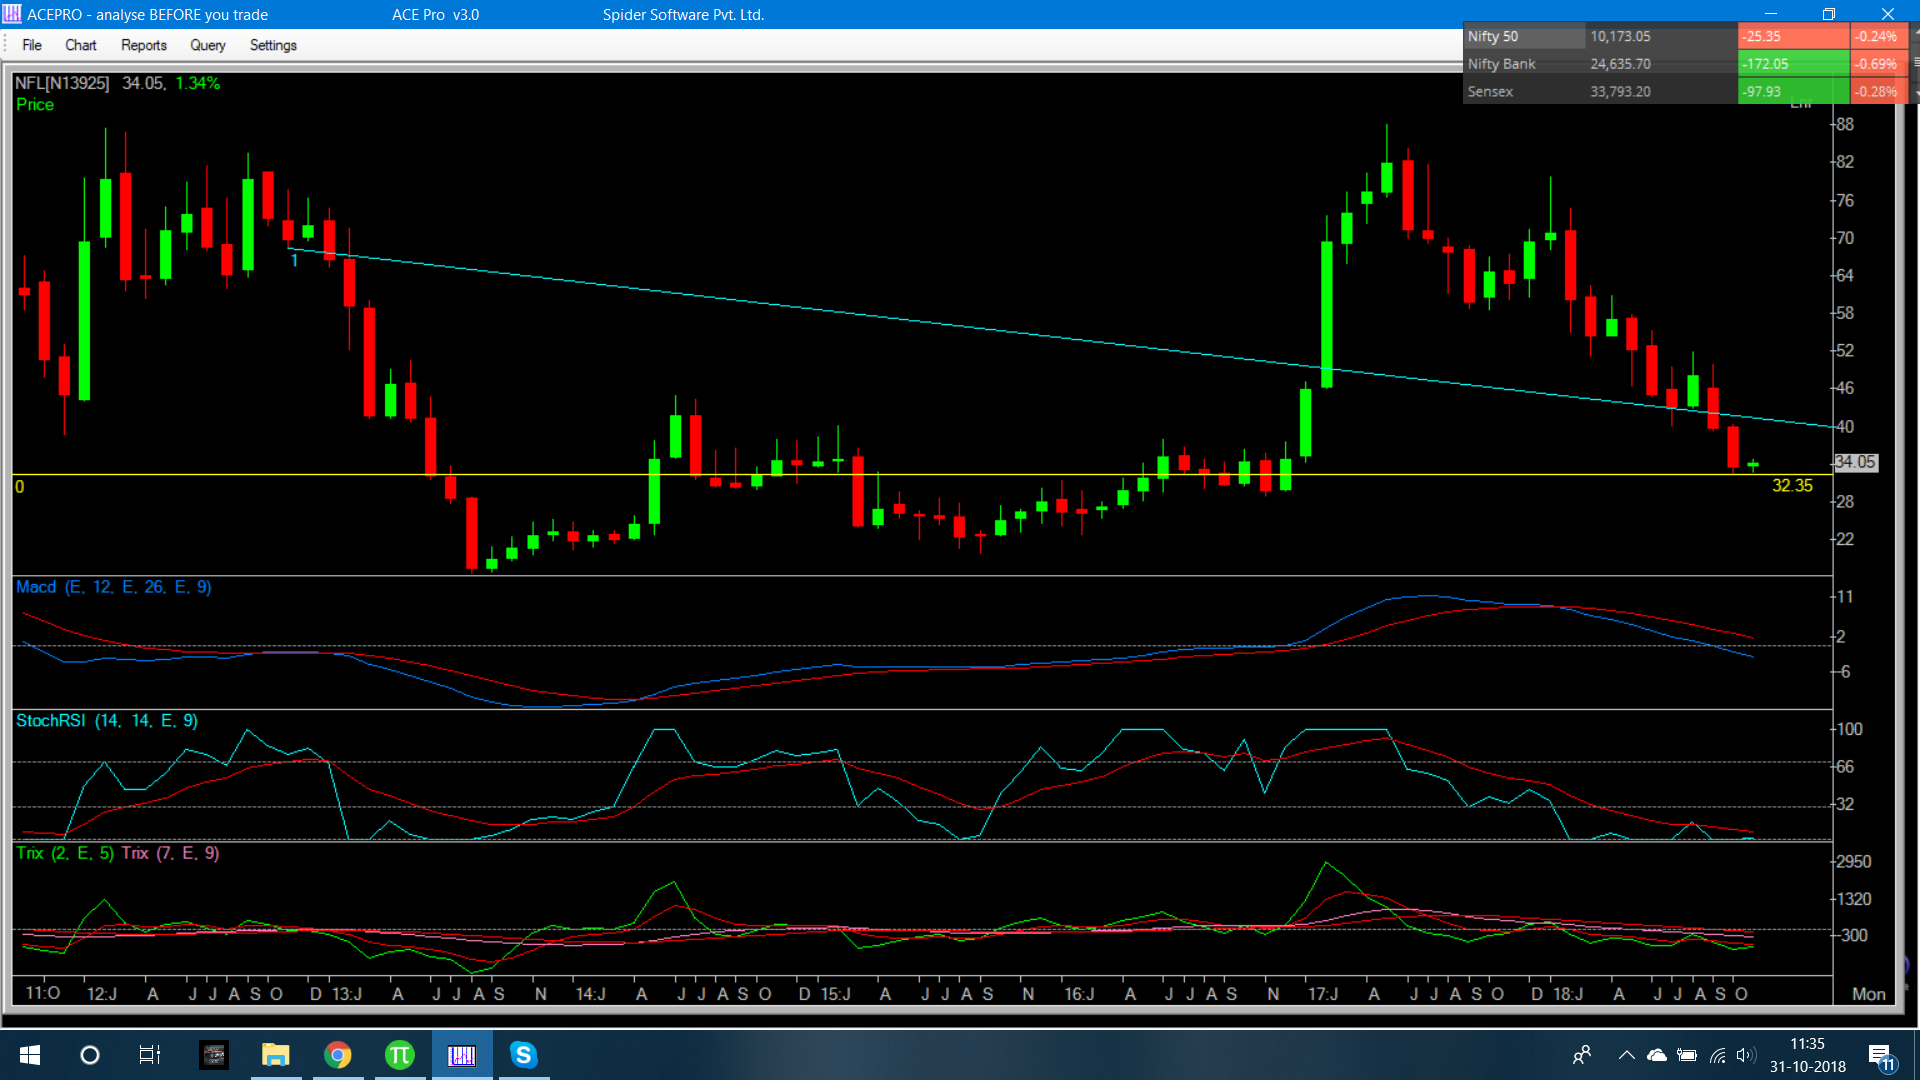
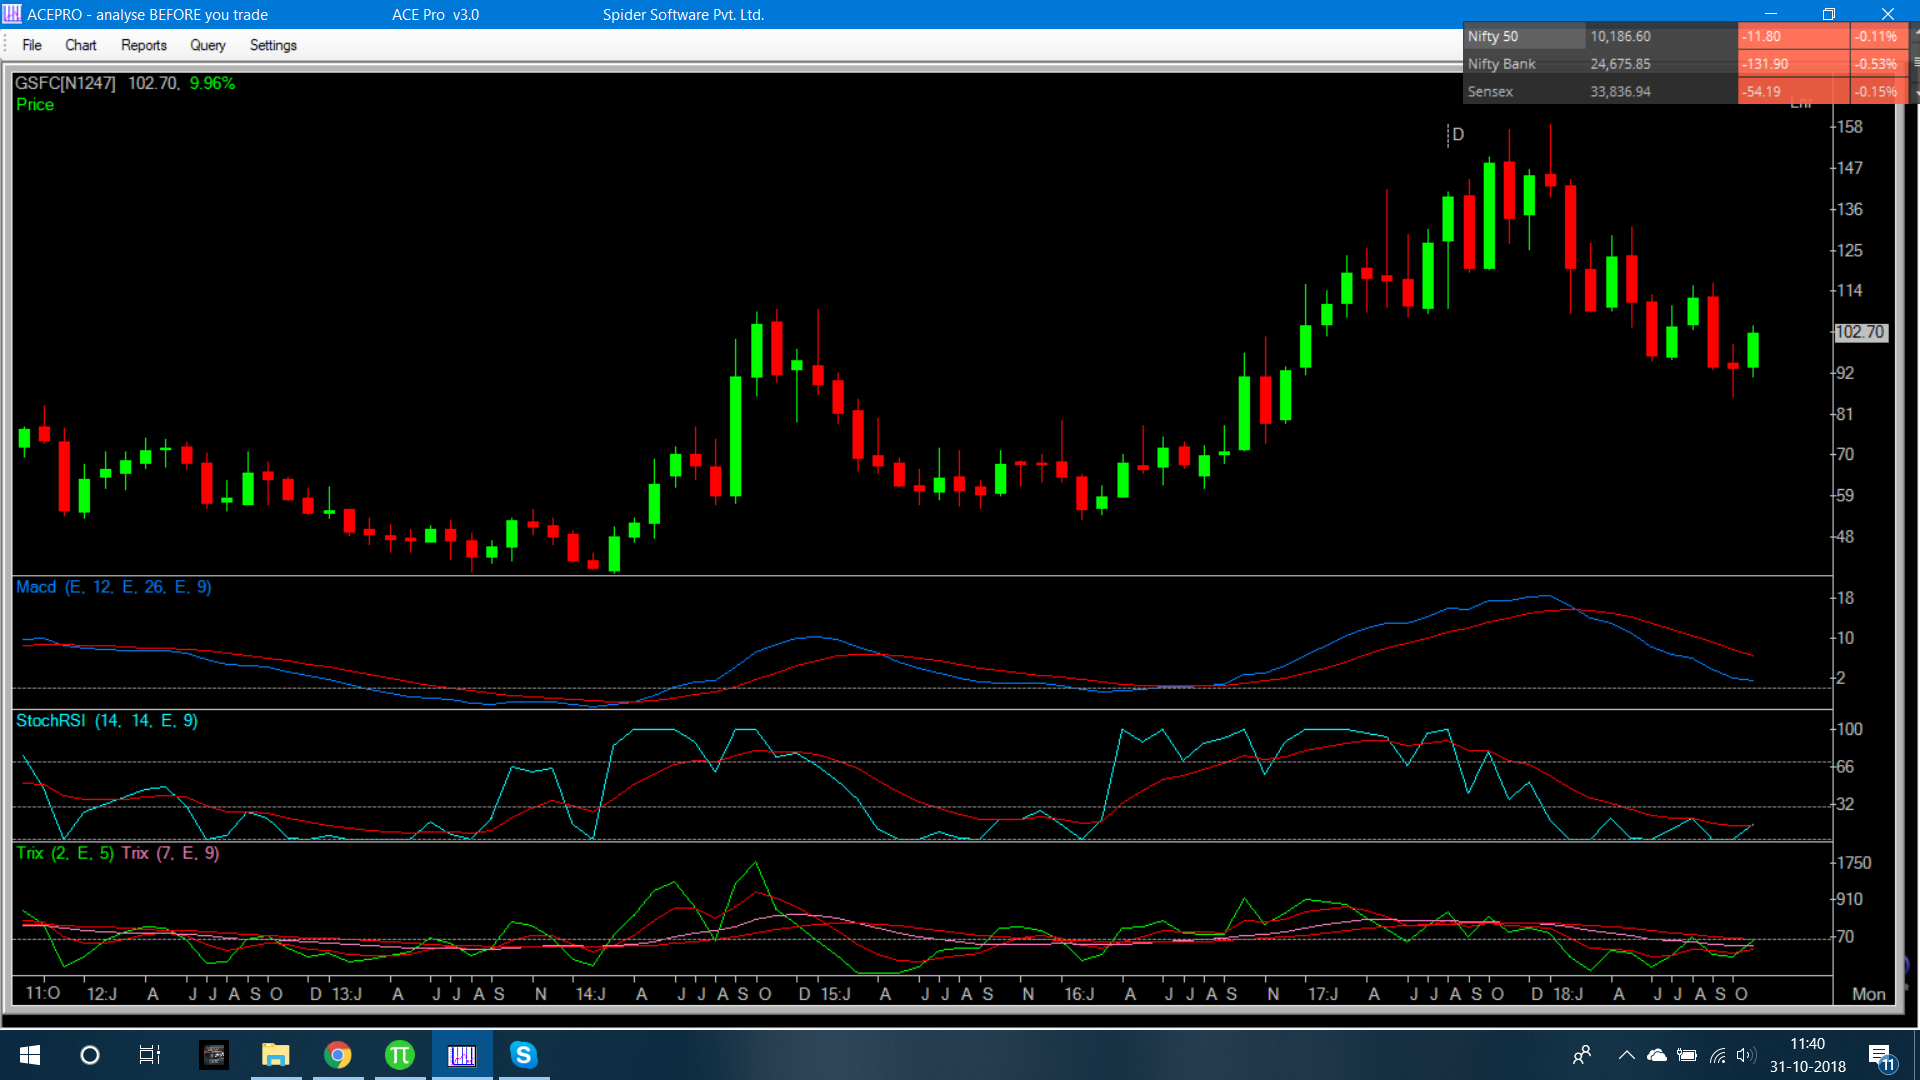
Today i would like to analyse Cement sector for stocks in 1000-5000 Cr Mcap. These would be Zuari Agro, NFL, Deepak Fert, Fert and Chem, Rashtriya Fert, and GSFC. Of these i would like to select charts which have corrected more and hence have maximum upside on trend reversal. This has been shortlisted to Zuari, Deepak, NFL and GSFC.
Zuari agro: The stock has seen tremendous correction from 700-200 along with most of it’s peers in the sector. This one a bit more. Stocks has held prior consolidation/breakout zone of 2017 and currently looks very good on monthly frame for upmove to start. Once above 260-65 (green line) stock can witness tremendous buying.
NFL: Has been falling from 90 -32 levels. Well aligned indicators hinting bottom made/being made. Volumes should pick up above 40-41 and see start of participation phase.
GSFC: Probably the best stock in this Mcap range. Consistent movement from 16 in 2009 to 160 recently with perfect channel corrections maintained. Indicators already hinting a buy on the stock.
All the above stocks suggest 2x-3x returns in 2-4 years.
1 Like
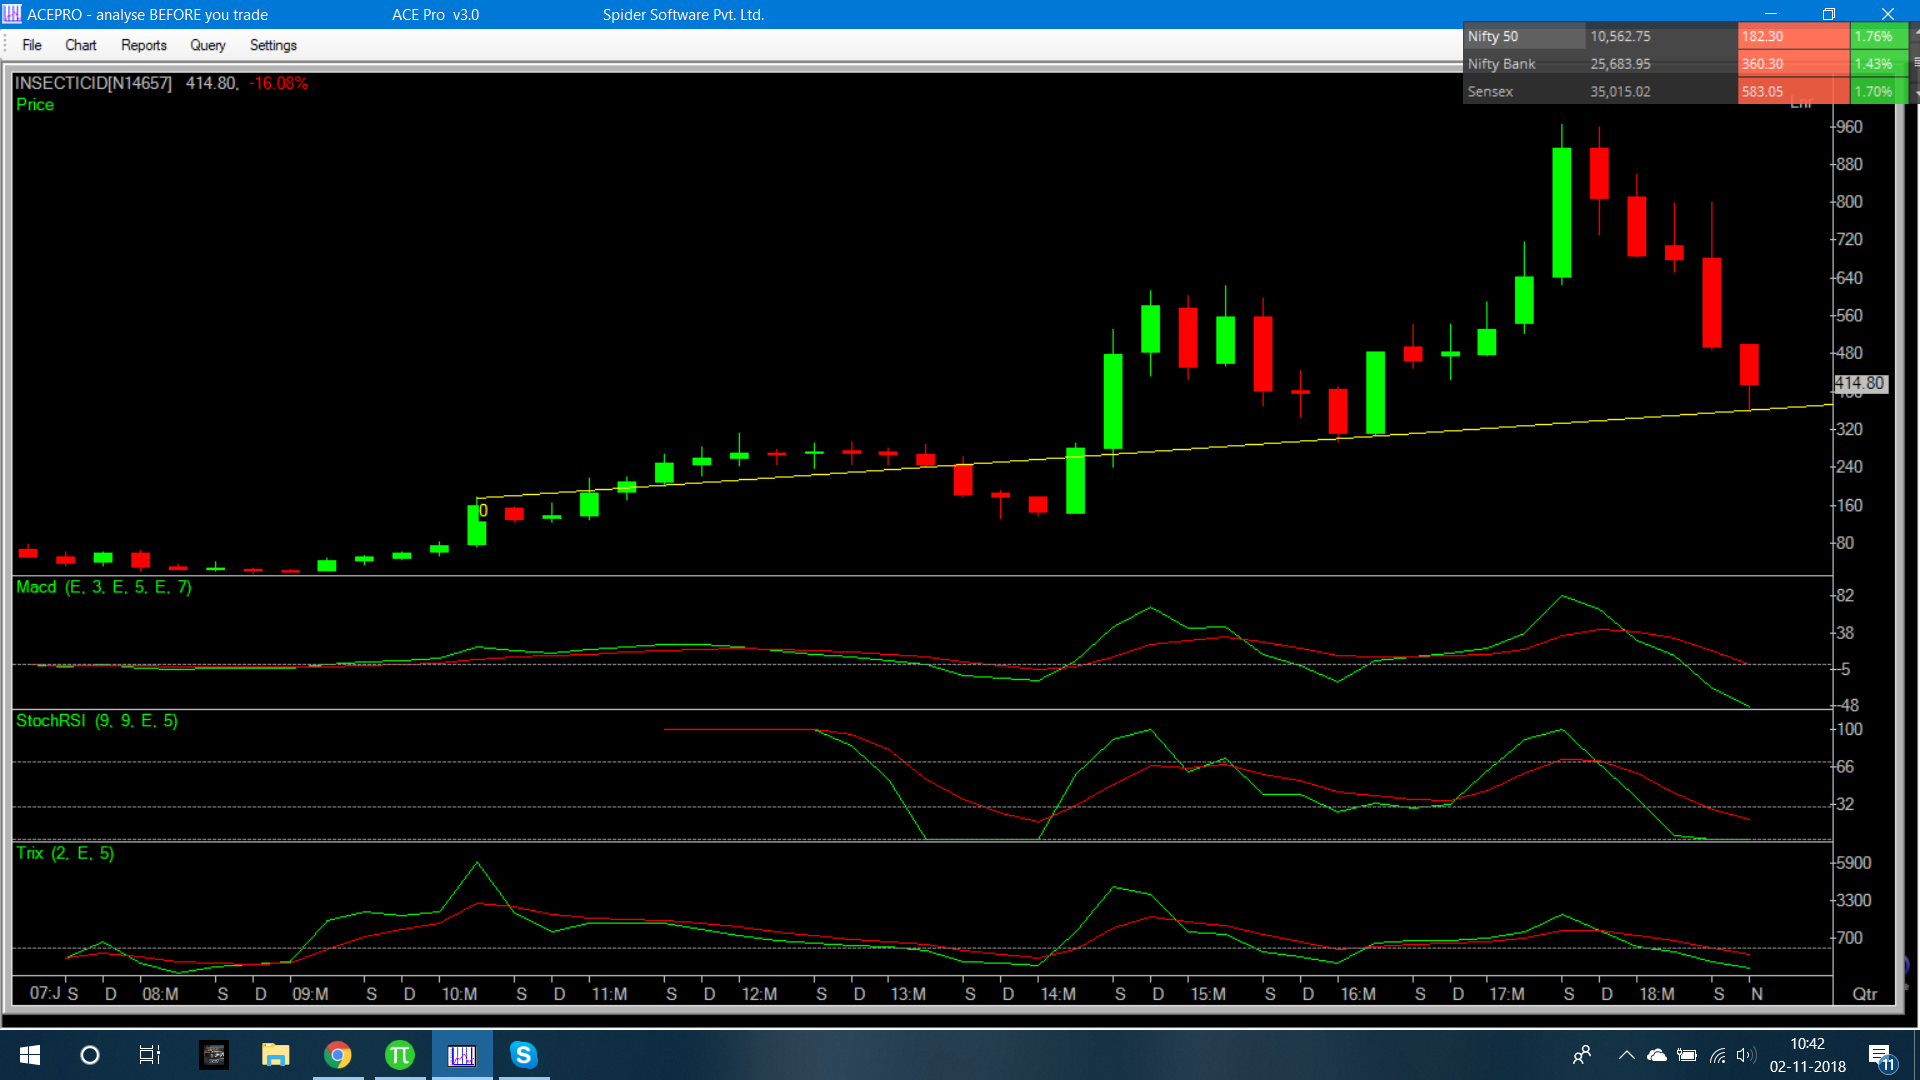
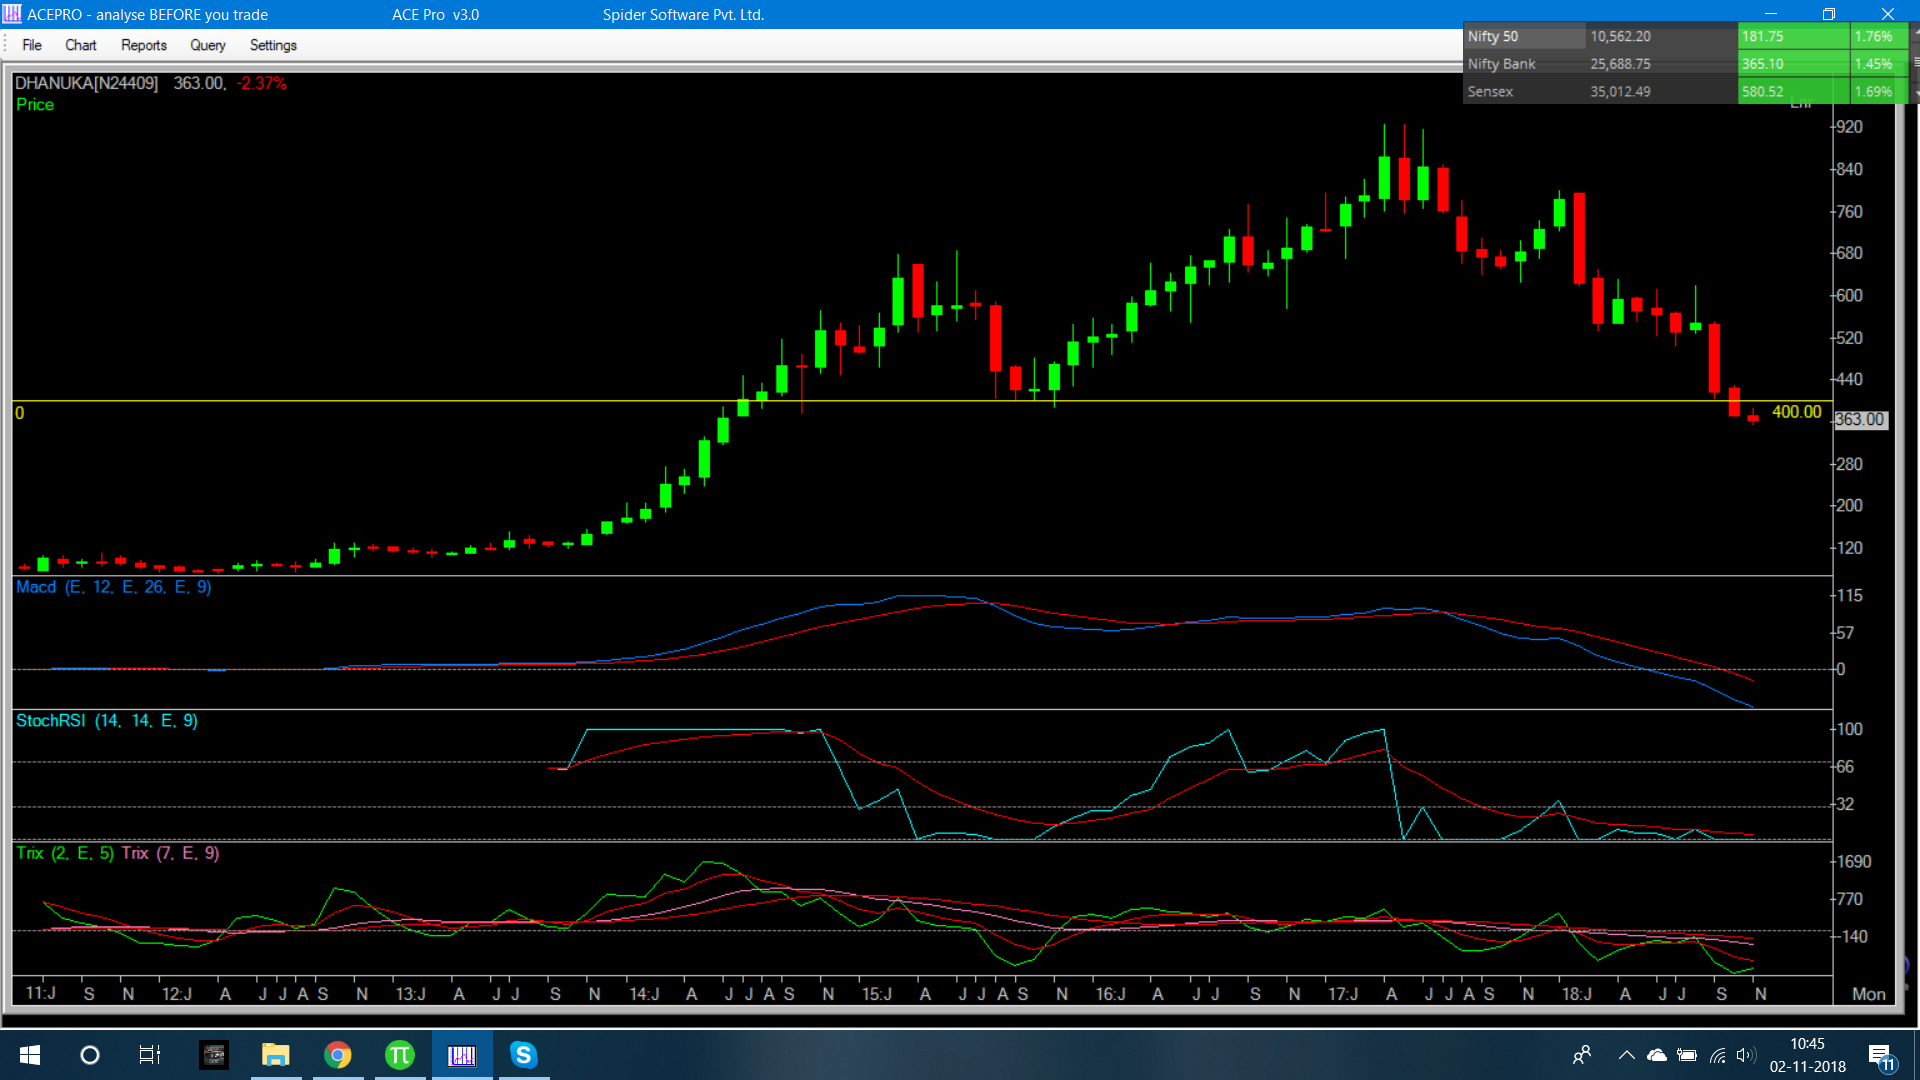
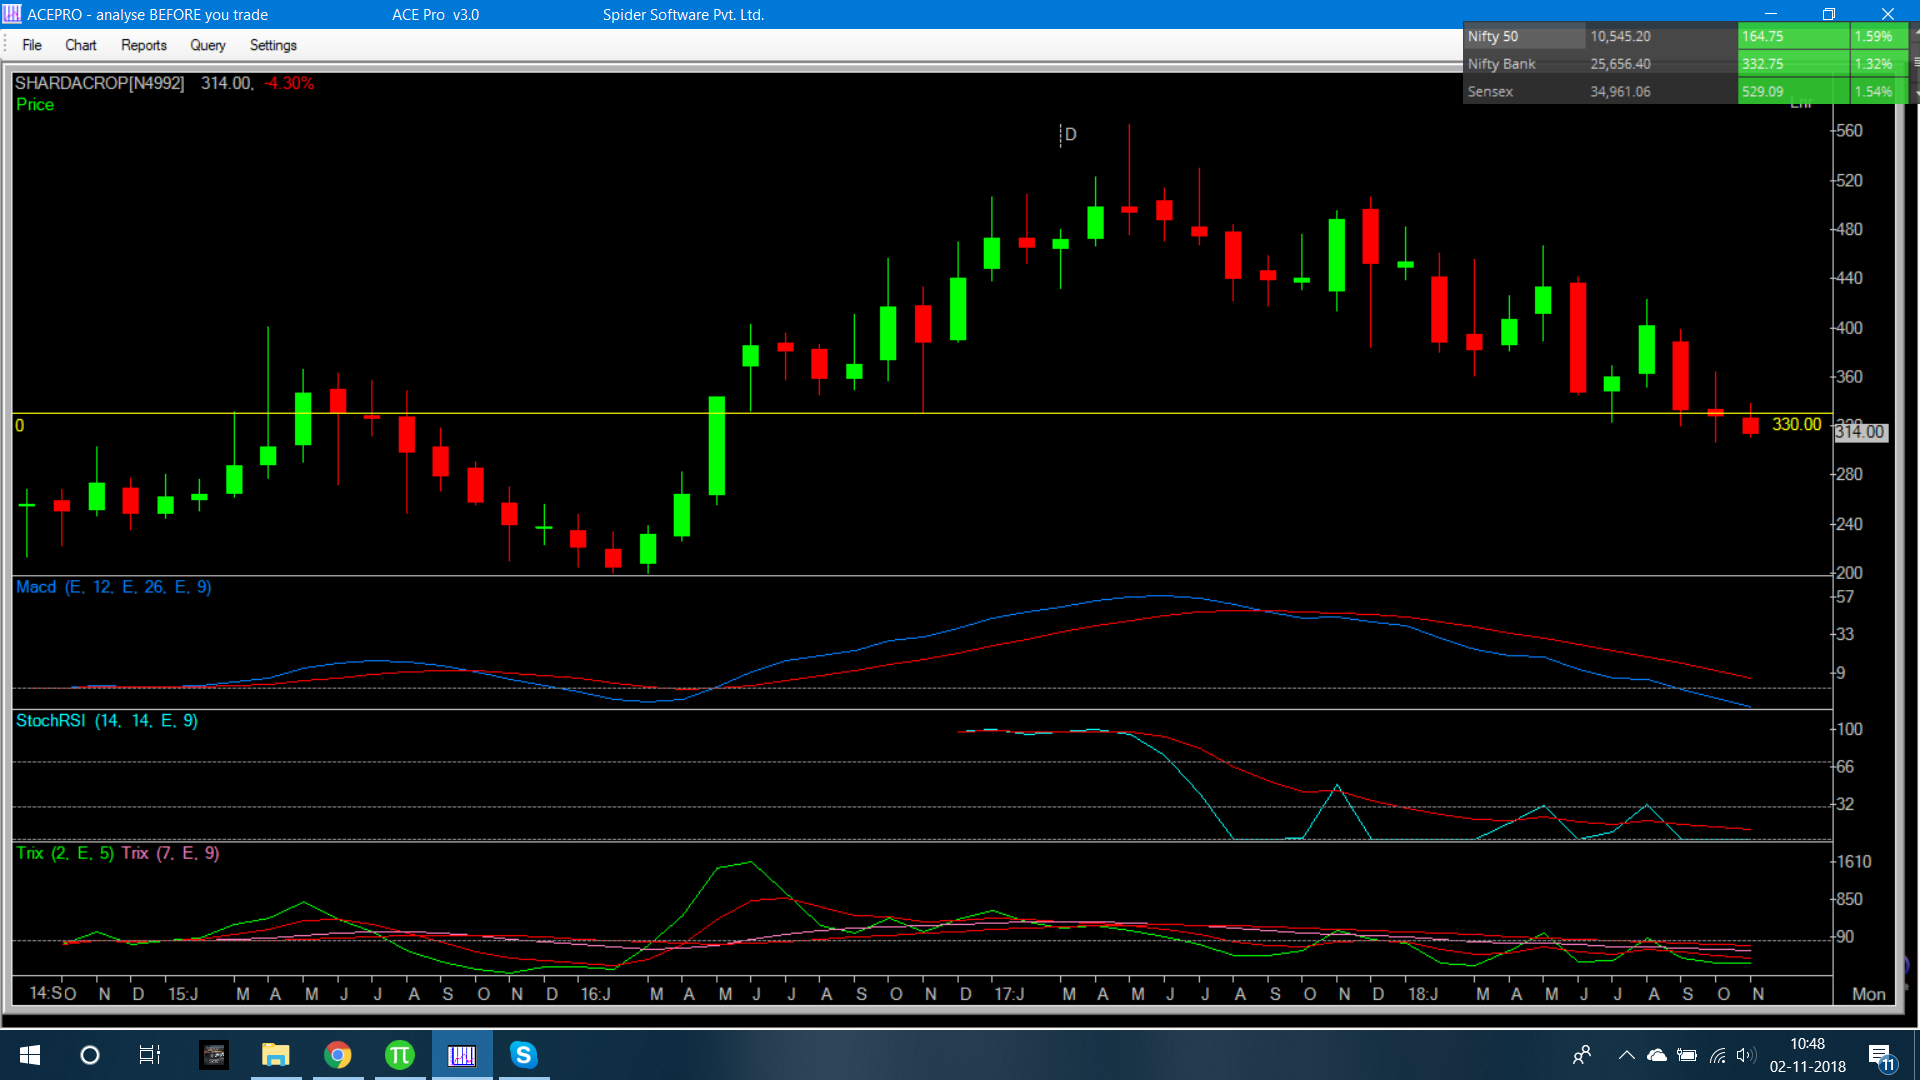
Today i have selected Pesticides and Agro sector which has been down for a while and seems on verge of recovery. Out of 5 stocks between 500-3000 Cr Mcap, namely, Insecticides, Meghmani, Dhanuka, Bharat rasayan and Sharda crop, i have selected 3 stocks which seem to have corrected more and hence have better upside left. All 3 have very low debt, 4 year topline and bottom line growth, good promoter holding and decent ROE and ROCE. Sectoral punishment has seen them come down to attractive levels now.
Insecticides: Stock has seen good bounce from quarterly trendline and indicators look ready to cross soon.
Dhanuka: though stock has broken crucial monthly and quarterly support, a bounce above 396-400 may prove to be a good point to enter.
Sharda Crop: Similar is the case with Sharda where a bounce above 330 can be used to time a good entry. All 3 have potential to double in 1-2 years.
@P-Shekhar How does PI-Industries look on the charts ? Fundamentally looks good and management has guided for 20% kind of growth but stock has not done much in last 3 years.
PI Ind seems to be 2nd largest in the sector by MCap. Topline and bottom line are good for past 4 years. Practically zero debt. For being an 800 buck stock, surprisingly i’m not seeing decent volumes on the counter with BSE volumes even being pathetic. This is reflected on daily charts be the large wicks you can see on candles on almost any given day showing there are a lot of automated orders and the game goes on with no major support breaking but also no major resistance breaking  . Overall monthly indicators look good for a buy on any dip (ideally would have been near 742). I think holding period on this one calls for some patience but if you have faith in the company, then it can go to 1200-1300 monthly trendline in 2-4 years time.

5 Likes
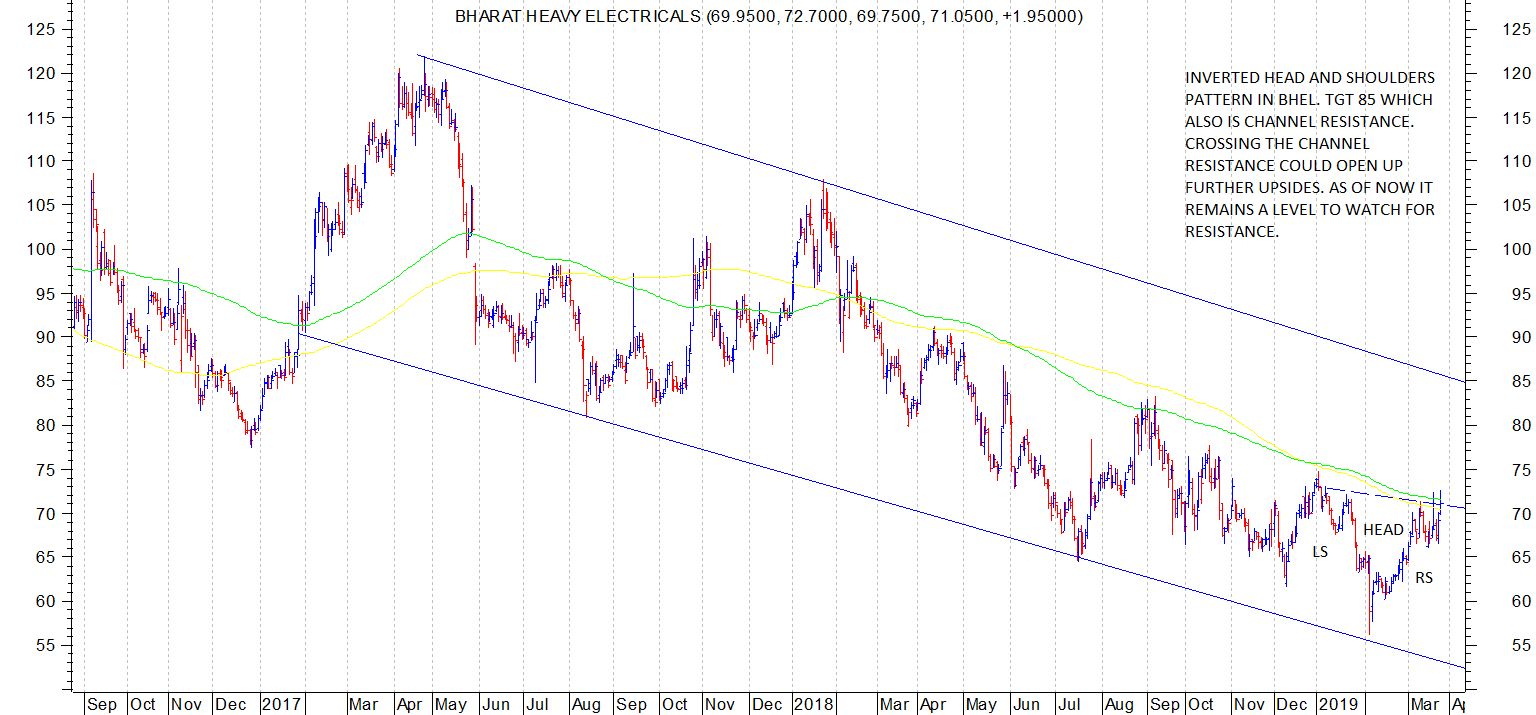
BHEL presents an interesting chart. By closing today above 71 it has broken out of an inverted head and shoulders pattern with potential target of 85. Further details shown in chart attached. A very interesting possibility of trend reversal happens if and when the 85 level gets crossed with volumes and stock price sustains above 85 consistently. (disc: bought as a trading bet)
5 Likes
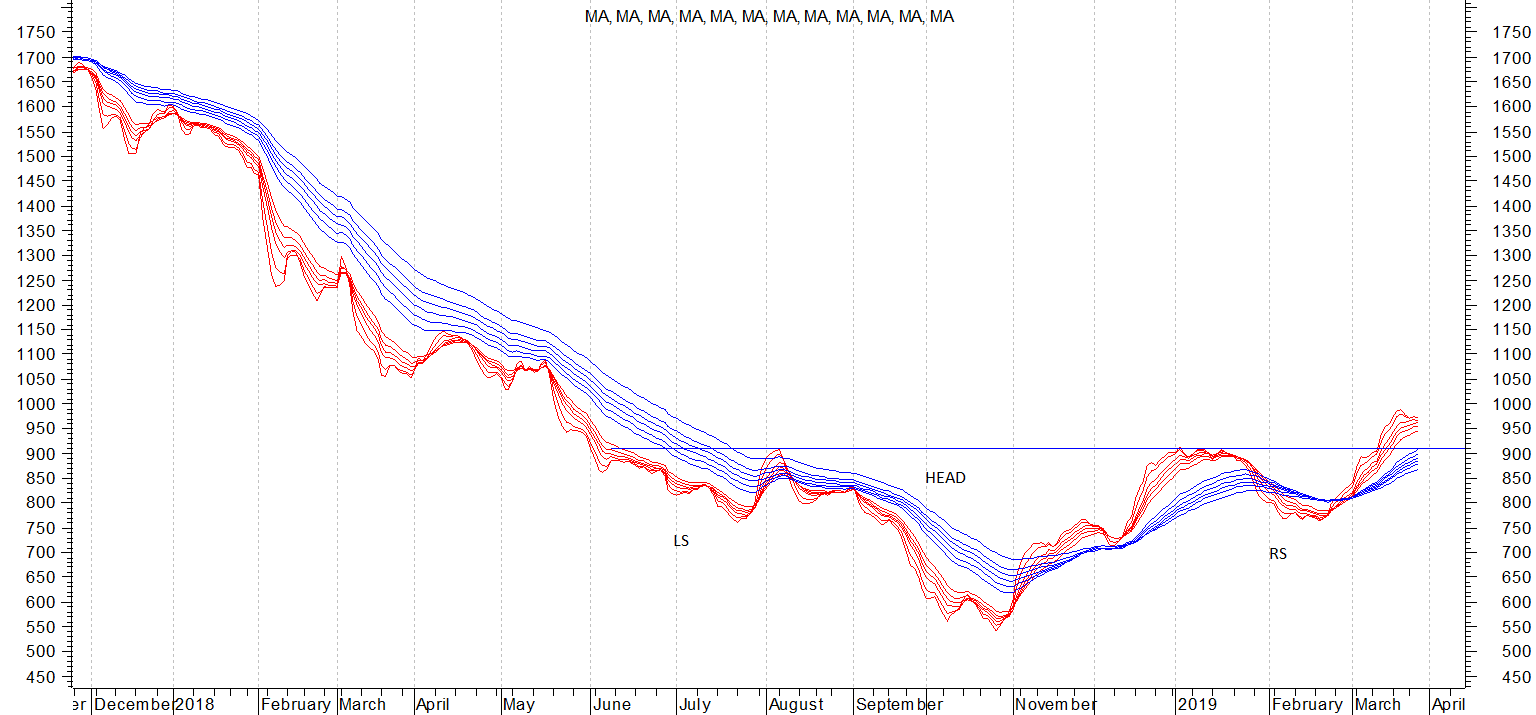
BEML shows a classic inverted head and shoulders pattern. Breakout point 900. Height of pattern is 360. Tgt could be 1260. (disc: invested as a technical bet with strict stop loss of 900.) BEML is traded in f&o and is often under f&o ban due to very high open interest and could have big swings.
6 Likes
I would avoid 900 as an SL as after neckline breakout on this pattern , re-test of neckline happens most often. 840 sl would be better. You are looking at 1330 or so target so the 840 sl may be worth it. Try and not SL urself for no reason on a good trade
nice job. By monthly rectangle seems to be at 120 resistance. Can surely try for that target in such a market where 12k seems on cards on Nifty soon

Another couple of beautiful monthly charts from bullish sectors for huge targets (above 50%) are seen in auto sector Force motors and Realty; Indiabulls real estate.


I feel with a bit of patience this year one can double money on these 2 in 7-12 months
Disc: Invested in both
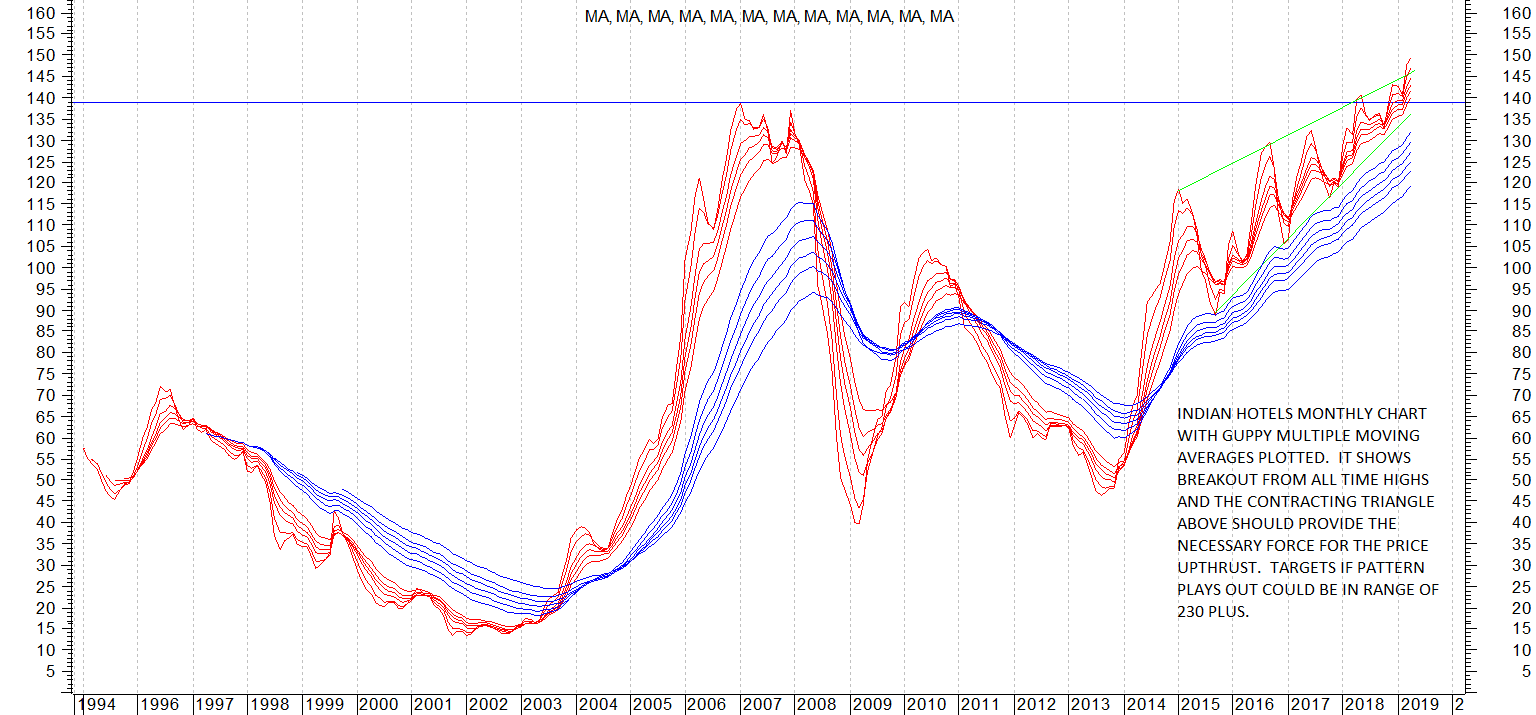
Putting up a monthly chart of Indian hotels ltd. The chart shows on guppy multiple moving averages system crossover into all time highs. The average systems takes out the whipsaws seen with other charts like bar charts or line chart etc. I find these GMMA pattern formations in long term charts very useful. The depth of pattern is 90-100 Rs and breakout point is 140. Target could be 230-240 and since it is a very long term monthly pattern it will take a long time maybe a few months to play out. IF it plays out risk reward is quite favourable. In the past stock price has taken support in the zone of 130-135.
Fundamentally speaking management had in its presentation dated Feb 2018 spelled out its aspiration 2022 plan where they aspired to raise net profit margin by 10% by 2022. Since past few quarters reported numbers have been quite good and it this continues there could be big improvement in numbers going forward too.
Looks like a good techno funda combination. (this is not a recommendation and anyone contemplating investment should do their own diligence). disc: invested and accumulating gradually.
5 Likes