following are a few observations which can have very high returns (above 70%) this financial. Fundamentally all are strong (by my view) and can be great place for TA entry
NFL
LindeIndia: there are almost confirmed talks of Praxair merging with Linde which makes two top contenders in sector merging
as hitesh2710 and i had discussed some weeks back IBHF held 580 and cleared 660 making it a buy. Again one can use dips to buy for 1300+ targets this year.
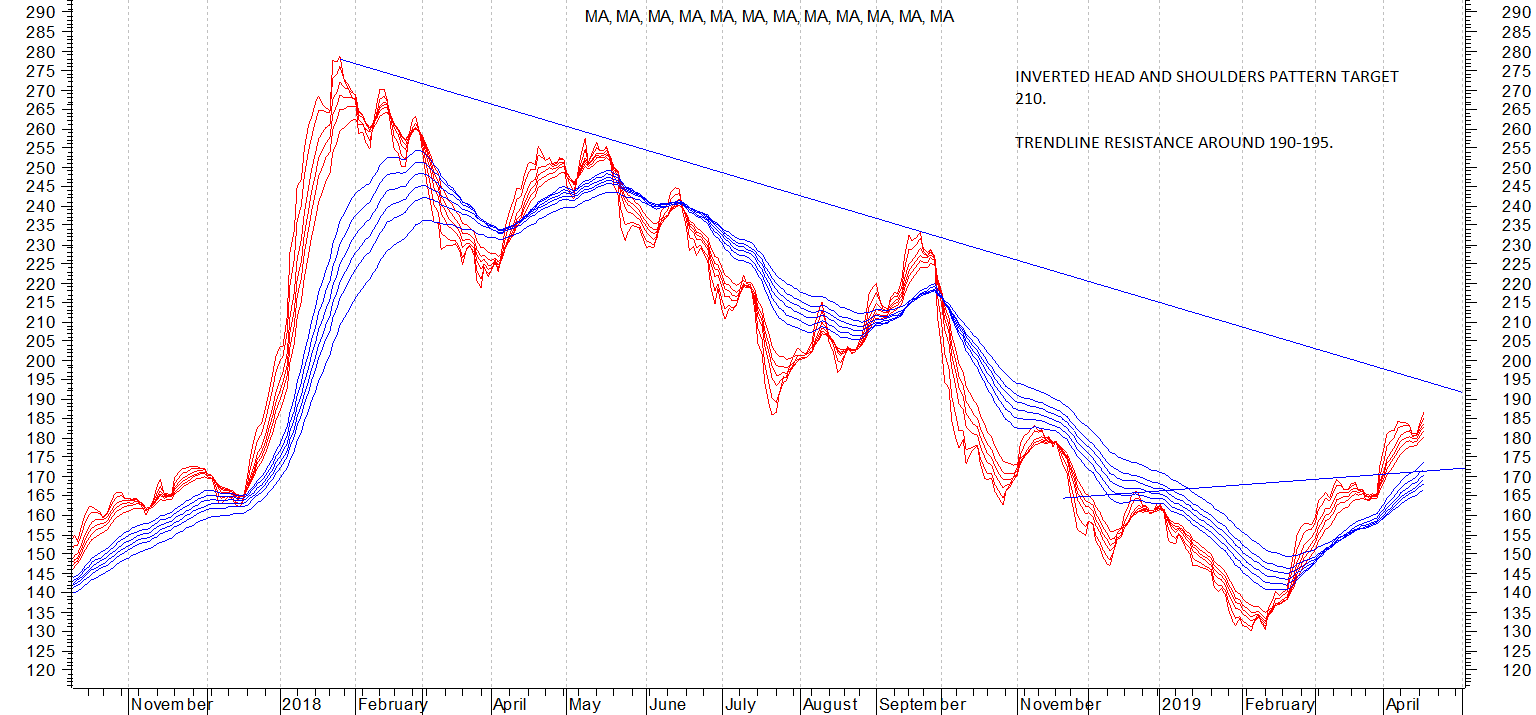
Hi Shekhar, can you please explain how did you draw these diagrams and target? For example, in the India bulls chart, lower line of rectangle is joining the tops but how did you draw the upper line? Why does it lie at 200 and not say 150 or 250. Thanks in advance.
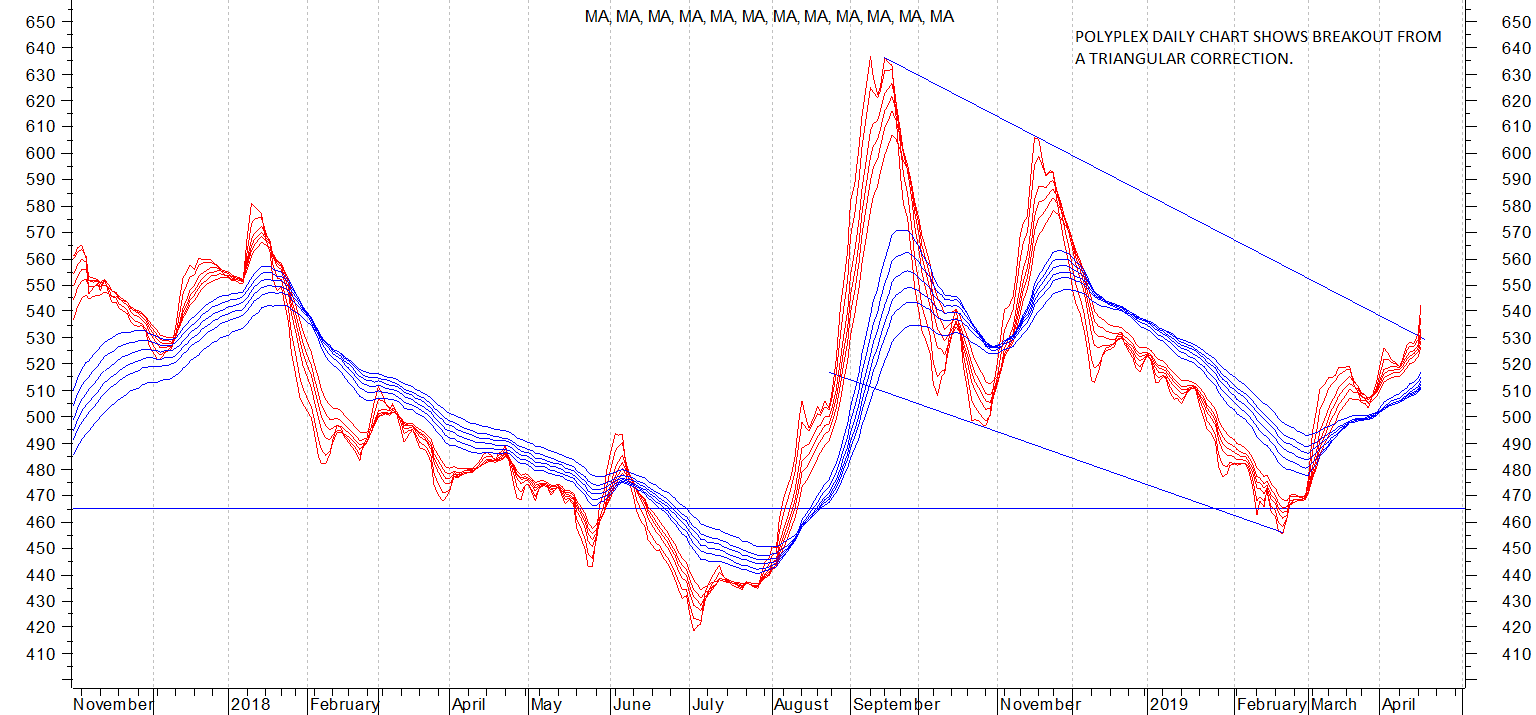
polyplex inds daily chart shows an interesting breakout from triangular correction.
Fundamentally the company is likely to post EPS in region of 90 plus based on 9M FY 19 reported earnings. Company is into packaging films business, (more details can be had from company presentation which has given all its lines of businesses and capex). It comes across as a slightly better company among peers as the peer companies like cosmo films, jindal poly etc have not managed to report decent nos while polyplex continues to report robust numbers. It has margins in the region of 14-16% while other players are below 10%.
Balance sheet is good. Company gives out good dividends. Presentation gives an idea about the kind of value addition the company does in most of its product lines. And well spread out geographical presence helps in reducing geographical risk. disc: invested. (this is not a recommendation and anyone investing should do their own diligence)
company seems to have negative cash and equivalents in past 3 out of 4 years. Though debt has been coming down; cash from financing seems to be at par or higher than operating cash which is not a good sign. Also 57% of promoters shares pledged is very scary. Just my opinion. Chart seems fine nonetheless.
lower line of rectangle is placed at breakout seeing previous highs and trading zone. There is an option to draw rectangle. you just have to stretch it and make it fit. Upper line is placed at 200 as that is where the lows of the 5-6 highest candles lie and will act at stiff resistance. Once above that can do 240-60. My trading style is to try for 100% on stocks for each year. I do not invest for longer periods unless stuck in stocks as many of us may be from 2018 start. In reality trades may fetch 65-70% per year which is good. Besides 109 to 200 is good enough
slightly different observation i made. It seem you have factored Inv H&S but there is actually a Complex Inv H&S pattern. In chart below, lower neckline is yours and upper one is for the complex pattern, which would make the target from 442 to 553 i.e 111 bucks from 553 or target 664. Just an observance…
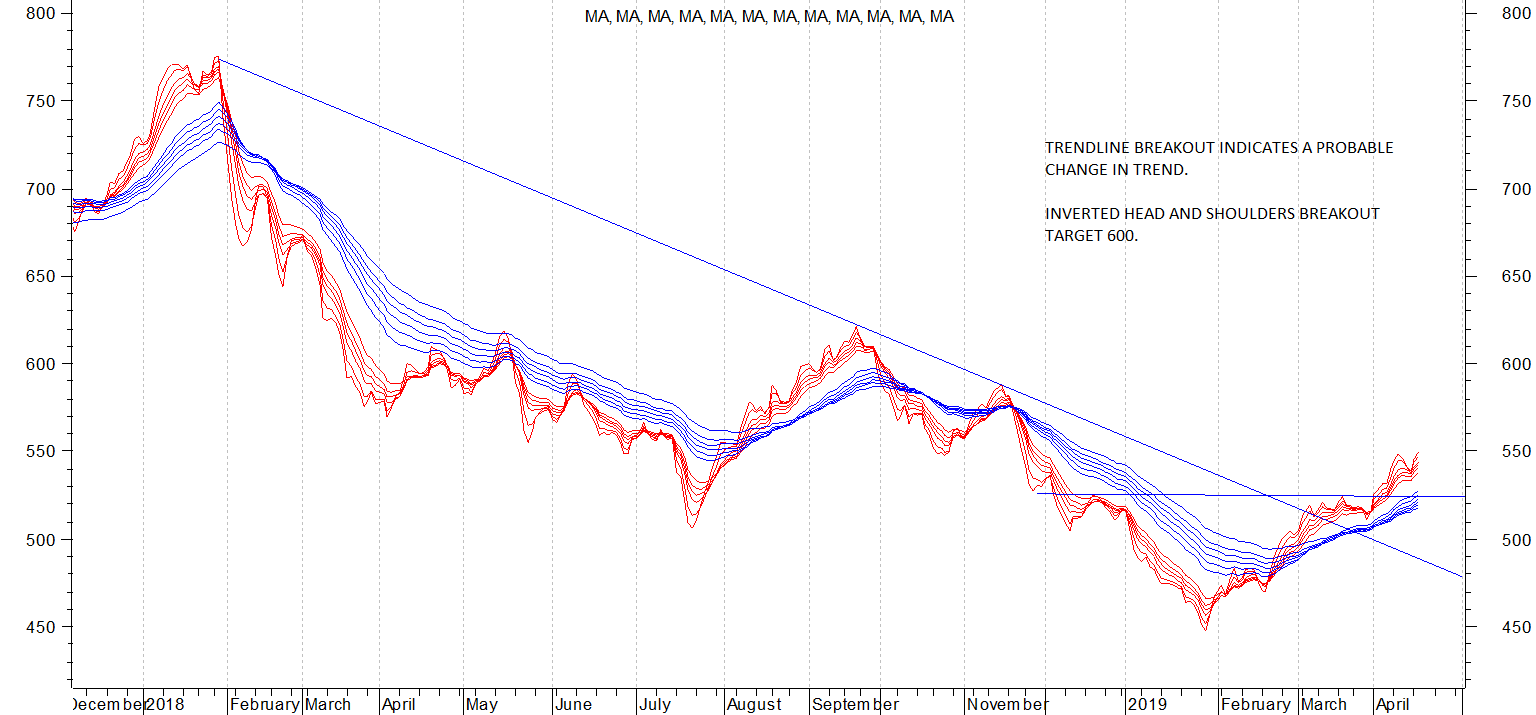
Lower rectangle breakout has happened on monthly and should continue to top of upper rectangle or approx. 750 target
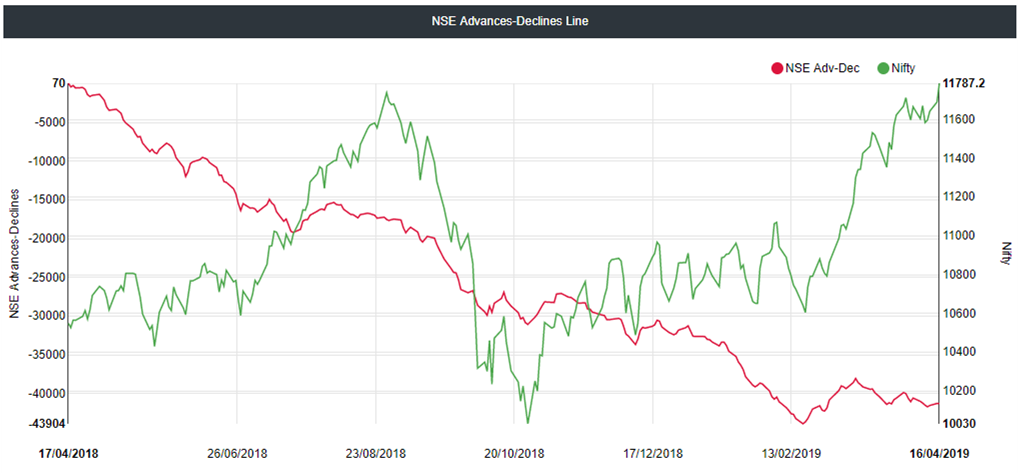
The market has broken into a new high and people are generally bullish. However, market breadth has failed to make any fresh highs and generally it portends a correction if i am not wrong. There is a bearish divergence on the A-D line of the NIFTY and the NIFTY. So there may be a failure of bullish patterns, breakouts etc.
From what i have read - a declining AD line while the broader market is making fresh highs is generally an indication of tight liquidity - where limited money is being channeled into high quality stocks. This condition doesn’t last for long and tends to resolve itself by a steep correction.
I agree with your observation. Declining breadth along with new highs is not a very healthy sign. The rally is reliable if there is enough participation along with sector rotation with intermittent pauses. Bank nifty on weekly/monthly charts has given a range breakout for possible targets of 32000. Charts of big banks are showing more upside , same for nbfcs. Hence one should wait for the participation to improve. But yes if does not then for sure market will correct steeply like a pack of cards. Anyhow the markets is behaving in a classical buy the rumour , sell the news way.(same govt coming to power).
What can be a good strategy to trade the election outcome, one can read them as periods of heightened volatility also.
Regards
Divyansh
I haven’t used this indicator but seeing ur chart it seems from 17/4 to 23/8 (almost 4.2 months) indicator only fell while nifty went from 10600 to 11780. I ma not saying correction cannot come; just observing that currently by ur chart it seems AD is floored compared to previous AD position when nifty was at same place which may lead to bounce in AD and breakout on Nifty. Wish the chart was on a wider time frame to analyse better. Just an observance
@hitesh2710 bhai, Are you still holding IDFC first bank ltd ? It has corrected a bit. Its till looks like a cup and handle pattern still intact. Can you please confirm.