Contrarian investing using technical analysis

The purpose of this thread is not to make any purchase recommendation to investors on the basis of technical but just to point out to the investors stocks which are making a bottom on long term charts / or those stocks which are showing turnaround signals after long consolidation. It is expected that from the stocks charts put up on this thread, investors would do their own fundamental analysis of select stocks and invest in the stocks whose fundamentals fall into their investment parameters.

Most of the parameters used by investors in selecting stocks for investment such as PEG, ROC, ROCE, low P/E etc may not be applicable to loss making stocks or cyclical stocks which are in down cycle. The consumer staples and defensive stocks have already gone up in price hugely and are now discounting a number of years of future earnings and some more. That means that investing in such stocks no longer provides investors with any margin of safety.

On the other hand around three fourth of the market consists of cyclical stocks. And a lot of such cyclical sectors / cyclical stocks have been beaten down hugely because of adverse economic conditions. Sectors such as PSU banks, Steel, Oil, Infrastructure, Power, capital goods are now trading at very very low valuations.

the purpose of this thread is to bring to the notice of investors stocks which are from these beaten down sectors and which are showing signs of turnaround. Investors may follow any of the following strategies for dealing with such stocks…

  1. If a particular company is the leading company from its sector and is showing clear turnaround signs, then it would indicate that the sector as a whole is turning around / coming out of down cycle. The investors can then select fundamentally very good stocks from that particular sector and invest in them for magnified gains.

For example, in Sept 2015, the leading stock in the sugar sector - Balrampur Chini gave very clear turnaround signals. It also signalled the turnaround of the sugar cycle. since then Balrampur has risen from 40 to 140 price at present. But stocks in the sugar sector such as Dalmis sugar, Upper Ganges, Dwarikesh etc have given 10x returns…i.e much more than the sector leader.

  1. Another strategy that the investors follow is to deeply study the fundamentals of the sector leader and then keep scaling up the investment in such stocks as their price keeps rising. In this manner, investors can remain invested in safe market leaders but still reap maximum gains through pyramiding( which is not always possible in smaller stocks or can be very very risky in smaller stocks)

  2. The third strategy that investors can adopt is to invest in allied sectors / or companies which are a sort of proxy to the main sector. Thus investors can participate in sectoral turnaround without having exposing themselves to the sectoral risk.

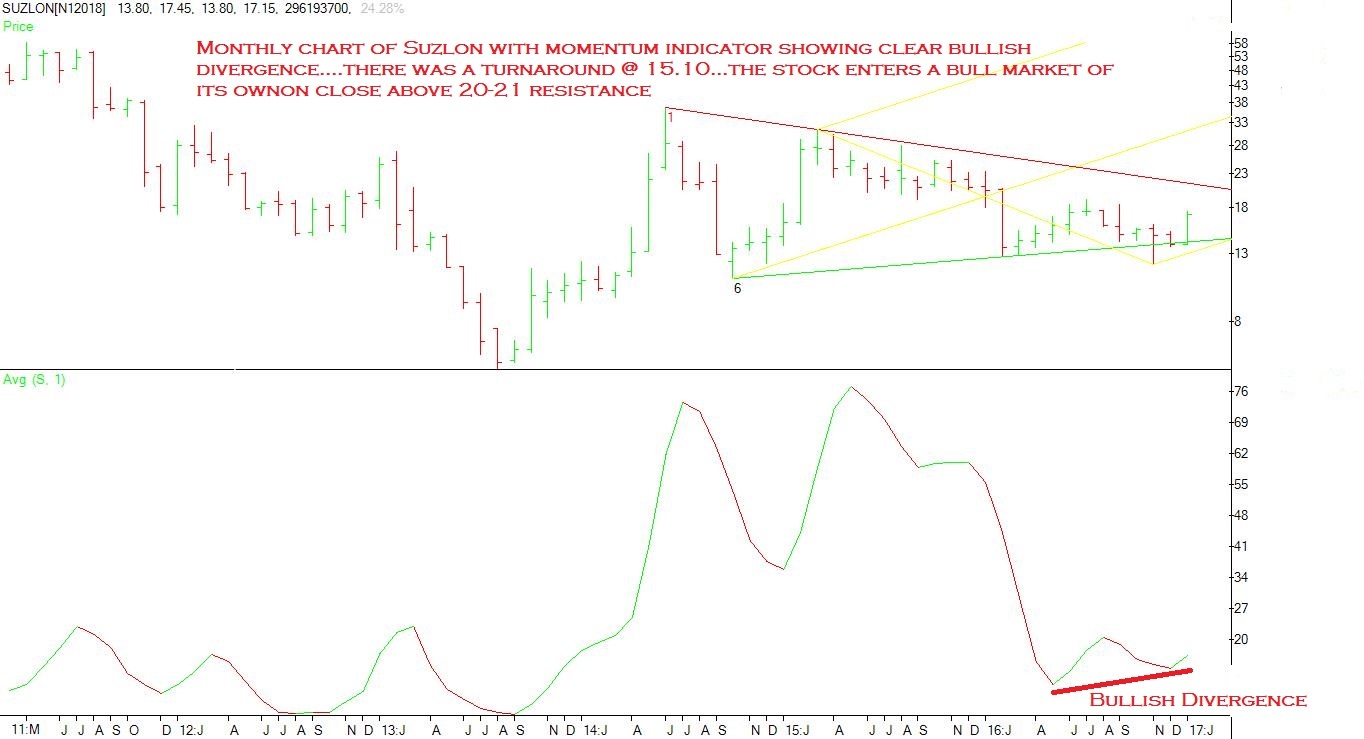
for example those investors who feel that there is a turnaround in wind energy sector due to policies of the Govt but are not comfortable in investing in the market leader _suzlon due to its previous troubles can still benefit by investing in another company such as Sanghvi movers which provides cranes for installation of Wind mill towers.

  1. Another risk but profitable strategy for investors can by investing in a bunch of beaten down companies from the same sector and statistically bet that not all of them would collapse. Just one or two of them would not perform, while the others would perform superlatively.

Thus there are a number of strategies that investors can adopt to gain handsomely from from cyclical turnaround stocks /sectors.

32 Likes

PSU BANKS AND FINANCIALS…

the woes of PSU banks and infact banking sector as a whole due to rising NPAs and huge value destruction have made investors shun these stocks. The valuation of some of these has fallen so low as to attract contrarian buying. But amazingly some of the PSU banks are showing very clear signs of bottom formation as can be seen from the charts below.

The specific pattern that I have selected here is - BULLISH DIVERGENCE ON QUARTERLY charts…a very strong bottom formation signal.

3 Likes

STEEL

A lot of NPA of banks are due to problems from the steel sector. But now the Govt has taken a lot of steps to protect the steel sector from Chinese dumping. In fact, Shankar Sharma in his article in Outlook Business magazine lists Steel as a turnaround sector.

The leading companies in the steel sector such as Tata Steel and Sail are showing turnaround signs in form of Bullish divergence on Quarterly charts. Tata steel turnaround a few quarters ago and has risen up quite sharply from its lows. Same is the case of JSW …and now Sail too has joined these companies. The price pattern of these major steel companies suggests ache din for steel sector in next 2-3 quarters

.

5 Likes

PIPE MAKERS…

The leading pipe making company…Jindal Saw is showing turnaround signs…

MAN INDUSTRIES

8 Likes

A few examples of stocks o the verge of long term / multi year range breakout accompanied by bullish signal on momentum indicator. Once a stock comes out of a multi year trading range, all the investors / sock holders would be in profit. Hence, such type of stocks are expected to go up rapidly after such a range breakout, in the absence of selling pressure.

Have a look at two such stocks…

Discl: I am invested in Aksh Optifibre from much lower levels

Karnataka bank…in the recent edition of the outlook Business mag, Vijay Kedia has selected Karnataka Bank as his pick for the year 2017. according to him, this is a Private bank available at PSU bank like valuations of 0.7 Price / Book value. Also, the bank is set to double its loan portfolio in the next 2-3 years…thus there is a possibility of both increase in book value as well as price to book value multiple. The thesis of Vijay Kedia is backed by the technical too, as can be seen from the chart below.

Aksh Optifibre: I have written much on Aksh Optifibre on a separate discussion thread…hence just putting up the long term chart here.

Sterlite Technologies: The leading and fully integrated optical fibre cable manufacturer in india…Expected to benefit hugely from the Digital India , Smart cities, Bharat net program of Govt of India. Mngt expects to double the turnover in next year…has a high ROC of 20%…

disc: hold a small position in Sterlite Tech

5 Likes

It is very interesting that you have started this thread. I have been engaged in investing using TA for quite some time and find that it works wonderfully for me.
Since majority of the readers and users of this site are value investors or would like to be, they may baulk at the idea of investing based on TA. Most of the time, it is more out of a misconception of what TA can do when used differently. So, I would like to add a few points on the concept of TA based investing for this post.

  1. Mehnazfatima has shown a few excellent examples and has used the concept of divergence pattern on a quarterly chart as the initiator of the signal. As a tool to identify stocks making long term lows, this is a very good, low risk way.
  2. For those who may be unaware of the philosophy behind this approach, a few words. Those that are aware can skip to the next point.
    Divergence occurs as a pattern when a movement in price reaches a new extreme but is not accompanied by momentum in the same direction. This signals a potential turnaround situation (provided a few other elements are also present). The basis of this conclusion is that, as per the laws of physics, force needs to be applied to a body in order for that body to move in space. The measure of this force thru time can be expressed as a momentum study. When the momentum of different legs are compared, it throws up information when momentum slackening occurs. When this becomes visible, a correlation to the prices is made and a comparative reading of the two are taken to arrive at a conclusion of potential reversal. This is what creates the ‘contrarian’ set up, as mostly, at such a situation, the outlook is the worst, the news flow is quite bearish and the sentiment quite negative.
  3. Contrarian investing using TA to signal us potential bottoming situations works rather well with value investing. Once value is identified it requires one to scale in the buying or take a long position and wait. The odds of success can be increased greatly if one has some additional ways of establishing that the time to 'value hunt ’ or turn contrarian is at hand! TA helps a great deal in this matter.
  4. While one method has been highlighted, there can be several others as well. For instance, in addition to the momentum signal as defined by mehnazfatima, we can also work in price, time and pattern analysis to confirm the bottoming situation. This involves deeper knowledge of TA tools and requires a lot of work. This is the reason you dont see it in the public domain. But like in any other area, it is easy when you know how!
  5. One of the difficulties in the big winners is being able to hold the stock until it realizes its higher potentials. Value investors have to go on the presumption that they will be able to get the necessary information that can help them decide on continuing the investment so long as they see the potential continue to unfold. However, this may not really be the case in every stock, particularly a small or mid cap stock that may have some opaqueness about information flow. Or perhaps inconsistency in the news flow. At such times, a proper structuring of the price analysis model using TA can help one to track the flow of the price thru time. This has to be done with some care as it is quite easy to be misled by noise in the market. Hence the model needs to provide for such aspects. This again requires deeper knowledge of TA and how to string together longer term variables within TA. Again, the main reason that it is not visible in the public domain.
  6. A way to build a larger return from any stock is to be able to add further positions on it when it pulls back during the course of its advance. This too can be achieved well by TA set ups designed for such a purpose. I use an approach that I have called as the Wealth Builder Pattern that helps me find stocks that continue to retain their strongly bullish characteristics thru even deep pullbacks. The logic I use is that deep pullbacks occur because existing holders take profits. But if the story remains undisturbed, the stock doesnt show weakness the way it would if the trend has changed. The Pattern helps me to spot such candidates and board them during reactions.
  7. Of course, like anything to do with the market, we are dealing with probabilities of events happening. Value investing creates an edge for the buyer when one has been able to identify the value. Adding TA to the mix in the correct way, will improve that mix and also help us along the way too.
  8. Finally, accepting that TA can aid value investing as a process needs a flexible mindset that allows for the fact that TA is not just a trader’s tool and that it is especially helpful in investing. I can write more on the subject and discuss approaches in case members show interest in this project.

thanks to mehazfatima for starting this thread.

12 Likes

Narayan sir, i have started this thread eith the permission of the valuepickr moderators.There were only two conditions for this thread…1) refrain from giving price targets and 2) it should not lead to short term trading calls.

With these two stipulations, i too request you to post some interesting technical picks for long term investing.

5 Likes

Moe than finding some investment candidates at the moment, I am more inclined to create posts that could highlight for the other members about how TA can be of good value in arriving at investment decisions.
Having been a follower of TA methods for over 35 years now in the market, I have found that there is very minimal understanding of what TA really does and this has led to considerable number of misconceptions and incorrect images. The level of analytical depths that various members of this forum go to within FA is much beyond what is practiced in the public domain of FA. Similarly, TA practitioners that abound cater to a certain section of the market owing to commercial needs and compulsions. It is difficult to sell complexity to an audience that does not understand the complexity. Also today we are having an Instant World, where everyone is looking for immediate answers and results and hence the TA that is commonly practiced is catering to the inhabitants of that world. it seems to serve the business interests of TV channels, broking houses, traders and TAs.
But the subject itself is much more detailed than what is available as information at the surface. And it is that area that I would want to target for discussion as I believe this is a forum of serious people, those that are committed to not just earn but also learn considerably.
Hoping to kick off some interest. Lets see.

12 Likes

Asking every member of this thread…

  1. After valuation of a particular stock … charts to look into to decide how much bottom it can create in future? I am new to TA
  2. Can TA be applied to cheap stock i.e stocks trading below cash n investment value im BS.
  3. I have started with OBV,MACD,ADX to understand TA .am i going in right direction ?

Sir, we are very much interested. Please enlighten us.

Dear All

Dr Van K Tharp is conducting workshop in Singapore after a long time (Feb
18 till week end); in case you are interested. If you need help let me know
, will try something if I can do, I am there by the way.

http://www.vantharp.com/workshop.asp

Those who are not aware of Dr Tharp, he has been associated with some of
greatest traders of world. Basically he is a trading coach who focus on
creating trading systems which is fit for purpose to an individual. He has
written several books, worked extensively with even Turtle guys.

More than charts and entry set ups he covers entire trading psychology,
mathematical importance of winning bets etc which is applicable to any form
of investing.

You can listen to some of his interviews by Michael Covel.

1 Like

Trading is a different ball game as compared to investing. One can never become a good trader by reading books and attending workshops. One need to read thousands of trades by reading charts and do real trades. It is basically paying tuition fees to Market. Basically, it is the price which matters. Cover the risk so that capital is there for your next trade and the upside is whatever market gives. Expect certain percentage of trades to fail statistically ( lets 40% to 60%). The winning trades should take care of losses and return. It amount to cutting the loses and running the profits.

This is from my own experience as I have read many books from Jesse days and also attended workshops of the so called experts. In this context, read the latest Memo of Mr Howard Mark. I have matured into a trader who trades index and options successfully. Though I started as an Investor and still a LT investor.

Read this reproduction :
that this is a probabilities-based business and
EVERYONE, at some point, is going to be wrong. Just as I
mentioned in Wednesday’s Charts of the Week, our goal is
discover and place, on one side of the scale, all the existing
positives we can find about the markets and then see how it
balances out after tossing on the negatives on the other side. But
there will always be pieces of information that are missed or that
just can’t be known in advance (and sometimes the pieces you
think you know are just wrong), so there is ALWAYS a margin of
error when trying to gaze into the crystal ball. That is why
disciplined risk management is what keeps the winners winning
in the long-run, and why flexibility and the ability to admit defeat
are two traits you need to either already possess or that you
need to seriously work on.

Lot of hard work is required on a continuous basis to become a successful trader. Whereas investing is major part of the time inactive once you identified a good business.IMHO, attending these kind of workshops will not help.

2 Likes

2 Likes

@Mehnazfatima I have recently started learning Technical Analysis and of firm belief that this could be used along with fundamental analysis to get right entry points. Just a quick question - to derive the bullish divergence pattern which TA indicator you have used?

I burnt my hands with TA, but I have always made money with fundamental\value investing. I invest\trade with cycles and was invested in sugar stocks, currently invested in steel.

Mehnazji: Hearty Congratulations on starting this new thread. You are now known technical analyst with bold recommendations. My best wishes and I am sure Investors will benefit to great extent through your candid analysis and others who will contribute to this thread.

2 Likes

ckn,

It would be great if u can provide insights into detailed technical analysis. You can even start a new thread if you find it suitable. I am sure someone with the kind of experience you have mentioned would be of immense benefit to the VP members esp those following/willing to learn technical analysis.

rgds
hitesh.

6 Likes

I had hoped that the technical analysis part would lead to a detailed discussion on the fundamentals of the concerned sectors or stocks. But am a bit disappointed that such a thing has not happened.

It is peripheral that Sail has risen bu around 27% or suzlon has risen by 25 -30%…or sterlite tech and jindal saw are in uptrend…what we are missing is the possible cyclical turnaround in steel sector…or wind energy sector or pipe manufacturing…or optical fibre cable makers…all these sectors have been in a down cycle for almost a decade…

If we are able to catch cyclical turnarounds, then it opens for us immense potential for making good gains.

The second thing is that without fundamental analysis, tech analysis is just a few lines on a chart. I would not recomend buying anything just on the basis of technicals. But again, most of the messages and queries that i get are only witj regards to tech analysis…and that too short term basis.

Thirdly, i do not claim any sort of expertise in tech analysis. I am basically self taught…that too only from books…no internet based or you tube based posts for me. Just pure and simple old fashioned learning from books. And my focus is mostly on bottom formation process…i believe that we are in a bull market…iif we ate able to invest in turnaround stocks at the very bottom, after deeply studying their fundamentals, then for the next 2-3 years our job is done…we need not do much after that.

Finally, my intention is not to do very complicated or complex things but to point out vrry simple yet strong technical signals on long term charts…what can i explain in the above charts other than that which is so clealy and apparently visible on the chart.

So i would really appreciate, if there is a deeper discussion on the fundamentals…we just use bullish technicals as a screener to shortlist stocks for fundamental study.

8 Likes

Disclosure…i am quite well invedted in sugar, optical fibr cable makers, wind energy sector, infra finance…and to some extent in steel sector too…i am quite happy that my stocks are doing ok…and i have a vested interest in ensuring that there is a deep discussion on fundamentals of the said stocks either here or on stock specific discussion threads

2 Likes