JP GROUP seems to be going for a revival…JP Associates already appears in a Leading diagonal, however, posting below the chart of one of it’s group co. JP Power, which seems to have been done with the correction of 2nd as well…
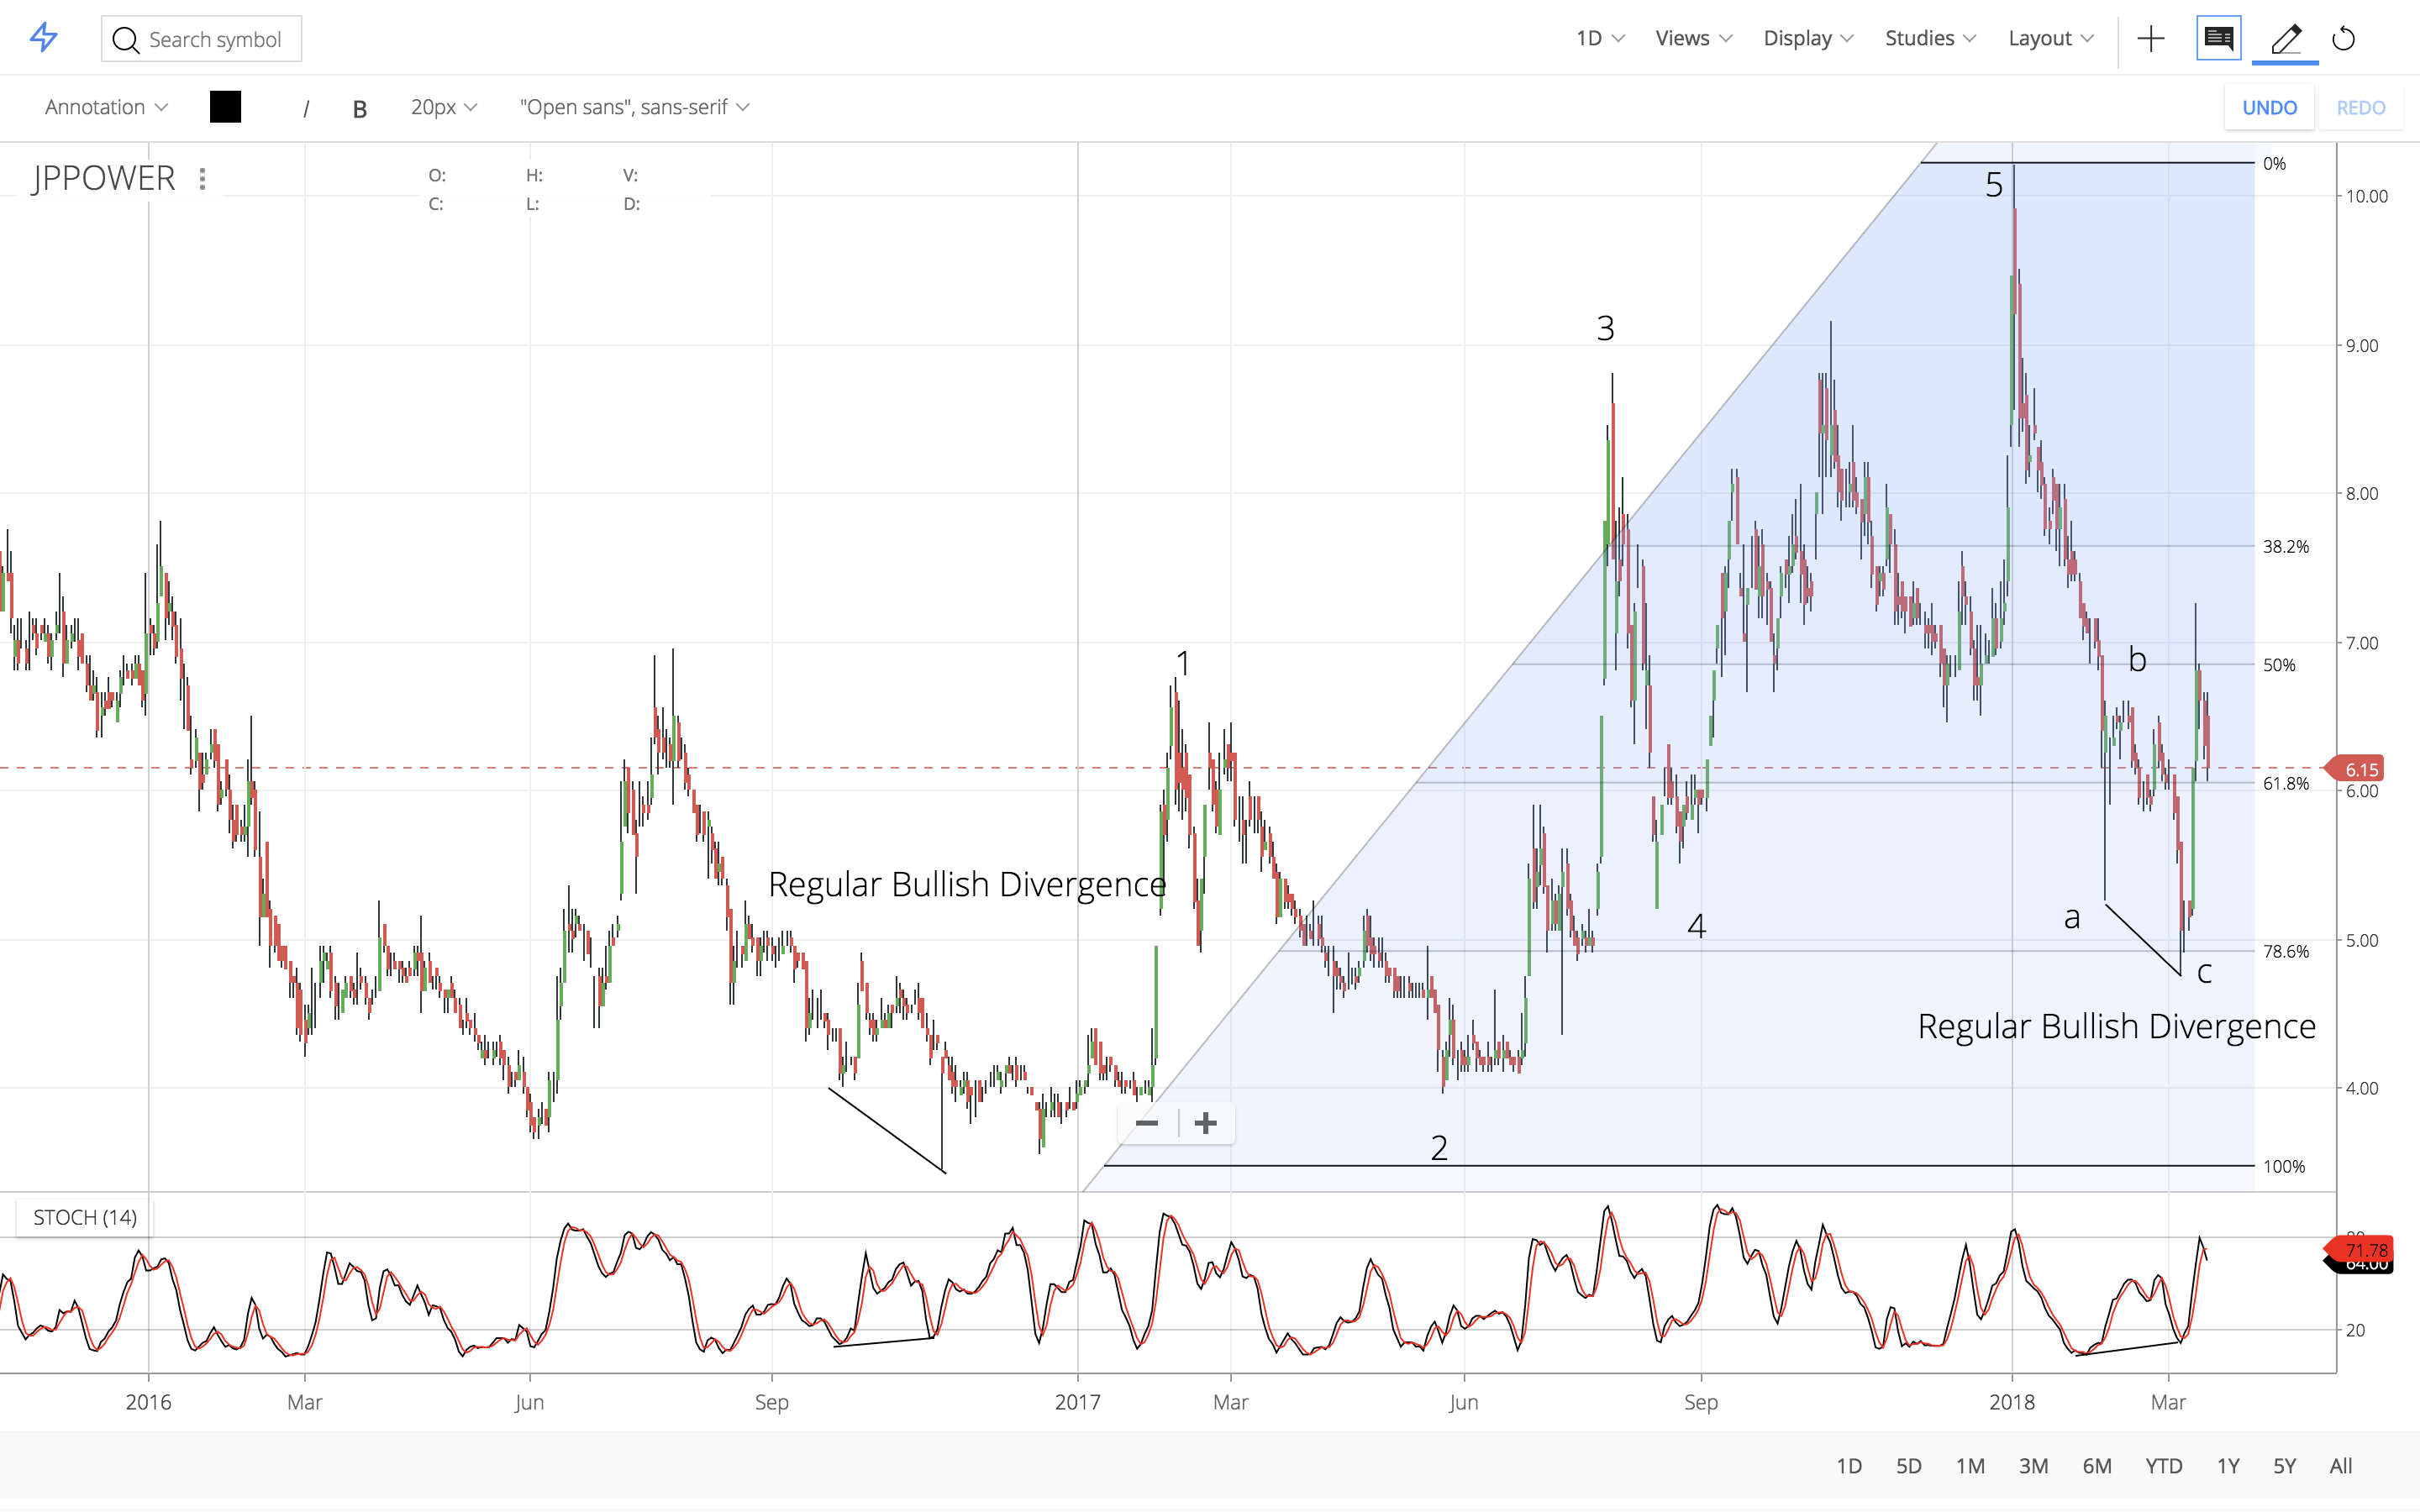
This is not valid Elliott Wave count. Wave 4 can’t enter the territory of Wave 1.
Haha! Dear PE_Ratio!, It can in the case of Diagonals, which seems to be the case here (Leading Diagonal).
1 Like
Yeah, you are right. It’s leading diagonal formed in wave (1). Sorry I didn’t consider it as a diagonal since to me it looked like a channel at first with no convergence.
1 Like
Hello,
Anybody willing to call a bottom on lupin.
Thanks
Hello Mehnazfatima,
What trends do you see for Lupin and Tata Motors, both stocks have been beaten to death due to various reasons and looks like a bargain to me from long term (5+ years) perspective. Does technical chart suggest another decline for Telco till 280 and for Lupin till 650 ??
1 Like
Could you please help that how one can determine and measure the pole height ?
Technical views on Piramental Enterprise. Is correction over ?
According to me , it looks really weak on the charts. Has been underperforming the nifty. Nifty is at a monthly high and piramal at a monthly low. Since there are no new drivers for the market to go up , if the range of 10000 to 11000 continues for the index… any meaningful correction for index might lead to new 52 week low for piramal. The only saving grace/element would be good quarterly results which might change the downtrend or support the valuations
2 Likes
Looks like I got the turnaround in IT sector correctly.
2 Likes
Views on hikal please ?
The price action is going on with its volatility, no strict evidence of absorption of supply, no sustainable demand in the price action…
Charts are totally inconclusive to me…
Disclaimer… No poaitions, tracking
Please try making posts which add value to the forum rather than these one liners. About the issue of targets and so on, please make sure you give a logical explanation of a pattern and then explain the target.
Your thread was probably deleted because there were too many threads on technical analysis and hence no need to keep on starting new threads. Existing threads are enough for putting up stuff and posts on technical analysis.
This forum is about sharing knowledge and learning and not about gyaanbaazi and oneupmanship.
8 Likes
@praveenks74
Regarding ur query on Mindtree. The stock has an M top on monthly charts from 1190-930 or 260 points downtick from centre of M. this translates to 930-260= 670 as possible downside levels in coming months. Trendline connecting old highs and lows also projects similar targets. MACD and StochRSI are also on sell mode making downside target seem even more believable. In actuality levels of 630-610 can also be tested going by lowest lows in 2015-16

5 Likes
- I don’t rely on patterns that much anymore. Neither do i use/have knowledge of wyckoff, point and figure,etc. After having learnt the gamut of things; i decided to keep things as basic as possible. What you see on chart above is all that i use and it hasn’t failed me till date. Will be using the same chart patterns and indicators for all analysis i do in future for any stock. Am planning to start today itself of listing some of the stocks which appear to be at monthly/quarterly bottoms and can have immense upside.
- I will not be delving into shorting as i do not short myself and buy only in cash market for longer term hold trades. Some trades may be long enough to be called an investment itself. (also short term targets are prohibited on VP)
- As for Acrysil, i am not seeing any increase in PAT since 2015 (in fact only fall). Chart structure from 2015 also leaves a lot to be desired. I.e. nothing significant has happened. Debt has only increased from 2016. ( I omit companies which don’t have either very low/ zero debt. ROE and ROCE are 6.1 and 5.3 . Here again wherever possible i look for companies with both values above 9. I try to look for increasing topline and bottomline for past 3-4 years too. Only problem here is, since i buy stocks at 52 week low, 2-3 year lows. Fall in earning may be one of the reasons for fall in price. Could be sector based too or whole market itself falling. I also ensure shares are not pledged by promoter or if so , then quantity should be very small and justified as to why it was pledged. 646 shares traded only on BSE yesterday does not say anything decent about volumes on the counter either for 500 buck share. Avoid companies which look like you or I could single-handedly affect the days movement. Shows things aren’t right.
- Alembic pharma weekly and daily charts itself are weak. If those indicators work out their bearishness; soon monthly and quarterly charts will be affected too. besides the stock is trading too high by my system for a buy. I would not consider it unless i see levels of 420-40 or 2015 and 2018 lows come. Or chance has been missed recently at 420. Bullishness in indicators could lead to further upside but i’m not seeing that as of now.
today i will be analysing few of the stocks from Pharma sector which has been beaten down for years now. I feel this sector could aid the index in the next bullish leg up for the markets.
Lupin is looking exceptionally good for a long term buy. Monthly and quarterly MACD have given crossovers (NOTE: i use shorter settings for MACd, TRIX and Stochrsi on larger frame charts for obvious reasons). Daily and weekly may seem a bit weak for now as Index itself has a negative bias. Stocks such as Lupin had been crashing all thru Nifty’s move to peaks. finally when index is crashing these pharma stocks have managed to hold their yearly lows and have been consolidating for upmove. Half yearly indicates that once momentum picks up Lupin can be on a bull run for 2 years or more. Currently a move above 950-1000 should provide that momentum once the monthly trendline is surpassed with volumes.

3 Likes
2nd candidate from same sector is STAR. Though quarterly MACD is yet to cross (may happen around 540 levels and will match breakout in mid 2014 also) all indicators mentioned for Lupin seem ready to act out on this counter also over next 2 years+.
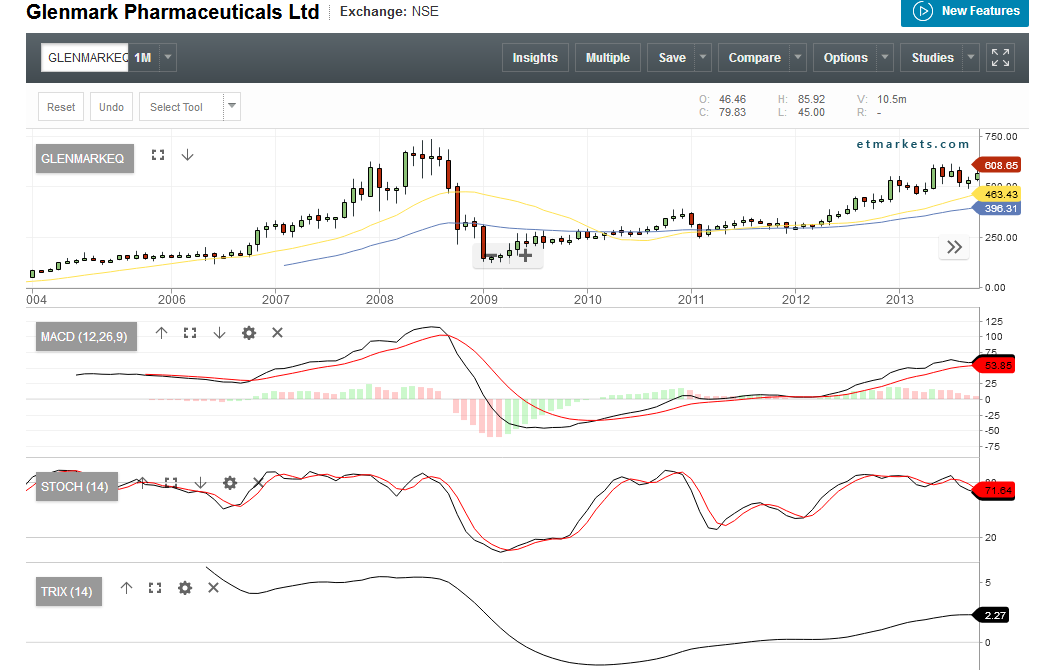
Last candidate from this sector is Glenmark. One of the superior charts in pharma with crossovers on all 3 indicators on quarterly frame and MACD cross on monthly frame. Above trendline approx. around 730, stock can see momentum build up. NOTE: Also see 730 corresponds to 2008 peaks which has been beaten only once in past (horizontal line on chart) Expecting revisit of all time highs in years to come along with the other 2 mentioned.
I hold all 3 stocks. Not sure if this disclaimer is required but have just seen others mention it , so just following suit… 

Kindly note if you have any queries regarding any other stock, try to ensure they adhere to my fundamental basics i follow for entry as mentioned above to @Capsule91 or as best as possible at least.

@P-Shekhar, good approach, just have a query about your chart, I see you are using monthly MACD cross over, but MACD is still below 0, so momentum is weak, and it could take long time before momentum picks up and MACD crosses 0 ( have observed that most gain in stock price comes when MACD is above 0 on monthly chart with bullish cross over) , so how are u so sure that waiting time in these stocks are not long?
1 Like
you are correct. I use MACD for further clarity on buy. As you can see, it’s a lagging indicator. To overcome that, i see stochrsi which is leading in comparison to MACD and has already given a cross as you can see. Sometimes with experience and conviction, i buy before either of them cross also to get better pricing especially if whole sector is down and it’s just a matter of time before upmove starts. Waiting for MACd to cross zero line as textbooks advise can lead to missing out on a good 20-40% move from floor.