
Newbie to technical analysis. Identified that the below chart of Bank of Baroda indicate a bullish divergence in RSI. Is this valid?
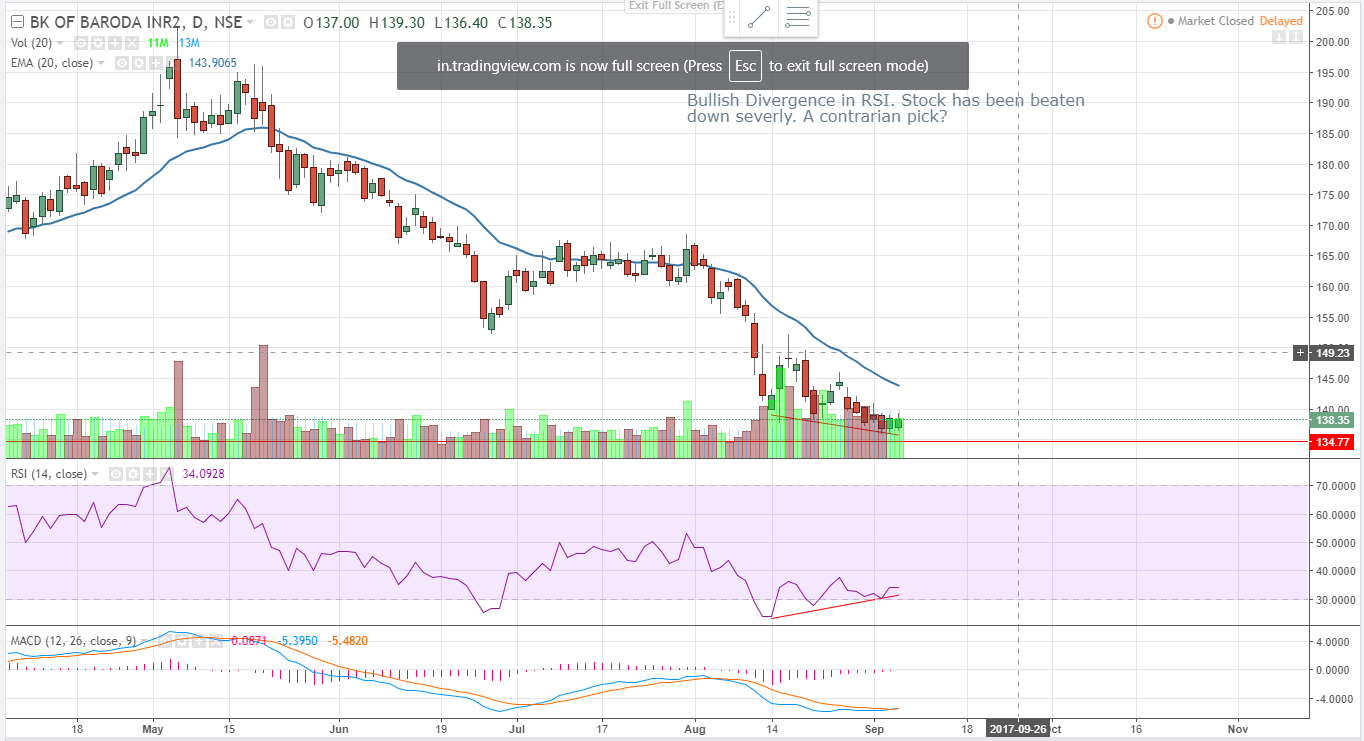
yes, plus 135-137 is a strong long term support. other indicators are also turning up. good to go long with a 4 point SL.
1 Like
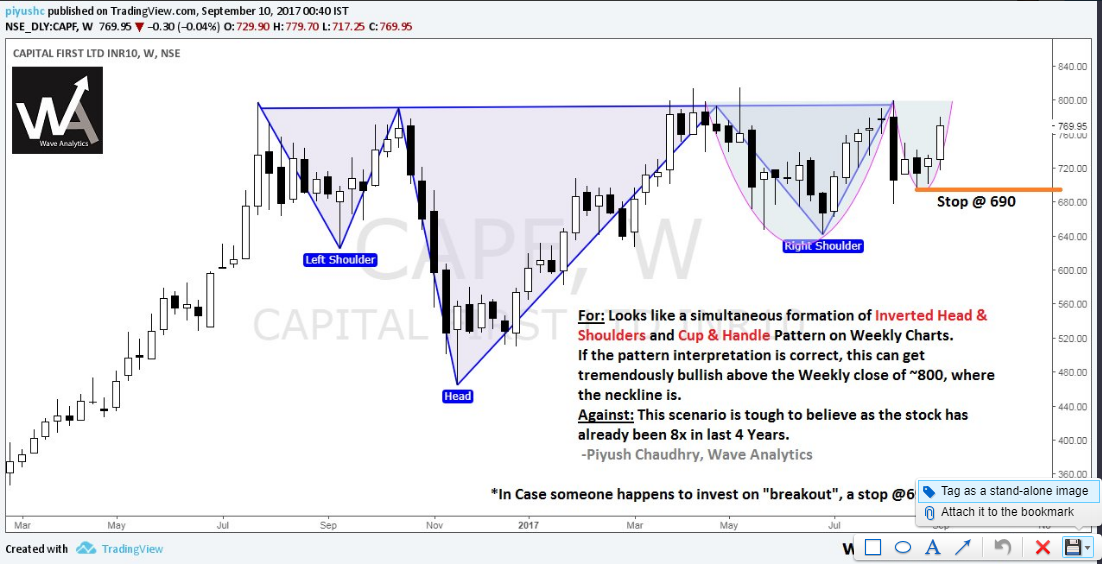
@Mehnazfatima @j2eeprofession_ picked up this chart from www.waveanalytics.in. Do you concur with their observation?
1 Like
yes. In my books a weekly close above 796 (or atleast two consecutive days close above 796) or a weekly RSI triangle breakout above 61 triggers a buy signal and it will then will get good momentum on the upside. So right, i concur with the given chart of bullish momentum above 800 weekly close.
1 Like
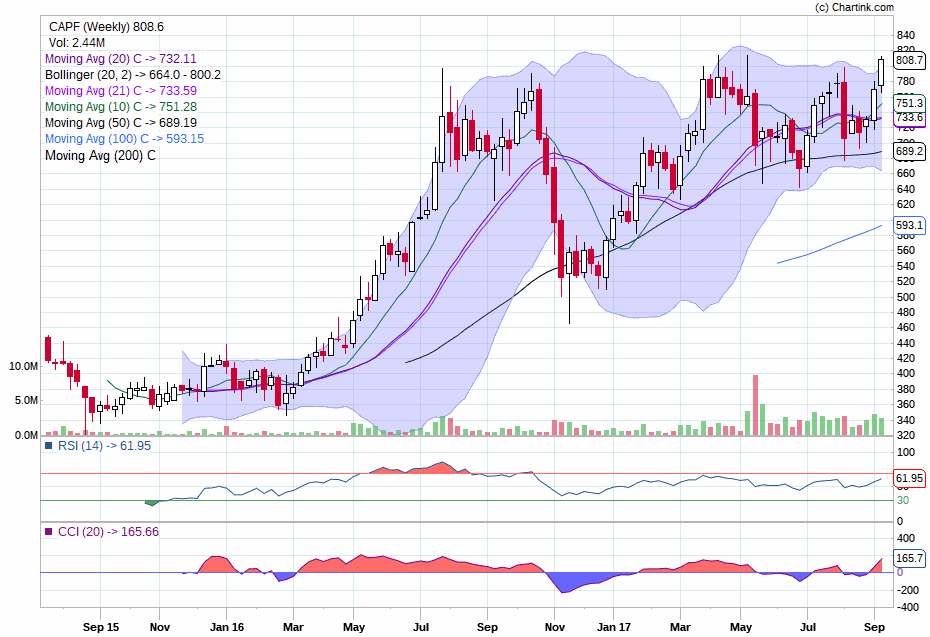
right.this is the kind of price volume and momentum action that breaks strong resistances. Weekly RSI trendline also breached. Its now a strong stock.
1 Like
Hello experts, here are my observations on Canfin’s tech chart.
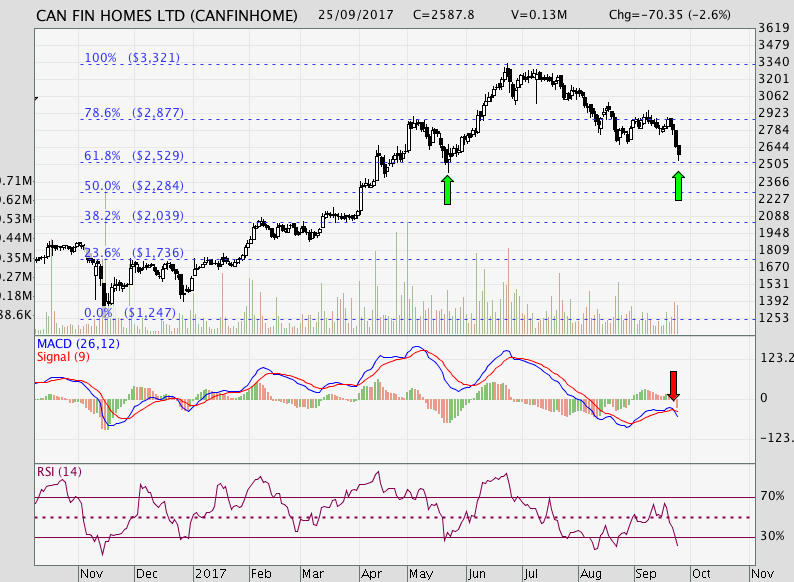
I have taken Nov-2017 low for Fibonacci retracements. Today it bounced from levels of 38% retracement from highs made couple of months back. And same level forms a support line as well.
Though MACD doesnt look in favour however RSI seems to have gone to oversold zone.
With split date announced ( 13th Oct) and fundamentally strong stock, I feel it has good chances of bounce back from current level.
Please provide your expert analysis incase I am mis interpreting something.
Disc : Invested in Canfin. At a beginner level in Tech Analysis.
I am no expert and you should check with others on the forum but i can see a distinct head and shoulders formation
@bheeshma , Thanks sir for prompt response, I been following your tech analysis updates and learnt several things.
I too noticed this head and shoulder however since neck line was not very clear hence was not sure about it.
Is HDFC bank topping out? Will it pull down Nifty into a long correction?..as of now that how it looks…

2 Likes
Can fin is making successive lower highs and lower lows looks bad. Disco no interest
Nice Cup and Handle for Poly Medicure on long term charts.
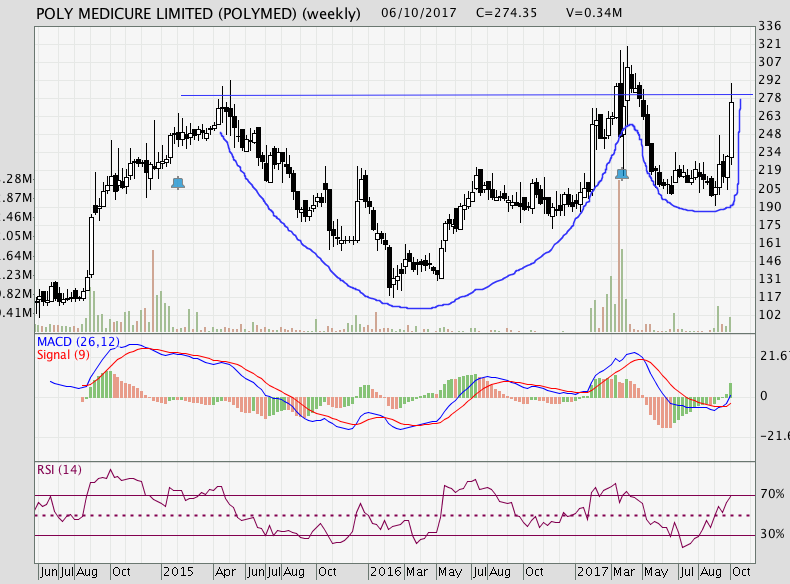
Took a small position few days back and waiting for breakout above resistance to increase position for targets upto Resistance level + the depth of cup.
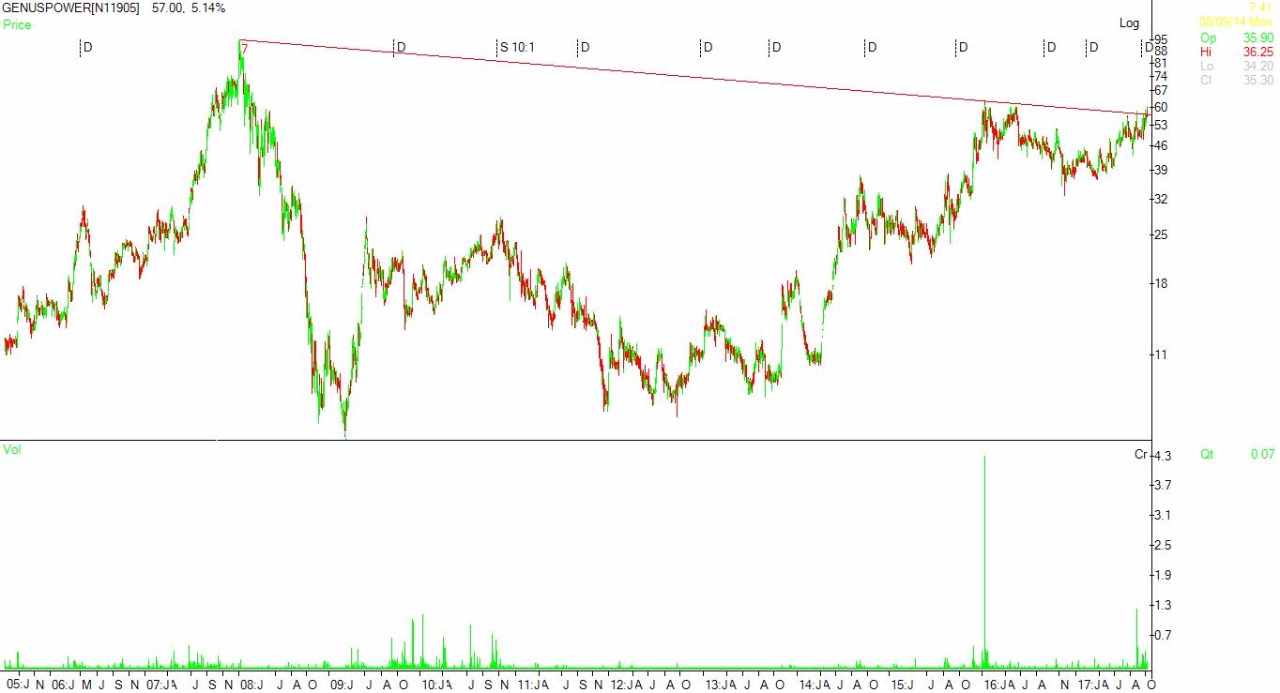
Finally a breakout in Genus power…and that too a 9 year breakout. Hoping that the stock now moves towards 90+ range.
2 Likes
Hi Mehnaz,
wanted your expert view on PTC financial services chart.
Regards
Rishi
Disc- Invested
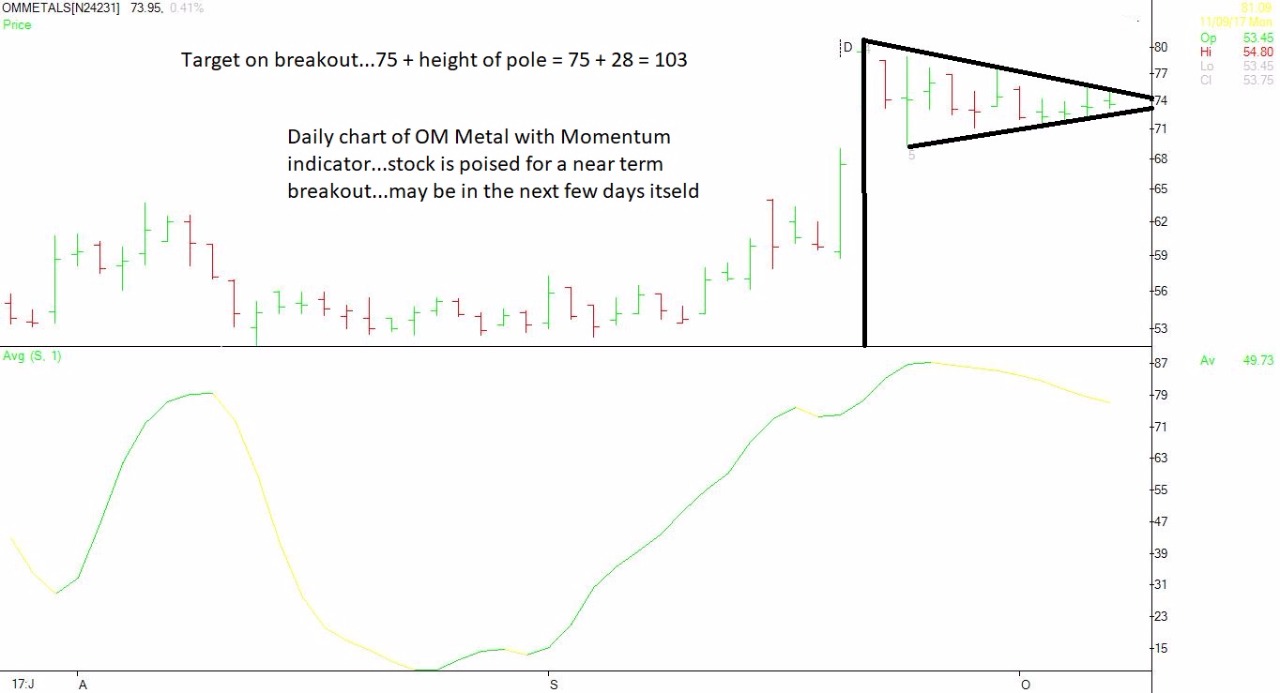
Seems a breakout season ongoing currently (seen in many stocks; time to be cautious?)… Some charts to chew… Thought it might be an interesting comparison for chart enthusiasts to take forward… I don’t understand TA fine prints yet - learning… Not a buy/sell recommendation…
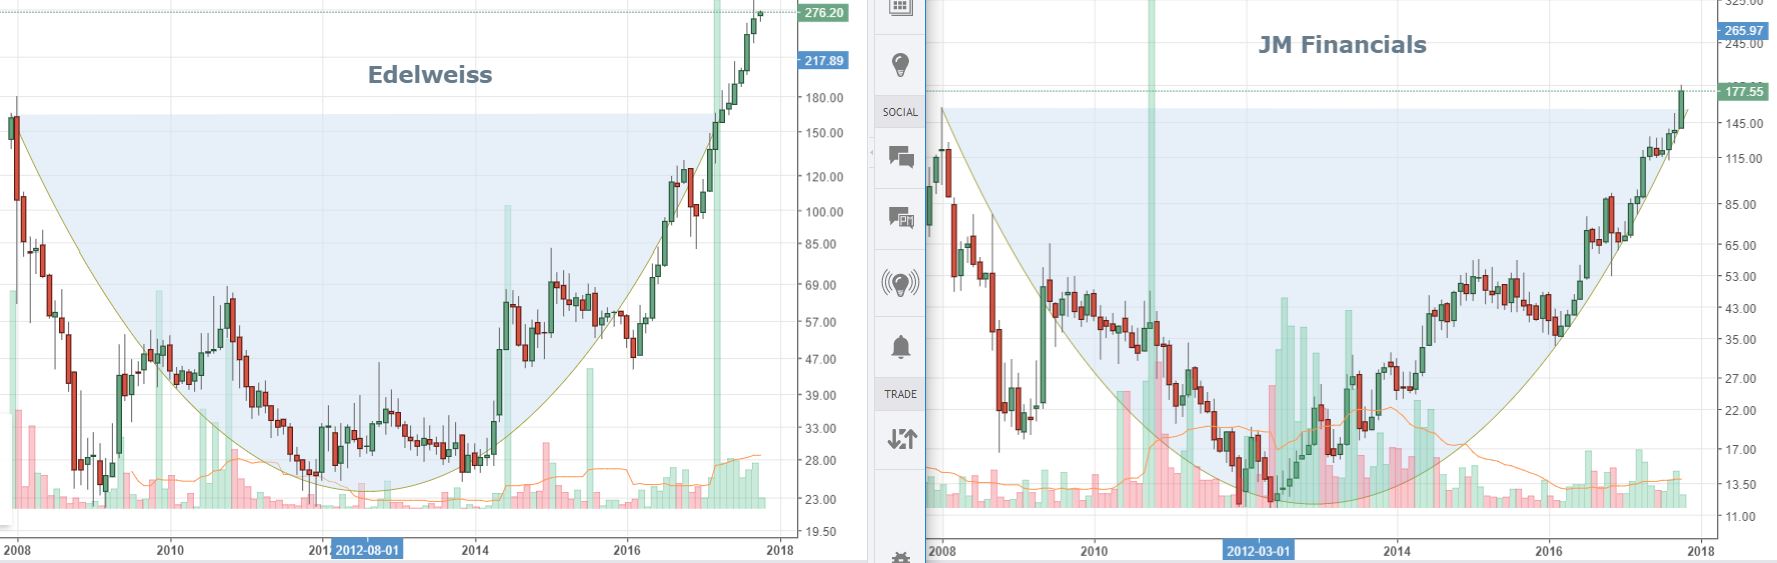
Disc: Invested in both. No buy transaction in last 30 days.
1 Like
Which TA software/tool you use?
Interactive Chart @ https://in.tradingview.com
2 Likes
I am posting the quarterly charts of major IT companies…which present very clear evidence that largecap IT sector is getting rerated by the market. All the major stocks are showing turnaround signs at the same time…which is a very significant development. These stocks have been in consolidation mode for a looong time and have turned quite bullish…all at the same time…these stocks can be the star performers of 2018…Just have a look at the charts…

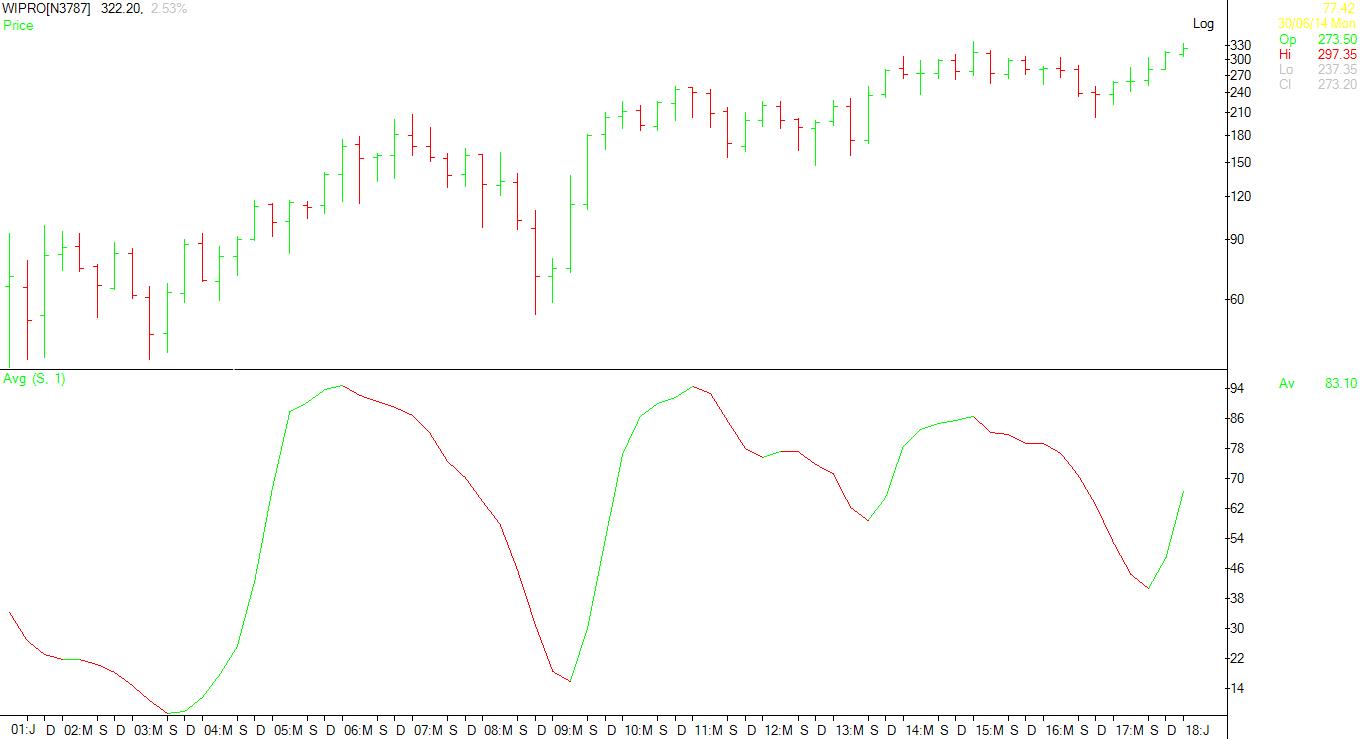
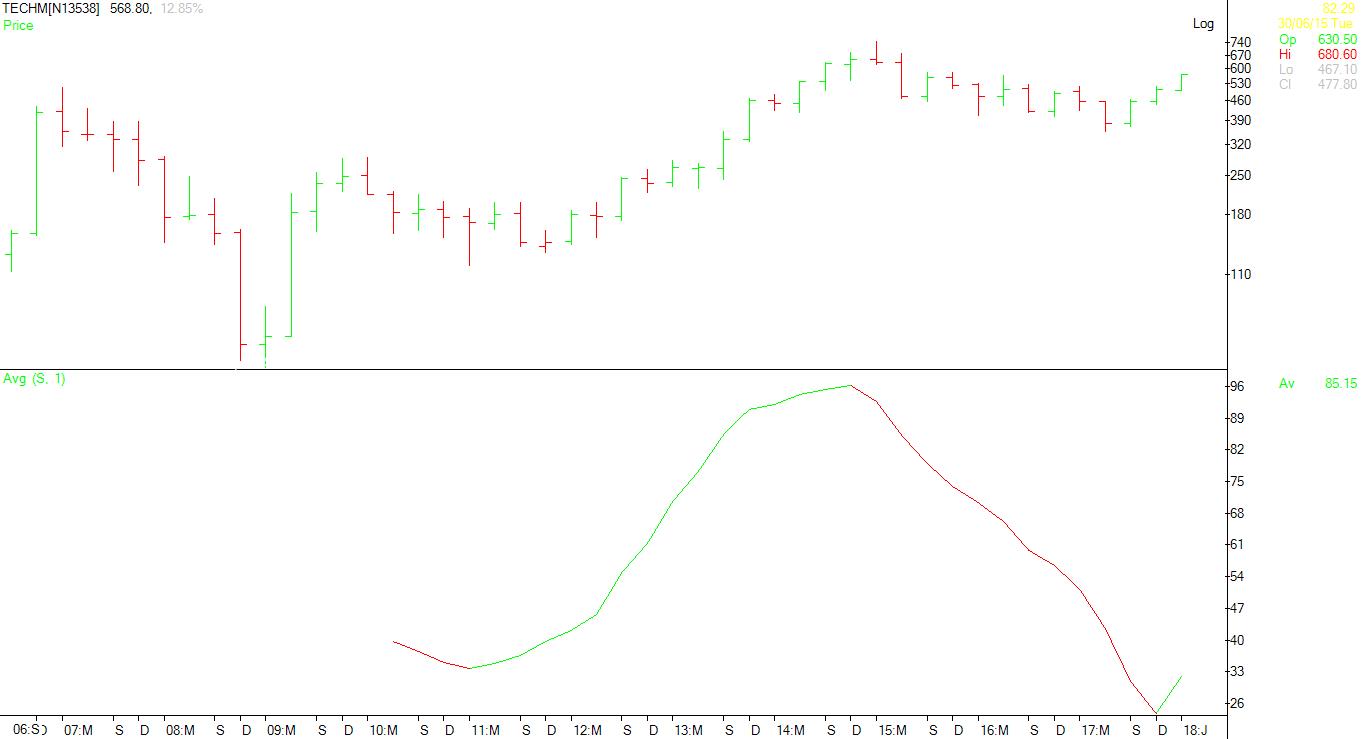
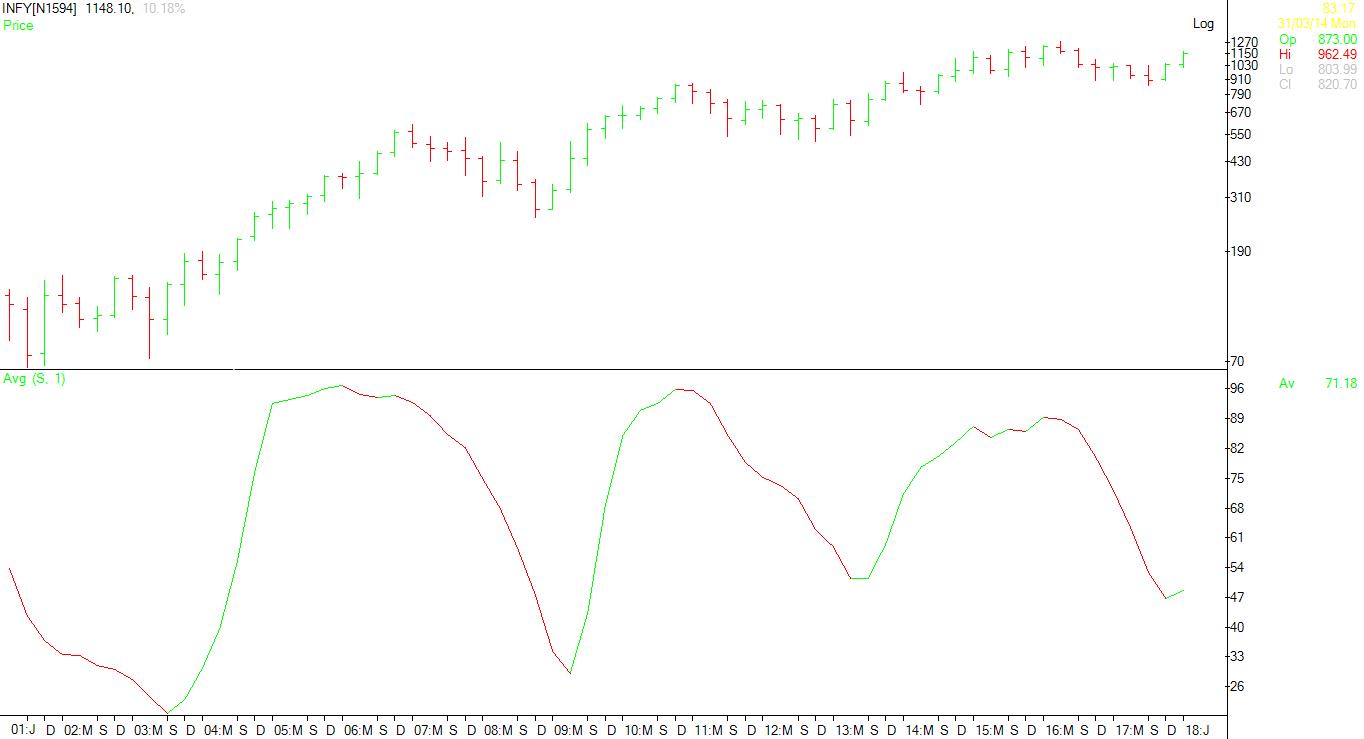

8 Likes