Since most people on this site are looking for good value buys, I thought I will throw my hat in the ring of how one can find some candidates making a bottom using technical analysis.
Over the last several decades that I have been practicing TA, I have created my own method of mapping a bottom. There is no right or wrong way. This is just my way. It works for me, so i am presenting it for serious members here. It is a longish post so exercise some patience as you read.
The bottoming process on a chart has to go thru the following steps. This entire process takes anything from 5-10 years. Use Weekly candle charts, with Vol, Rsi and Adx indicators added.
Stock will be into a long decline- a few years.
After hitting a bottom, the stock then begins a phase consolidation i.e. sideways movement- lasting another year or two.
It may make a new low during this phase but the Divergence patterns on the momentum indicators (use RSI or Ultimate Osc- those show the divergence pattern the best) will begin to appear.
Then we will get a sharp ‘bear market rally’. The prices will rise (most of the time as a nice 3-wave advance, on good volumes. This is created by early value hunters and perhaps some localised news.
Such a rally will be fooler and is subsequently retraced fully, with prices falling even to new lows.
A tell-tale sign that the rally will not last is given by the DI lines which will not maintain the bullish dominance (+DI remaining above -DI) and quickly surrender it.
The new low (or perhaps a double bottom) will be made on high volumes (sometimes climax volumes may also be seen).
Candle patterns of reversal begin to appear at such stage as the seeds of the new bull market are sown here.
Another rally will now occur, not as large as the previous one (point 4) but this will start wearing better momentum characteristics.
Prices will decline yet again, but will now start making higher bottoms (seldom more than two). During such pullbacks- part of the new rise- the RSI will show the classic Range Shift signal. This is one of the keys.
During the fall the ADX line will mostly record a new low as well. But the DI lines will NOT cede control or will regain it very quickly. This is another key element of the turn.
A new rally will emerge after the higher bottom retest and the range shift and this will be on higher volumes and the RSI will hit new highs.
By now bullish patterns will start showing up on the charts ( traditional H&S or Rounding or some such OR candle patterns on Monthly or Quarterly charts).
News flow will start turning much better and certain positive events will begin to occur.
This is the beginning of the rebuilding phase. In 7 of 10 cases, the stock never looks back.
As an example, check out Rel Capital, IB Real, Suzlon etc with the above pointers.
Thanks for reading. Happy bottom fishing!
Good to see that you are in here. I too had the same feeling. Flat growth in that quarter should be considered a great result. Even the bottom line was up big. I bought it treating it as an Fixed deposit.
If you compare to other consumer brands, it looks reasonably ok. And the peer TTK is at 67 PE. One thing I noticed is that TTK never gets punished despite the bad results. This has been happening for several years now.
A very comprehensive discussion on bottom formation process…combines different indicators too…like RSI range shifts…ADX…etc.
I am glad that I too use many of the above steps in bottom formation stocks…and I am particularly glad about the fact that you have pointed out Suzlon as a bottom formation candidate. I am hugely invested in Suzlon…(as already disclosed earlier)
In December 2016…quarterly, monthly and weekly RSI…all found support around 40…that sort of convinced me that Suzlon is entering a bull market…or atleast coming out of a bear market…
Since we are looking at long term lows stocks with this approach, it is obvious that the gains also will acrrue ovre a longer time frame. This means that the moves will go in stages. The first stage will be a move that is usually a 2x multiple of the size of the range near the bottom. That will set up the first impulse higher. Subsequent measures should be multiples of the first impulse. You can start with a 1.618 multiple of that first move. Alongside, you can also do retracement measures from the previous swing highs created during the decline. Those will set up additional targets that you can combine with the projection targets you use with the multiples of the first rise.
The move evolves thru time so you may have to keep recalculating every few months, after every big reaction.
Hope this helps.
I received the pic from whatsapp and have mentioned the website in the references. But if its you who prepared this then definately deserves credit for the same
Lets collaborate further to find such opportunities in the market. BTW your find is at all time high today…you must be proud to have found this at correct time
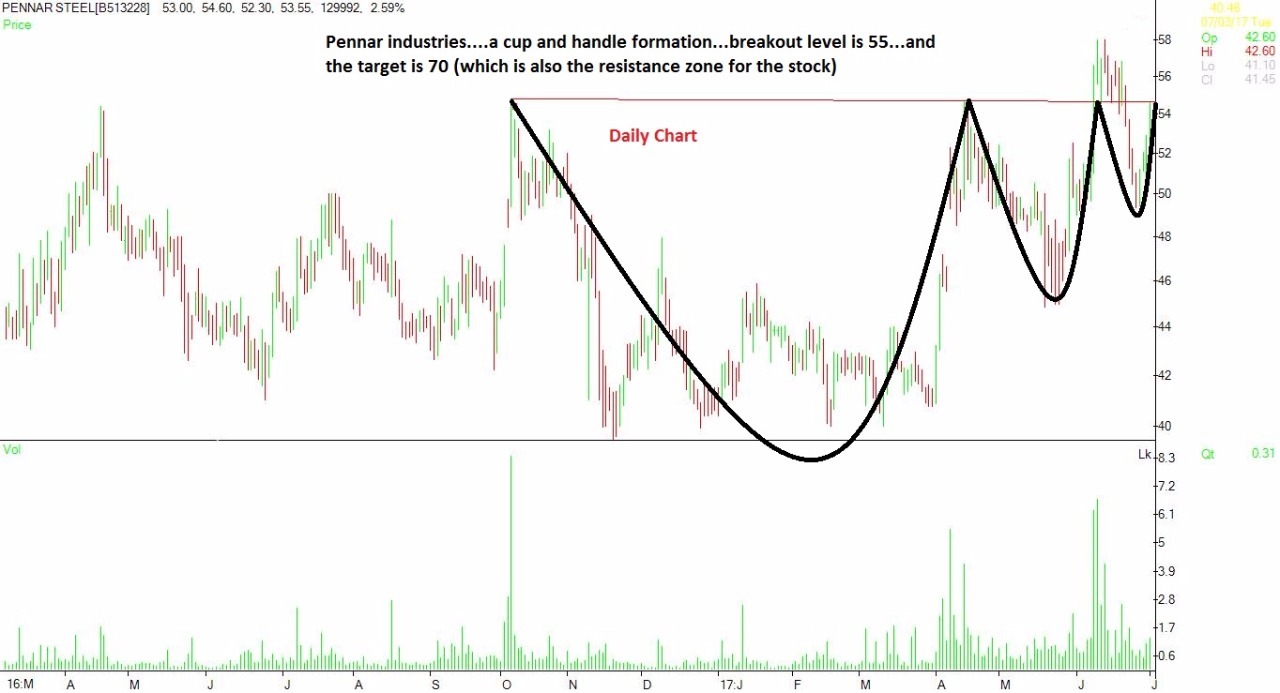
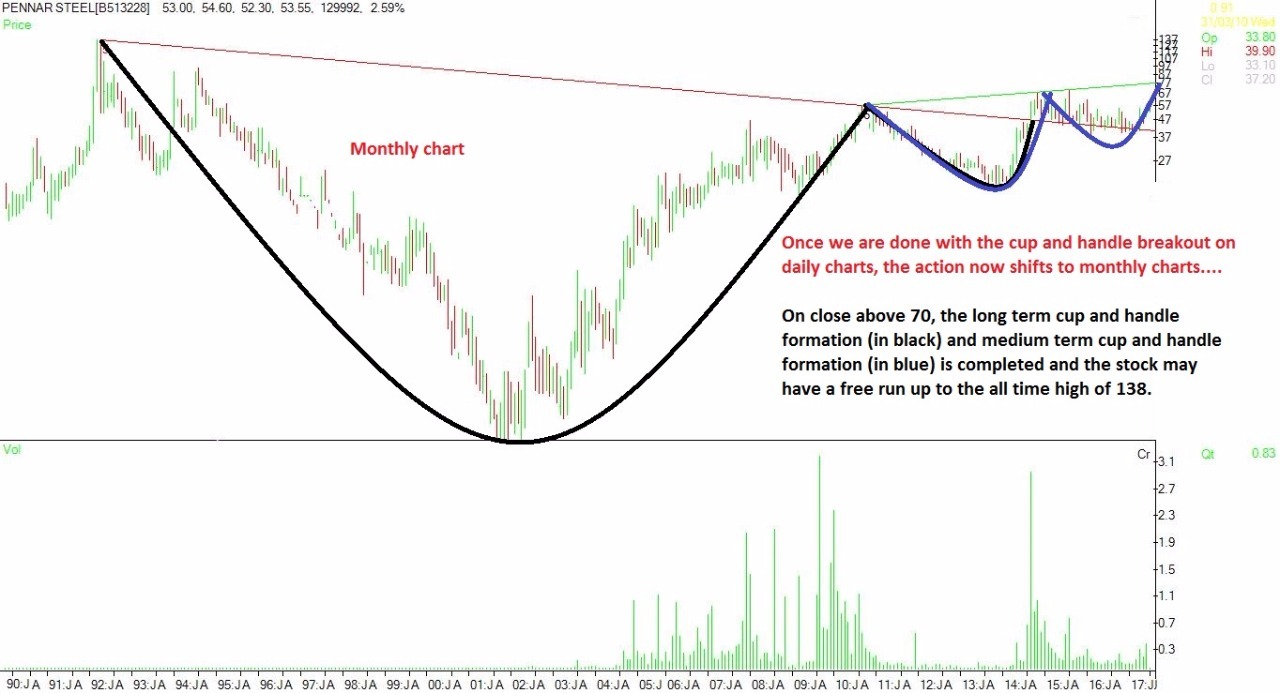
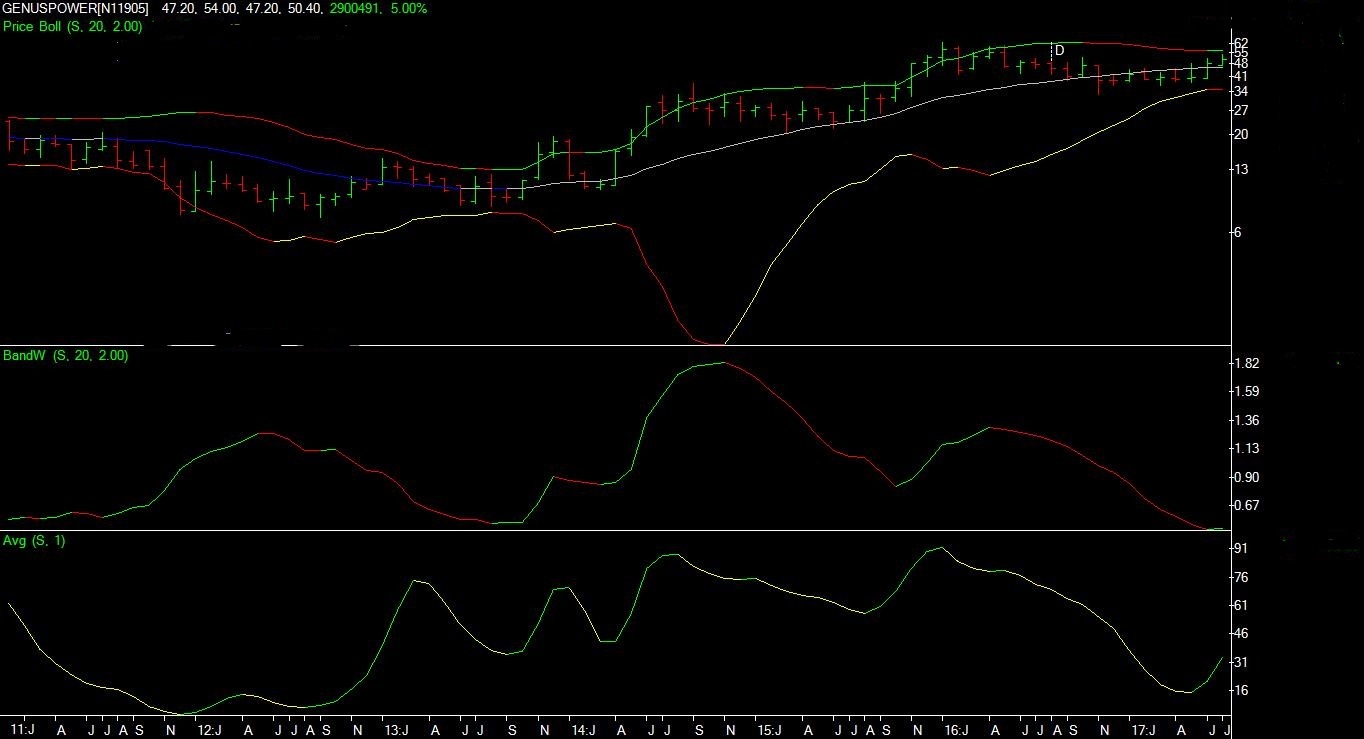
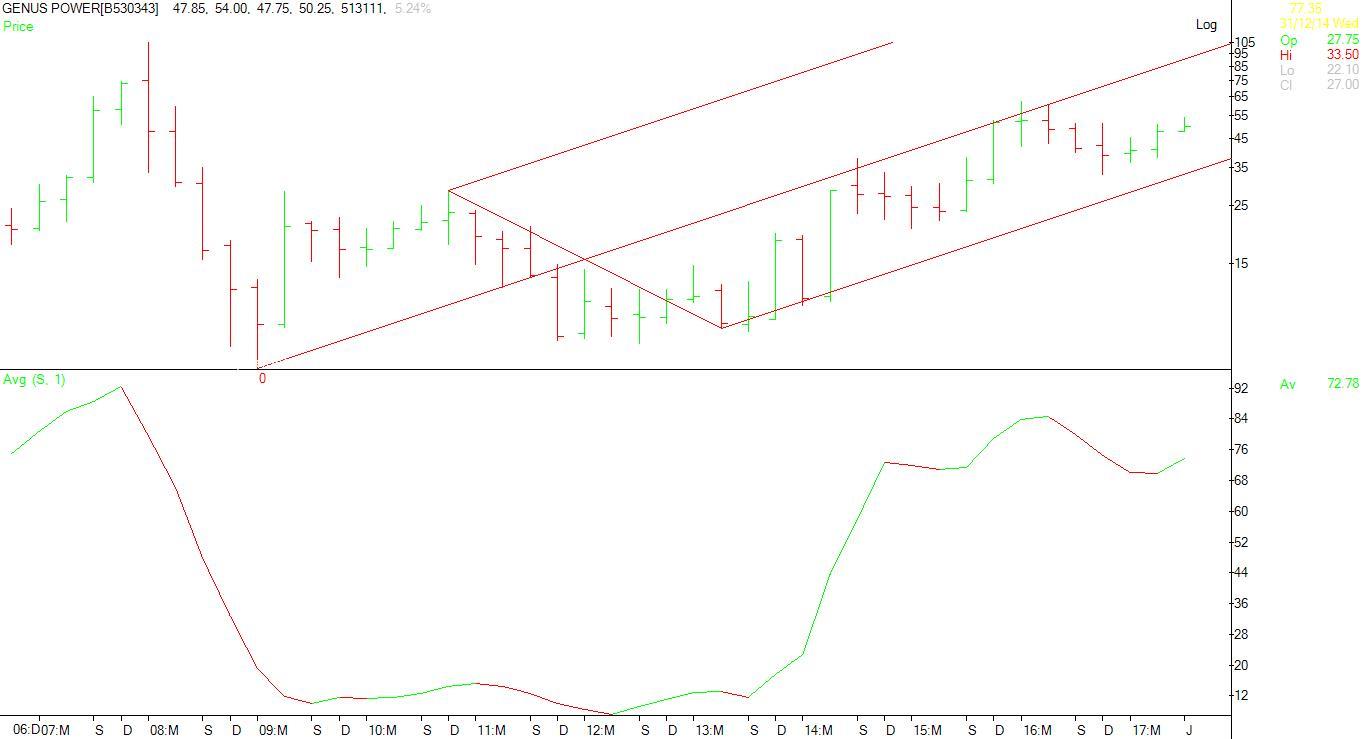
Genus power…having a good name in manufacturing of electricity meters…and held by quite a few big names from the investing world…the monthly charts when analysed with Bollinger bands and momentum indicator, shows that the stock may be about to embark on a long uptrend…the Bollinger bands are in expansion mode…the momentum indicator is up…
The uptrend looks even better when viewed through quarterly charts …it even indicates to us the possibility of the stock going up to around 85 to 90 in the next few quarters
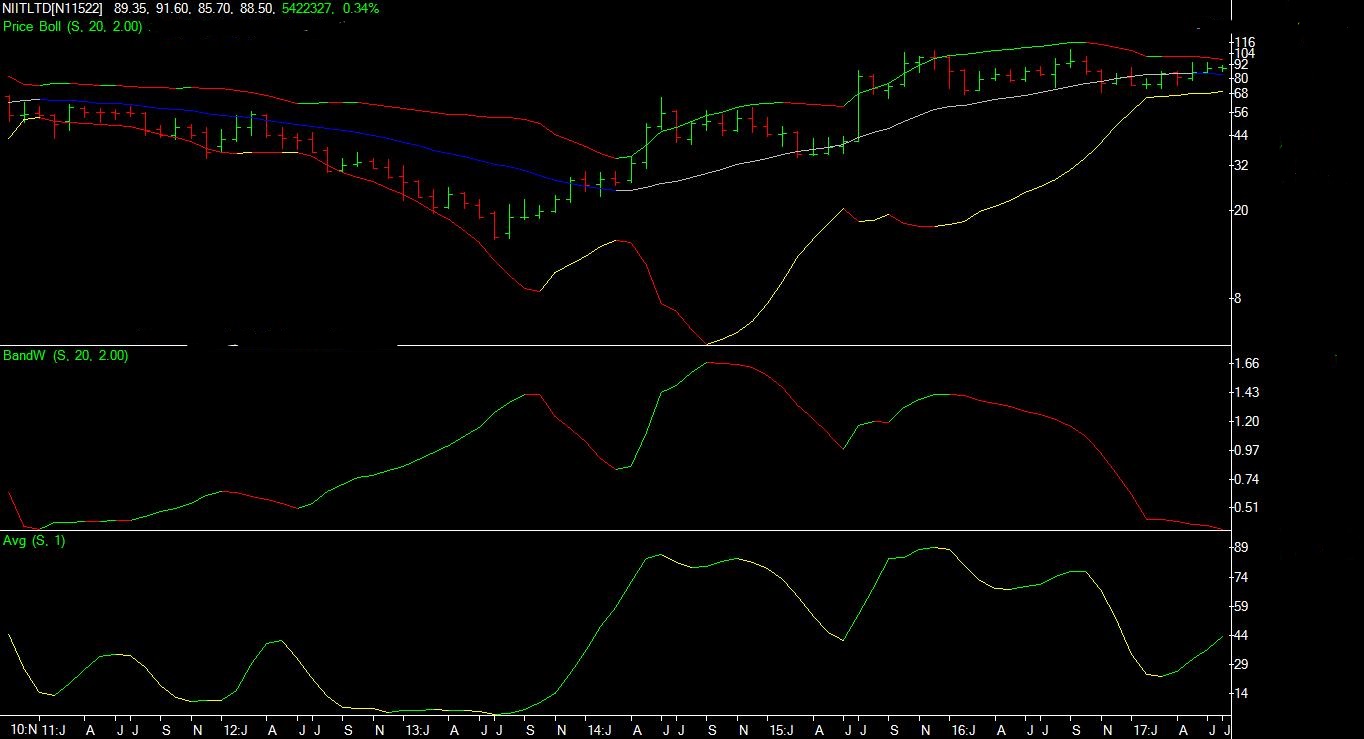
Another fundamentally good stock in which I have started building up position is NIIT ltd…with huge demand for reskilling of software professionals, NIIT may do well in the future…even the last quarterly results were good…and if we apply the Bollinger bands to monthly charts, then it appears that the stock may start trending up in the next few months…as of now, the stock is under band contraction…but the momentum indicator has already turned up, thus the probability of stock going in an uptrend is quite good…
But since we are dealing with monthly charts, it may take a few months for the positive price action to play out…thus as of now, this stock is only for proponents of slow investing only…