
In the forward PE calculation, it seems that you have assumed same price of 5835? correct me if i am wrong. Is that based on your experience with other stocks ? Do you mean this price will stay there even if there is a consistent growth till PE comes to down to certain level?
The forward P/E ratio is calculated using the formula:
Forward P E=Current Share Price/Projected EPS
I have only Projected the EPS. Mr. market will give price according to market sentiments. I think valuations are within 2-year forwards. When valuations exceed 2-year forwards and start approaching 3-year forwards, I will find myself uncomfortable and perhaps sell. A lower forward P/E ratio may indicate a stock is undervalued relative to its future earnings potential. For Trent Forward P/E are Year 1: 103.93,Year 2: 73.66,Year 3: 52.63,Year 4: 37.56,Year 5: 26.87. It is overvalued at 1 year Forward PE of approx. 104. but I think it OK at 2 Year forward PE of approx. 74. I need to track Quarter to Quarter results and EPS, If they are better than projected then I am OK, but if I see a decline in EPS the will take a call accordingly.
4 Likes
Thanks you for explaination. So do you mean that the if the price reaches to a value where that value/eps at that time > 73 ( say in a month or so from now) , then you will think of selling the same? Sorry again for asking basic
Hi Prashant,
It will depend on, the industry PE at that time.
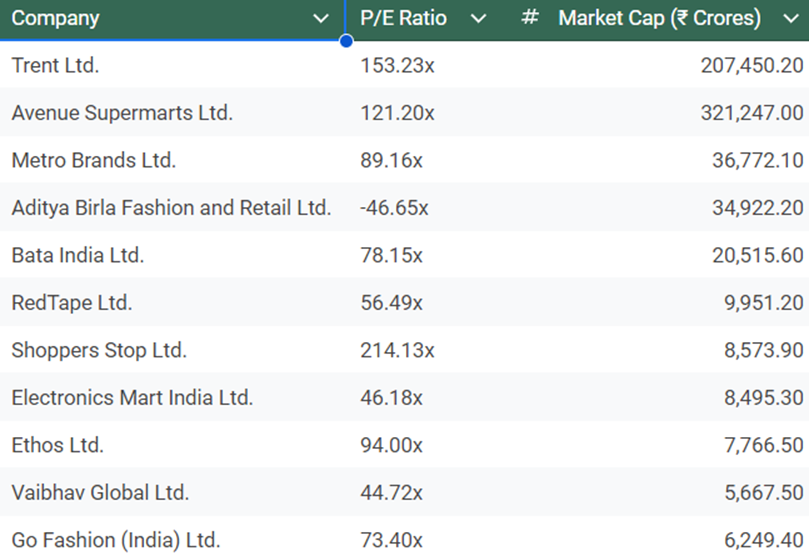
How does Trent Ltd’s forward PE compare to its industry peers currently
Here’s an analysis of Trent Ltd.'s forward P/E ratio compared to its industry peers in the retail sector:
1 Like
Hi Prashant,
I am also looking at profitability. To analyze Trent Ltd.'s profitability compared to its industry peers in the retail sector, we can look at several key financial metrics, including Return on Equity (ROE), Return on Assets (ROA), and Operating Margin. These metrics provide insights into how effectively a company is generating profits relative to its equity, assets, and sales.
Key Profitability Metrics
1. Return on Equity (ROE)
- Trent Ltd.: Approximately 36.55%
- Industry Peers:
- Avenue Supermarts: Approximately 17.50%
- Metro Brands: Approximately 24.00%
- Aditya Birla Fashion and Retail: Approximately -1.00% (loss)
- Bata India: Approximately 15.00%
- Shoppers Stop: Approximately 7.00%
Analysis: Trent Ltd. has a significantly higher ROE compared to its peers, indicating that it is more effective at generating profit from its equity. A ROE above 30% is generally considered excellent, suggesting strong management efficiency and profitability.
2. Return on Assets (ROA)
- Trent Ltd.: Approximately 9.00%
- Industry Peers:
- Avenue Supermarts: Approximately 8.00%
- Metro Brands: Approximately 10.00%
- Aditya Birla Fashion and Retail: Approximately -0.50% (loss)
- Bata India: Approximately 6.00%
- Shoppers Stop: Approximately 3.50%
Analysis: Trent Ltd.'s ROA of 9.00% is competitive within the industry, indicating effective use of assets to generate earnings. It is slightly lower than Metro Brands but higher than most other peers, suggesting solid operational efficiency.
3. Operating Margin
- Trent Ltd.: Approximately 10.50%
- Industry Peers:
- Avenue Supermarts: Approximately 12.50%
- Metro Brands: Approximately 14.00%
- Aditya Birla Fashion and Retail: Approximately 5.00%
- Bata India: Approximately 10.00%
- Shoppers Stop: Approximately 8.00%
Analysis: Trent Ltd.'s operating margin of 10.50% is solid but lower than Avenue Supermarts and Metro Brands. This indicates that while Trent is profitable, there may be room for improvement in managing operating expenses relative to its sales.
Conclusion
Trent Ltd. demonstrates strong profitability metrics compared to its industry peers, particularly in terms of Return on Equity (ROE), where it significantly outperforms most competitors. Its Return on Assets (ROA) is also competitive, indicating effective asset utilization. While its Operating Margin is solid, it is lower than some of its peers, suggesting potential areas for operational improvement. Overall, Trent Ltd. appears to be a strong player in the retail sector, with effective management and profitability relative to its peers. Investors may view these metrics favorably when considering Trent Ltd. as a potential investment.
What is the gross margin percentage for Trent Ltd compared to its competitors
To analyze the gross margin percentage for Trent Ltd. compared to its competitors in the retail sector, we can look at the following data:
Gross Margin Percentage
- Trent Ltd.
- Gross Margin: Approximately 35.00%
- Competitors in the Retail Sector:
- Avenue Supermarts: Approximately 25.00%
- Metro Brands: Approximately 50.00%
- Aditya Birla Fashion and Retail: Approximately 30.00%
- Bata India: Approximately 55.00%
- Shoppers Stop: Approximately 27.00%
Comparison of Gross Margins
| Company | Gross Margin Percentage |
|---|---|
| Trent Ltd. | 35.00% |
| Avenue Supermarts | 25.00% |
| Metro Brands | 50.00% |
| Aditya Birla Fashion and Retail | 30.00% |
| Bata India | 55.00% |
| Shoppers Stop | 27.00% |
Analysis
- Trent Ltd. has a gross margin of 35.00%, which is competitive within the retail sector.
- It outperforms Avenue Supermarts and Shoppers Stop, indicating better efficiency in managing the cost of goods sold relative to sales.
- However, it is lower than Metro Brands and Bata India, which have significantly higher gross margins of 50.00% and 55.00%, respectively. This suggests that these companies may have a more favorable cost structure or pricing power in their respective markets.
Conclusion
Trent Ltd. maintains a solid gross margin percentage compared to its competitors, reflecting effective cost management and operational efficiency. While it is competitive, there is room for improvement to reach the higher gross margins seen in companies like Metro Brands and Bata India. Investors may consider these margins when evaluating Trent Ltd.'s profitability and operational performance in the retail sector.
Request for comments from more knowledgeable members on above analysis and Trent valuations.
Disclosure-Names mentioned above are only for analysis purpose and are not buy and sales recommendations. I am invested in Trent and my views are biased
Rewrite
Share
Rewrite
5 Likes
Is the above generated using AI?
It definitely appears to be generated using AI. He didn’t even care to strip out the
Rewrite
Share
Rewrite
at the end of the message after copy-pasting it. How lazy! ![]()
We have to live in a world now where most of the content people will be sharing is machine generated gibberish.
3 Likes
Hi Vishal, Yes I used Perplexity and then checked the numbers. I already narrated that my knowledge is limited and I am trying to use the available modern tools. If you find flaws in the content, kindly enlighten me. I am trying to learn from this platform and by using available modern tools. What I found that it picked numbers from Tijori and numbers are correct.
6 Likes
Don’t use such language. CnP is contribution too. We have members from all over the country, from different walks of life, from different age groups, speaking different languages, contributing in their own way, myself included. He says he has been an investor for 20 years. Experienced investors bring their own insights into the discussion, which benefit fellow investors, as not everything is data.
And VP has a disconnect with AI-world. There are members who share original research, which I am guessing, you too must have experienced.
3 Likes
I understand that my tone was too rude and I apologize for that. I appreciate the insights from an experienced veteran like @Devsuman and I thank him for sharing it (for which I am here anyway like everyone else). My genuine concern was regarding copy-pasting a huge AI-made content which I guess would be easy to generate using available tools nowadays by anyone (say using ChatGPT, Anthropic’s claude.ai, Mistral, Meta AI, etc.). So maybe I was expecting the actual learning (or insight, or TL;DR) off of it. Or at least, citing that the content was generated using AI would have made more sense. But that’s my take but I welcome disagreement over that. (BTW, I also use AI for understanding various difficult topics and do some grunt work like content-proofing, wordsmithing, etc., so I am not against using it or sharing things learned using AI).
3 Likes
Members contribute in their own ways, we should be glad that someone is taking their time and making the effort to post something, making us save time and effort (if we are interested). If you are well versed, you know where to look, what to take, and what to skip, machine-generated or otherwise. For an inexperienced user like me, it will take a few iterations to get the gist.
And, when people get older, the one thing that bothers the most is the limited availability of time, so, the correction of grammatical mistakes, typos, or citations, even if cross mind, may not happen.
3 Likes
Dear Vishal, There is no need to apologize, I understand from where you are coming. I must know my blind spots and thanks for pointing out. It was my mistake and I will refrain from cluttering the space in future. My laziness in data crunching developed during my professional life, I was supported & pampered by a brilliant team of analysts and a secretory. Thankfully now I am without those crutches and trying to learn modern tools to walk on my own. I was exposed to a laptop at the age of 35 and used it mostly for official communication and presenting dashboards prepared by others, I do realize about my IT illiteracy & recently started learning such tools. I can understand the irritation I caused to young tech savvy audience by copy pasting huge content. My sincere apologies to all. Please keep correcting me, its important for my learning.
I am looking forward for Trent’s 1st Quarter result and will try to share my interpretation in my own language this time, and would request comments from esteemed members for my better understanding. Thanks @Chaitanya for you comments and generosity, I am amazed by the posts/threads in VP. My Sincere thanks to forum for excellent shared learning and support.
9 Likes
@Devsuman Thanks for not taking it personally and understanding my rationale. I will look forward to your Trent’s Q1FY25 analysis! Please keep it up. ![]()
1 Like

1 Like
Investors Presentation Q1 FY 2024 TRENT.pdf (2.3 MB)
ITS Q1 FY 25. AMAZING NOS FROM TRENT QTR AFTER QTR
Trent Limited’s Q1 FY25 financials are on fire! - Revenue up 18% to ₹4,104 Cr
-
Net Profit skyrocketed by 126% to ₹393 Cr! 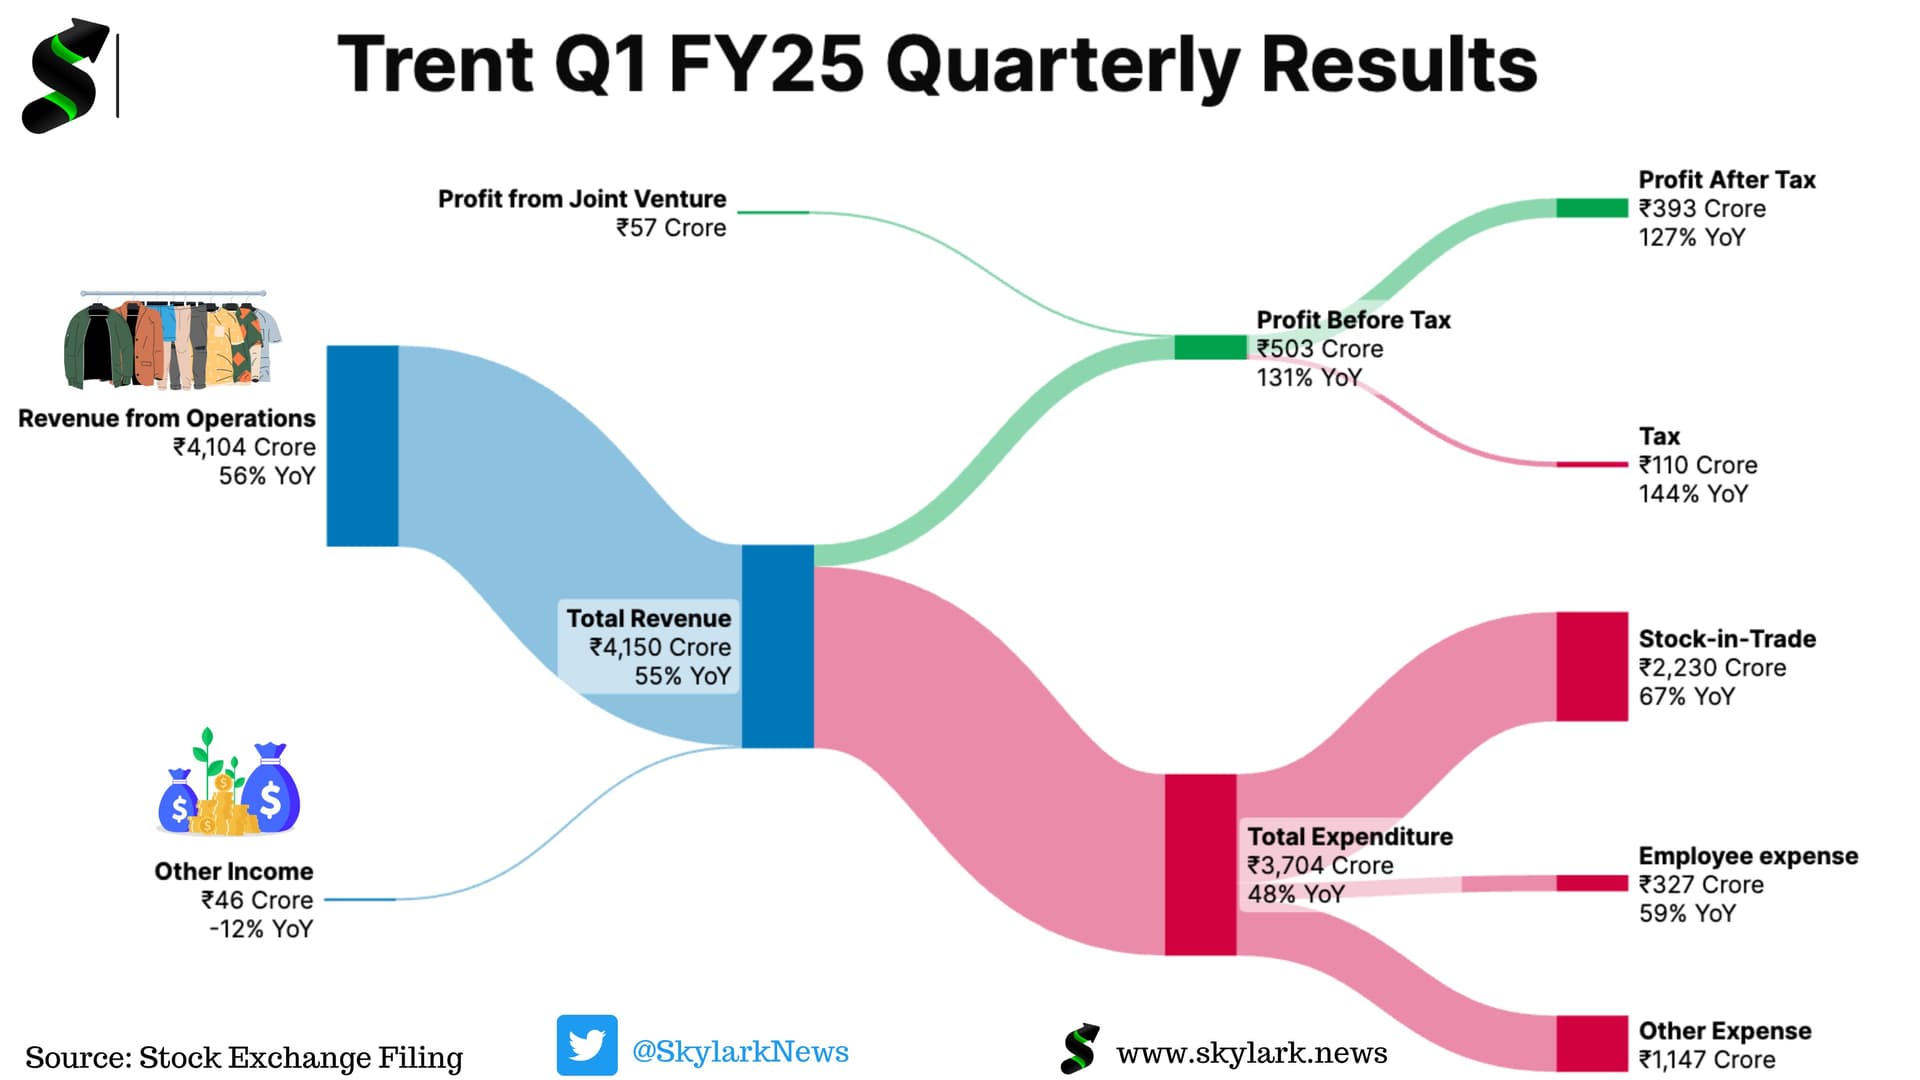
DISCL INVESTED SINCE LONG
2 Likes
What a performance. Good growth across formats.
Getting seriously difficult to sell this one.
Want your view on Trent as well. I see that is also one of the recent additions, not worried about the valuations at all?
In Trent’s case, you have to keep in mind three things on the valuation. When the market says it trades at 110 times PE, I am always circumspect on PE. There are three reasons why PE in this case is relatively useless. Firstly, remember the Ind AS rules mean that every time you take stores on lease, you have to hit your accounting earnings, your declared e …
Read more at:
Mukherjea pointed out that both brands (Jockey and Zudio) use cotton, raising the question of how Zudio manages to offer such a competitive price. His answer is that Zudio is making lower margins but achieving higher Return on Capital (ROC) by turning over inventory almost six times faster than other retail players. This, however, is only part two of the story. Part one of the story, which is the question of what is facilitating this, involves macro-level changes that include increasing road connectivity, digitisation, and cheaper data costs.
Mukherjea said that Zudio’s ability to quickly track and move inventory across warehouses and stores is key to their efficiency. This process has become faster because of a strong road network, which has tripled in the last 20 years, and cheaper data costs in India. Marcellus ’ Consistent Compunders Portfolio has a 9.2 percent stake in Trent, which houses the Zudio chain of stores.
Mukherjea further said that Zudio opens approximately 200 stores annually. "Logically, one might expect overall sales per square foot to decline as new stores take time to mature. However, a new Zudio store tends to take over around x percentage of sales from local players when it starts,” he said. He also said that his firm’s channel checks revealed that in markets where Zudio opened stores, local companies ended up losing significant market share.
According to the Marcellus study, challengers, which constitute 5,000 companies with net profits ranging from $6-60 million, compounded PAT at 16 percent per annum compared to the ‘rulers.’ Rulers constitute the Top 800 companies with PAT more than $60 million. These companies showed 15 percent annualised growth per annum. The faster growth of challengers came at the cost of small companies in the unorganized segment, constituting 95 percent of India’s companies by count that contribute only to 15 percent of total profits – a segment Marcellus calls ‘plebeians.’ These companies saw profit grow at 5 percent CAGR over the 10-year period from FY12-FY22.
2 Likes
Results of Q1 FY25 has further strengthen the confidence that Trent is clearly emerging as market leader in organized fashion retail. By conservative estimates Trent is expected to end the year between 18k crores to 20k crores revenues. I have compared the Sales of Top 10 listed fashion retailers( i could not get fashion retail data of Reliance)
| Company | FY 24 Sales | Growth | Q1 FY 25 | Growth | |
|---|---|---|---|---|---|
| 1 | Aditya Birla Fashion & Retail Ltd | 13996 | 12.71% | 3428 | 7.25% |
| 2 | Trent | 12375 | 50.00% | 4104 | 56.00% |
| 3 | Avenue Supermarts Ltd(Apparel & G.Merch,) | 11174 | 18.56% | 3095 | 18.57% |
| 4 | Shopper stop | 4317 | 7.32% | 1069 | 7.62% |
| 5 | V-Mart Retail Ltd | 2786 | 13.01% | 786 | 15.25% |
| 6 | Spencer’s Retail Ltd | 2345 | -4.39% | 548 | -3.83% |
| 7 | Sai Silks (Kalamandir) Ltd | 1843 | 1.63% | 267.29 | -12.25% |
| 8 | Redtape Ltd | 1374 | 25.51% | ||
| 9 | Vedant Fashions Ltd | 1368 | 93.00% | 240 | -23.04% |
| 10 | V2 Retail Ltd | 1165 | 38.84% | 415 | 57.00% |
| Above data is from Screener.in |
4 Likes
Hello experienced players, is it the right time to buy the stocks as everybody is sitting on lot of profit…as per my little knowledge once there is no/less growth this going for long correction ?