[TOOL LAUNCH] Free Chrome Extension — Turn Screener.in Data into Institutional-Grade AI Research Prompts | Zero Data Collection | v2.0.0 (US Stocks + Forensic Analysis) Under Review

Hi the tool has been a huge help. One thing i noticed whenever i use the deep research tool for example and try to generate a report a lot of what the tool does is just reads out the screenr information for example wc days have gone up x , or margins have gone down x% and just gives a very generic SURFACE LEVEL analysis of the same based on the numbers.

While comparing this with the screenr AI tool i realised that the screenr AI has much more in depth answers and deeper level thinking and analysis.

I think this could be mitigated maybe with some better prompt engineering ?? Because right now it feels like sometimes the finmagine tool just captures the data and about side on the screenr page and creates a generic report which is mainly based on that. The ask anything AI tool is a great new addition but again for some reason its not as accurate or deep thinking as the in built screenr tool.

All said and done im very grateful for this new tool its really helpful but was just wondering what can be done to make it better and have deeper level analysis output in the future. Thanks.

1 Like

Thanks for this — the feedback is specific and fair, so let me address it directly.

The “reads out Screener numbers” pattern was a real problem. The templates described what to analyze but not how — so the AI defaulted to narrating the numbers rather than interpreting
them. v2.12.0 (just submitted to CWS, pending review) fixes this in 4 places:

  1. Analytical Depth Standard (Comprehensive Analysis)
    Every metric now requires: benchmark vs sector norms + the company’s own 5-year history + management targets → explain the mechanism (volume/price/cost/mix/one-time) → translate into ₹
    Cr or EPS impact → classify structural vs cyclical. The “WC days up X, margins down X%” narration pattern is explicitly called out as what not to do.

  2. Quantification requirement (Risk-Reward)
    Every risk must estimate earnings impact in ₹ Cr and % EPS. Every catalyst must estimate re-rating potential. The scenario table now specifies bear-case stock prices with specific
    triggers, not just directional labels.

  3. Guidance vs Actuals scoring (Quarterly Deep-Dive)
    AI now reads the previous concall first, extracts every forward-looking statement management made, and scores each item Beat / In-line / Miss — before touching the financial tables.
    Establishes whether management has credibility before the numbers analysis begins.

  4. Question-type detection (Ask Anything)
    Questions are now classified as FACTUAL (answered with cite-only FINDINGS: exact source + quote) or ANALYTICAL (answered with structured synthesis + judgment). The old rigid
    citation-list format was preventing any interpretive response even for questions that clearly required one.

On model choice: the depth difference is significant depending on which AI you use. Claude Project and Gemini Deep Research produce noticeably richer outputs than ChatGPT for most
templates — particularly for peer benchmarking, reverse DCF, and anything that requires reading BSE/NSE PDFs. Each template now shows “✦ Best with [AI]” to guide this.

Happy to share before/after examples on TCS if useful — tested all 4 templates this week.

1 Like

Finmagine AI Advisor v2.11.0 published — new Business KPIs Deep Dive template

Just got the CWS publish confirmation. The main addition in this version is a 15th template focused entirely on operational KPIs — something most AI analysis tools skip entirely because
it requires reading company-specific data that isn’t in standard financial databases.

What it does:

Screener.in has an Operational Insights table for many companies that shows company-specific KPIs — the kind of metrics management uses to run the business but which don’t appear
anywhere in the consolidated P&L. The template automatically reads this table, structures the data into a time-series, and runs a full analytical framework on it:

  • KPI trend analysis: is the metric improving, plateauing, or declining? At what rate?
  • Quality vs quantity scoring: e.g., for Affle — is CPCU falling (good, efficiency) or flat while volume surges (also good, but different story)?
  • Management guidance vs actuals: did they deliver on the specific KPI targets they mentioned in concalls?
  • Cross-KPI red flags: combinations that look fine in isolation but raise flags together (e.g. GOV growing but order frequency flat = ticket size inflation, not engagement deepening)
  • Peer benchmarking on the top 3 KPIs for the sector
  • 5-parameter weighted investment score

Companies where this adds the most value:

Consumer tech / platforms (Affle, Zomato, Naukri, Paytm, Delhivery), retail (DMart, Trent, V-Mart), hospitals (Apollo, Narayana — bed occupancy, ARPOB), and any company where the
headline revenue/EBITDA numbers mask what’s actually happening operationally.

Works on any Screener.in page where Operational Insights are populated. Best with ChatGPT (structured output, follows the template format well).

Free, no account needed: Finmagine AI Advisor - Free Chrome Extension for Institutional-Grade Stock Analysis on Screener.in

1 Like

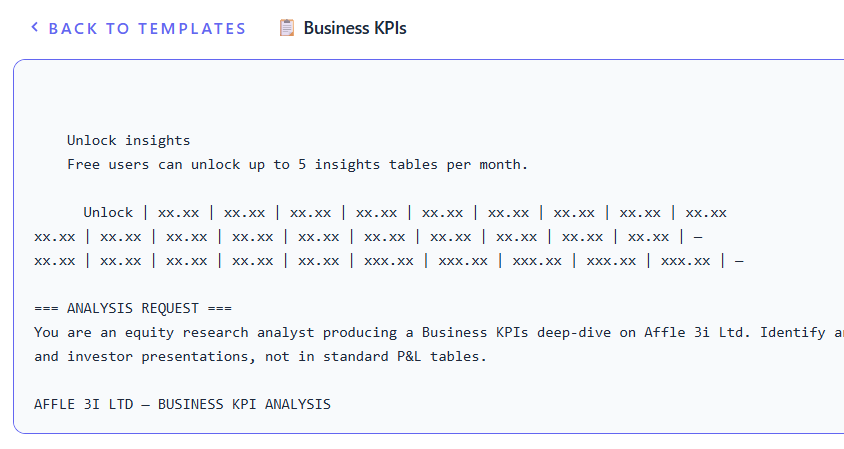
It isn’t populating for the free tier version of the screener, so the prompts remain empty, saying free users can unlock up to 5 insight tables per month, as you can see in the screenshot.

Any solution?

Hi @karanshah137 — thanks for flagging this, good catch.

You’re right. When Screener.in’s Operational Insights section isn’t populated (which happens on free-tier accounts), the Business KPIs template has no table data to work with. The next version will automatically hide that
template when no Operational Insights data is detected on the page — so it won’t appear as an option unless there’s actually data behind it.

In the meantime, the template still works reasonably well even without the Insights table — it instructs the AI to reconstruct KPIs from the concall transcripts and annual reports linked in the Documents section. Results
will be less precise than when the table is present, but still useful for companies with good disclosure.

Finmagine Trader v1.8.0 — BRS, Relative Strength & Stage Classification

Sharing the v1.8.0 release notes with the VP community. Four new features — all methodology-driven, all free.


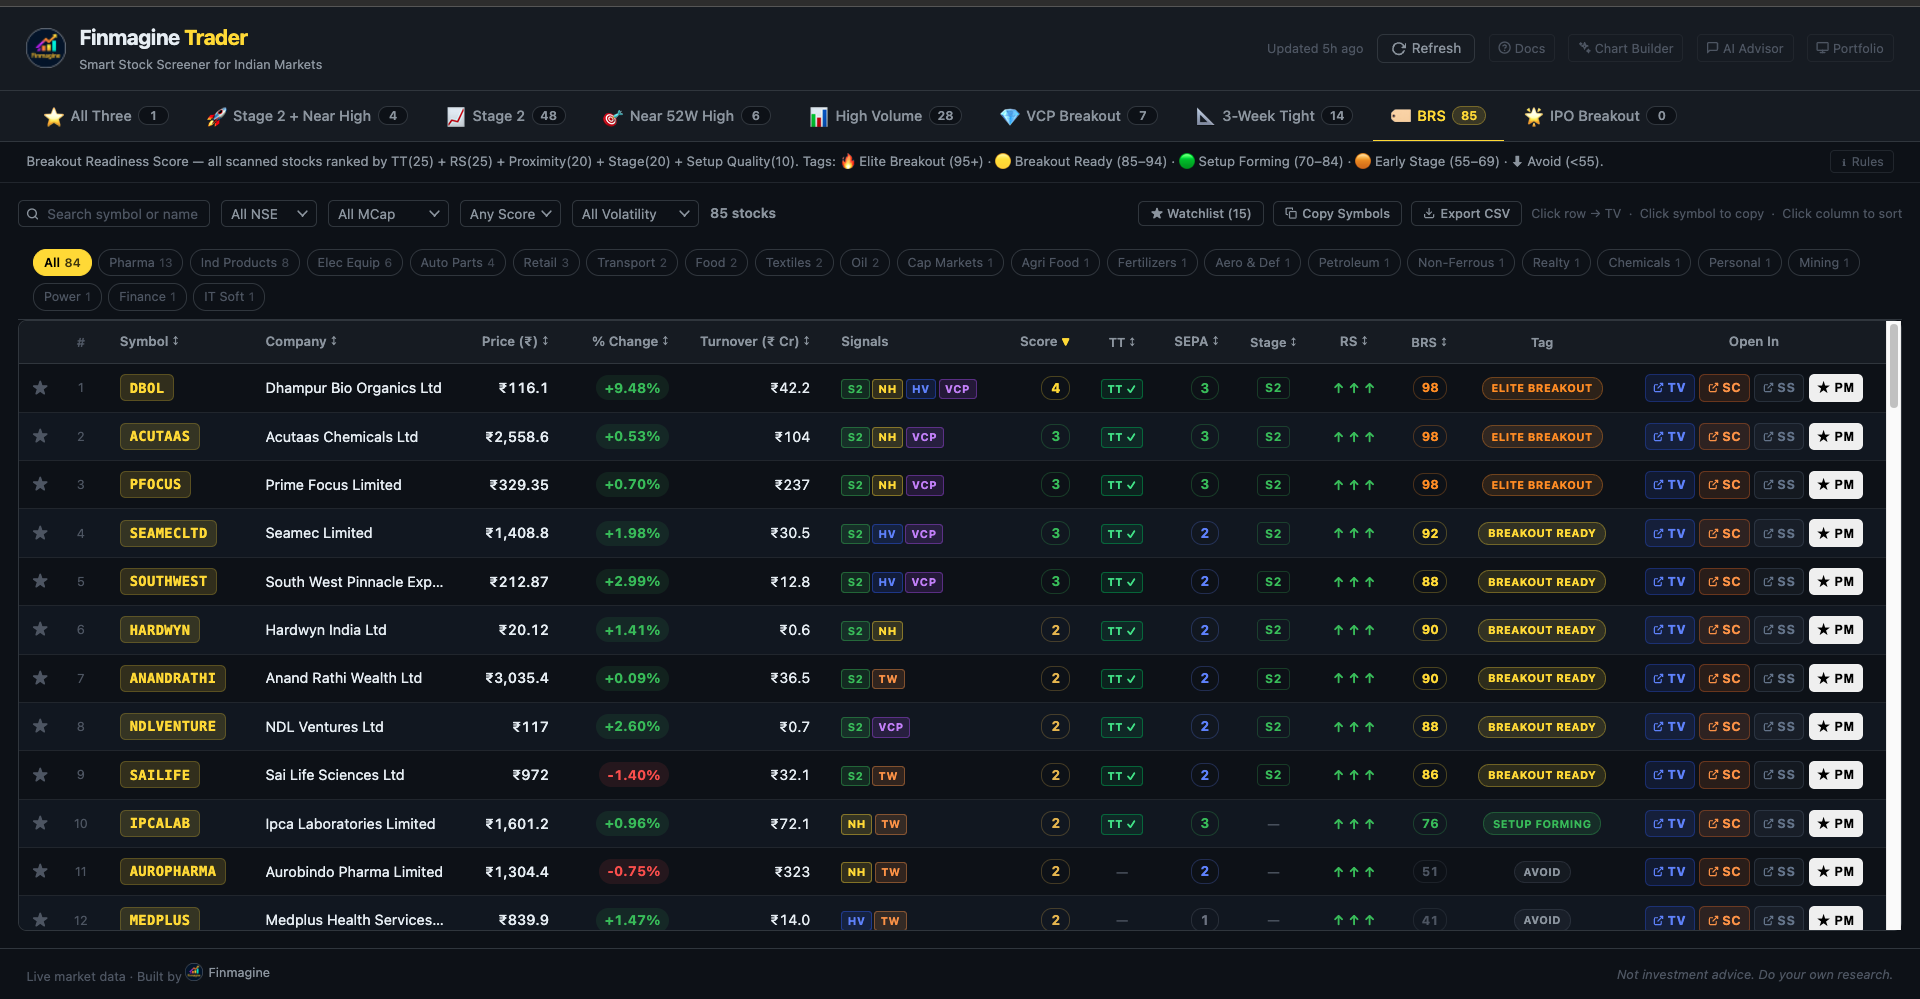
:bar_chart: Breakout Readiness Score (BRS)

The headline feature. BRS is a 0–100 composite that ranks every Stage 2 stock across five independently weighted signals:

┌───────────────────────────────┬────────┐
│ Signal │ Weight │
├───────────────────────────────┼────────┤
│ Trend Template compliance │ 25 pts │
├───────────────────────────────┼────────┤
│ Relative Strength vs Nifty 50 │ 25 pts │
├───────────────────────────────┼────────┤
│ Proximity to 52-week high │ 20 pts │
├───────────────────────────────┼────────┤
│ Stage classification │ 20 pts │
├───────────────────────────────┼────────┤
│ Breakout Quality indicators │ 10 pts │
└───────────────────────────────┴────────┘

Five tiers: :fire: Elite Breakout (95+) · :1st_place_medal: Breakout Ready (85–94) · :green_circle: Setup Forming (70–84) · :yellow_circle: Early Stage (55–69) · :white_large_square: Avoid (<55)

Full BRS methodology: The Breakout Readiness Score: From Scanner to Decision Engine | Finmagine Trader


:label: Stage Classification

Every scan result carries a Stage 1/2/3/4 badge using the complete Minervini moving average hierarchy — close vs SMA50/150/200, slope of 200, 52-week range position. Not just a binary Stage 2 filter.


:chart_increasing: Relative Strength vs Nifty 50

12-month price performance against Nifty 50, normalized to 0–100 across the entire NSE universe. Stocks that have consistently outperformed rank highest. Replaces gut feel with a precise, comparable number shown on every
scan row.


:white_check_mark: Trend Template

Minervini’s 8-point filter evaluated for every stock simultaneously. TT ✓ badge = all eight criteria pass. The strictest institutional momentum filter for Indian markets.

Full Trend Template methodology: The Minervini Trend Template: 7-Criteria Structure Quality Check for NSE Stocks | Finmagine Trader


:link: Signals Ribbon on Screener.in

BRS score, Stage badge, and TT status now display inline on company pages the moment you open them — no need to open the Trader popup separately.


Install / update free on Chrome Web Store:
https://chromewebstore.google.com/detail/finmagine-trader/ndkonkooaokgngjhjjefnnkdbmhgekkf

Trader landing page: Finmagine Trader - Free Chrome Extension for Indian Stock Momentum Scanning

Feedback welcome here as always.

The Rules Section When Expanded is Empty, Unlike other sections, which still populate Rules

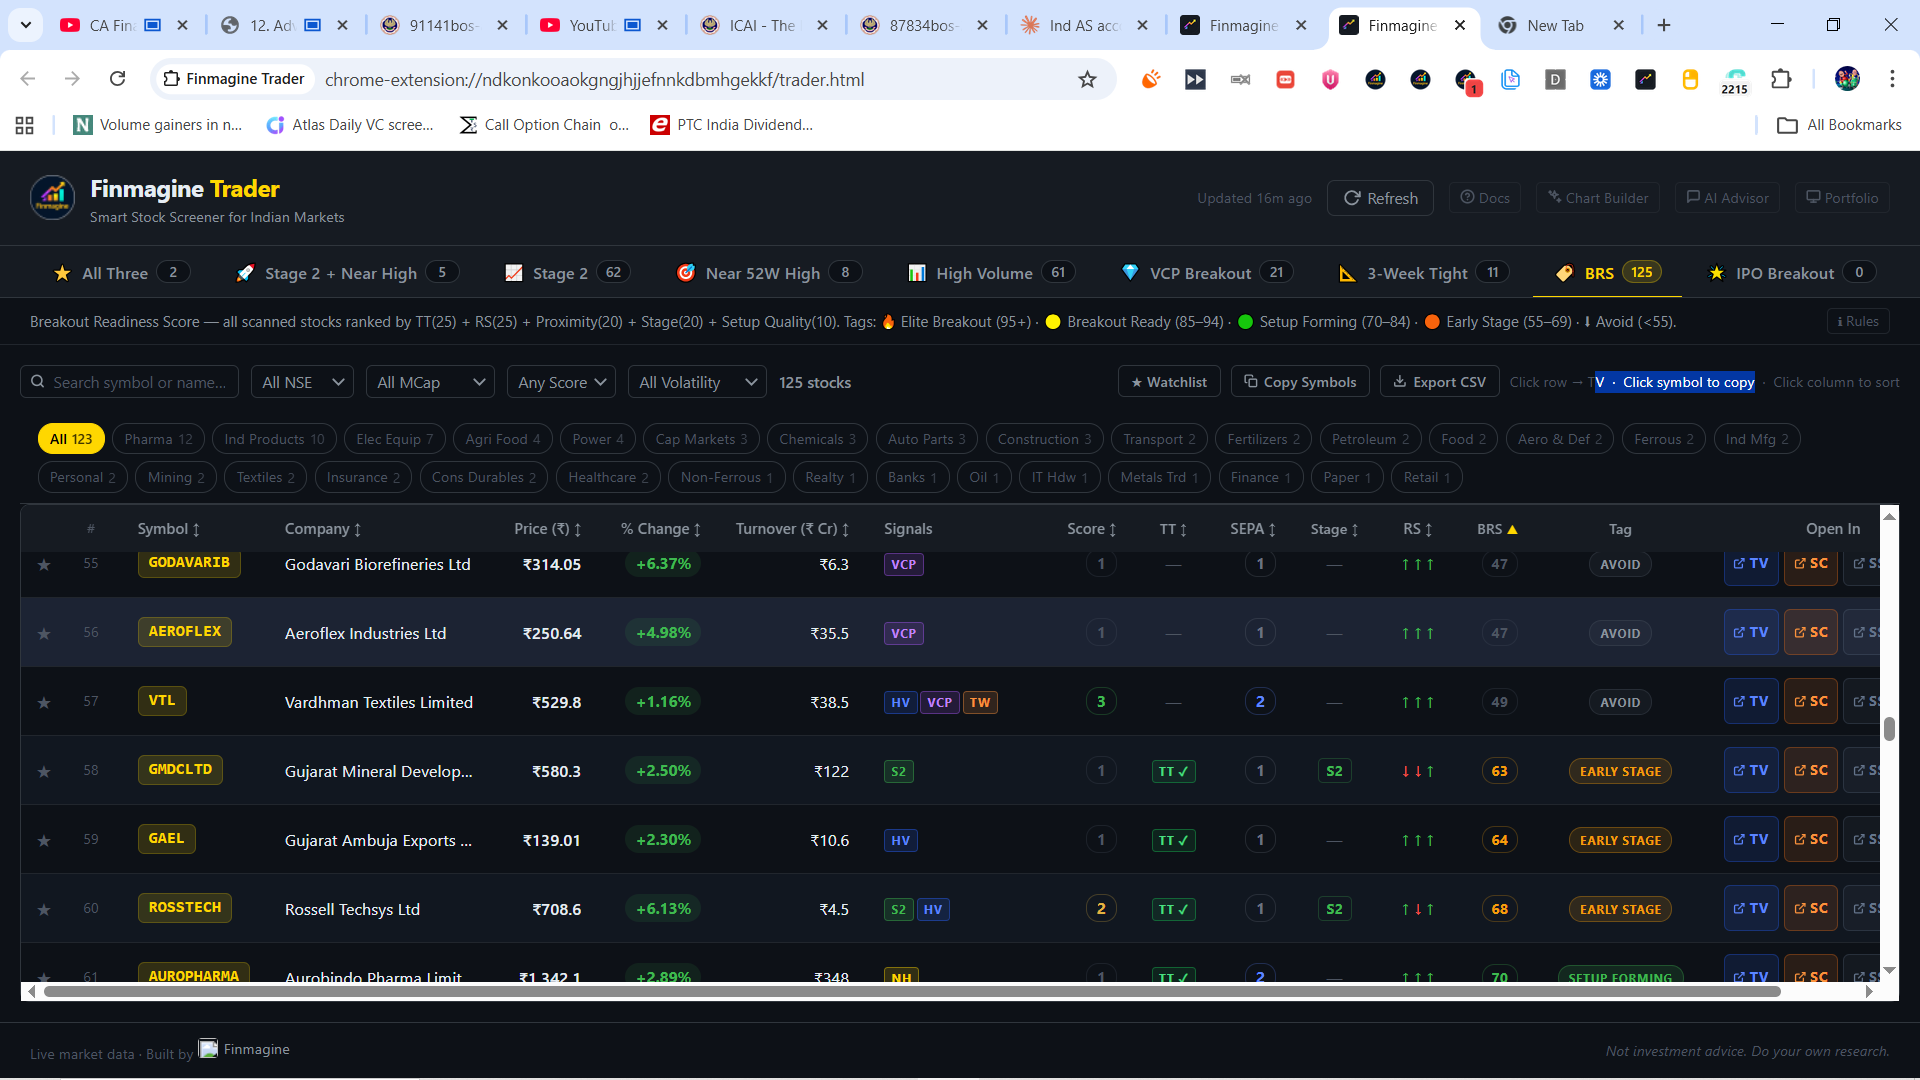
sir why aeroflex in avoid list …aeroflex is outperforming nifty and trading near ath…i think brs calculation need some modificaton

Thanks for catching this! The BRS Rules section was indeed empty — a bug where the rules weren’t wired up to the popover. Fixed in v1.9.1 (submitted today, pending CWS review). Once it rolls out, expanding the BRS rules will show the full scoring breakdown: Trend Template (25 pts), Relative Strength vs Nifty (25 pts), Proximity to 52W High (20 pts), Stage (20 pts), and Breakout Quality (10 pts) with exact thresholds for each.

Good catch, and you’re right — this was a flaw in the BRS algorithm. A stock pressing its 52-week high has broken through all overhead supply, so labelling it “Avoid” is misleading regardless of its longer-term RS history. What was happening: BRS can score low if the 12M/6M relative strength vs Nifty is negative (stock underperformed over the year) even when the stock is currently near ATH. The formula didn’t have a floor for NH stocks.

Fixed in v1.9.1 (submitted today): stocks within 2% of their 52-week high now get a minimum BRS of 55 (Early Stage) — never Avoid. The relative ranking among NH stocks is unchanged; only the floor tag is corrected.

1 Like

stock within 7% away from 52w high should be 55 score this will represent better picture

@gaurav_aggarwal1 — good follow-up, and you’re right that 2% is tight.
But 7% needs careful thought before we expand it.

Your observation actually answers itself: in a bull market, dozens of stocks sit within 7% of their 52W high at any given time — many of them just momentum latecomers with no real RS story.
Giving all of them a BRS floor of 55 would dilute the signal significantly.
The whole point of the floor was to prevent a stock pressing ATH from being labelled Avoid — not to broadly elevate stocks in a normal consolidation.

The 2% threshold is intentionally strict: if a stock is within 2% of its 52W high, it has essentially broken out, and the BRS floor kicks in as a correction to the algorithm.
At 7%, you’re including stocks that have pulled back meaningfully — some legitimately, some not.

What we may do instead: rather than a fixed % threshold, tie the floor to the actual 52W high breakout condition (stock making a new high in the last N days).
That captures genuine breakouts regardless of market regime without creating noise in bull markets.

Will log this for v1.9.2. Thanks for pushing on it — these edge cases improve the algo.

Sure, I have an Excel as well to track the key KPIs of each sector. We can put that in the knowledge base of Custom GPT and Gemini Gem.
REVENUE LINE ITEMS.xlsx (14.4 KB)

Thanks @karanshah137 — the Excel was really useful and the timing was perfect. We’ve incorporated it into the Business KPIs template. The sector coverage has gone from 7 broad categories to 45
industries, including the more granular financial services breakdown your file had — Exchange Infrastructure, Depositories, AMC Registrars (CAMS/KFin), Credit Bureaus, Health TPAs, Fintech
Lenders as a separate category from NBFCs, Rating Agencies, and Educational Testing. The template is now genuinely useful across the full breadth of NSE-listed companies, not just the obvious
sectors.

Also noted your point about the template working without the Insights table — the instructions already direct the AI to reconstruct KPIs from the concall transcripts and annual reports in the
Documents section when no table is present. So premium Screener.in users get structured data + AI extension, free users still get a useful prompt via the documents route.

1 Like

Hi VP community,

Sharing a feature we just shipped that might be useful for those of you who
use mutual funds alongside direct equity.

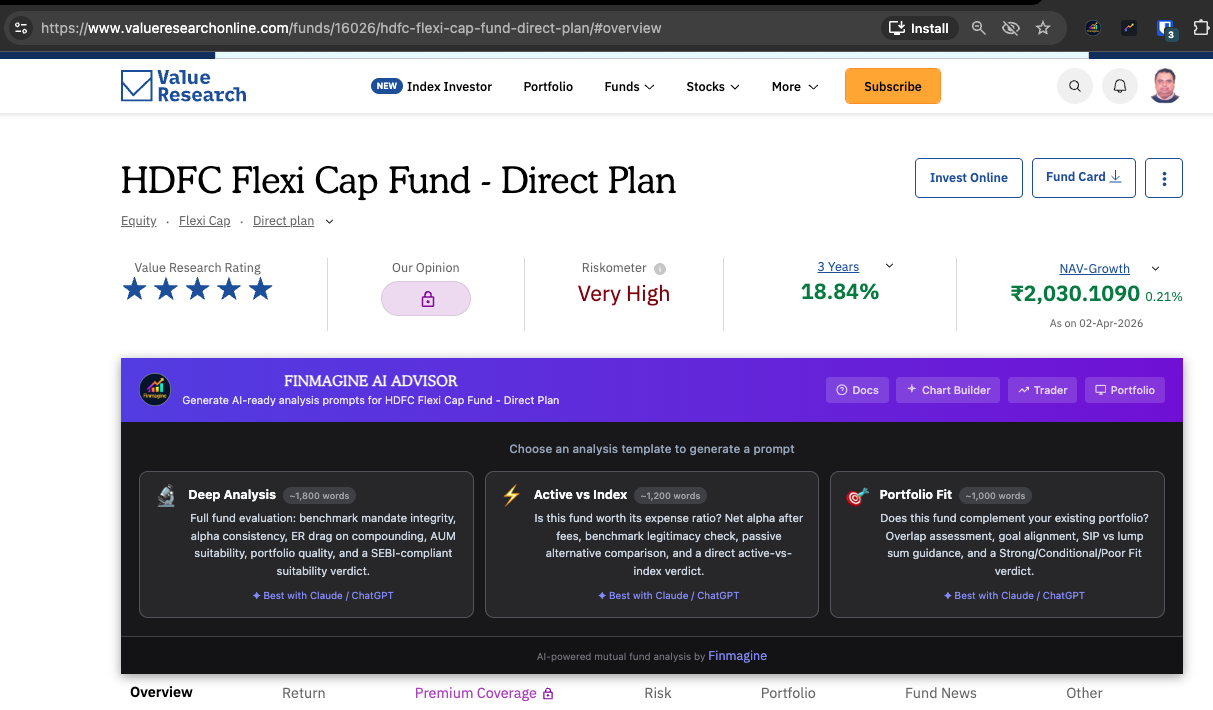
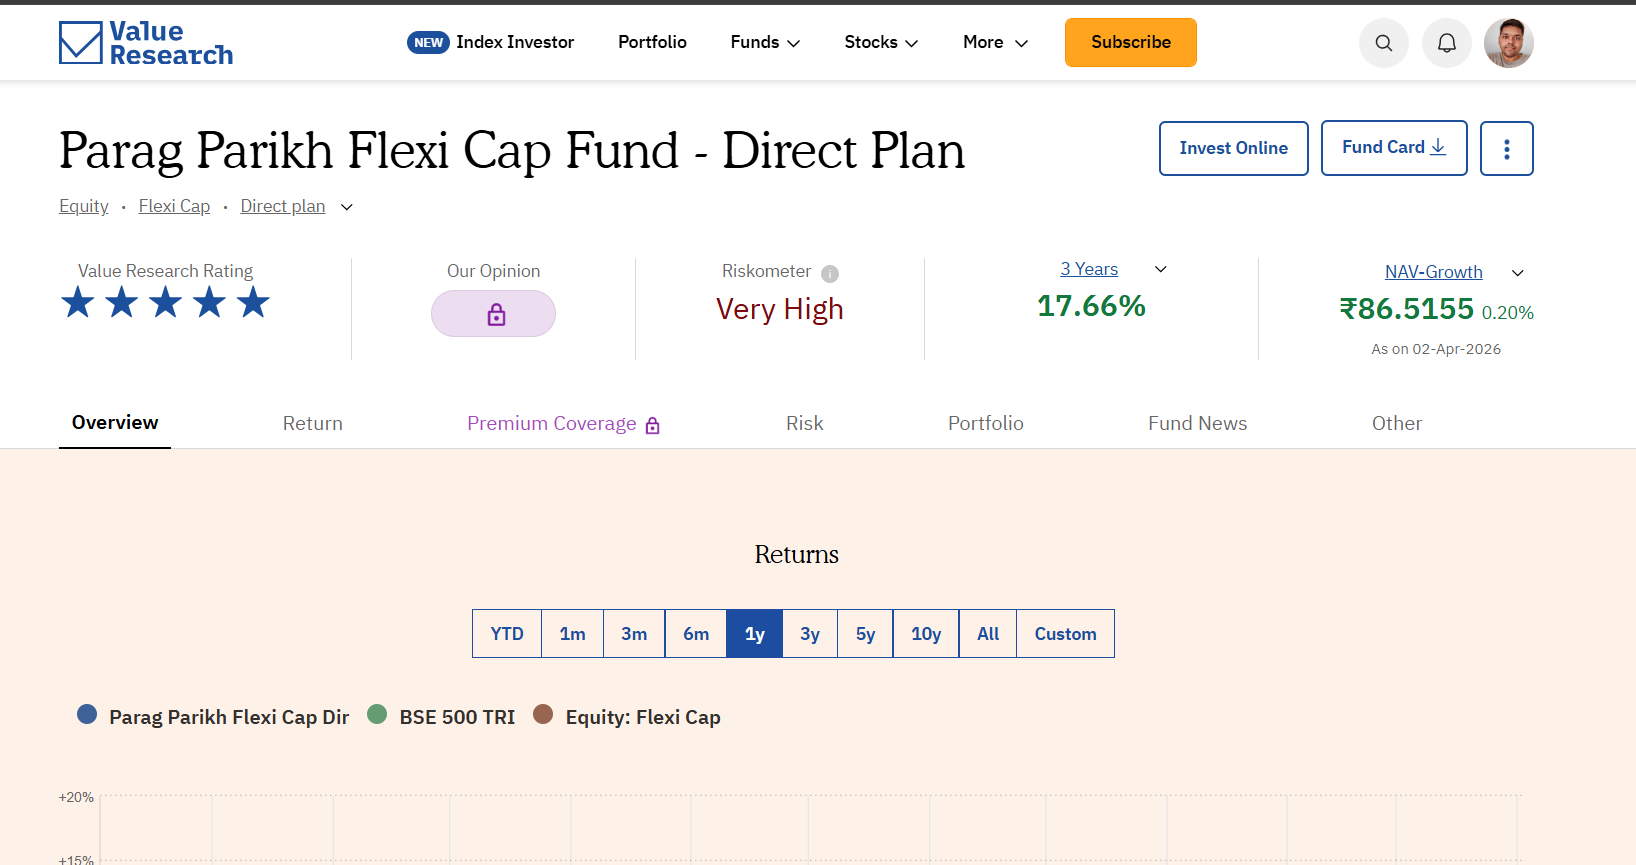
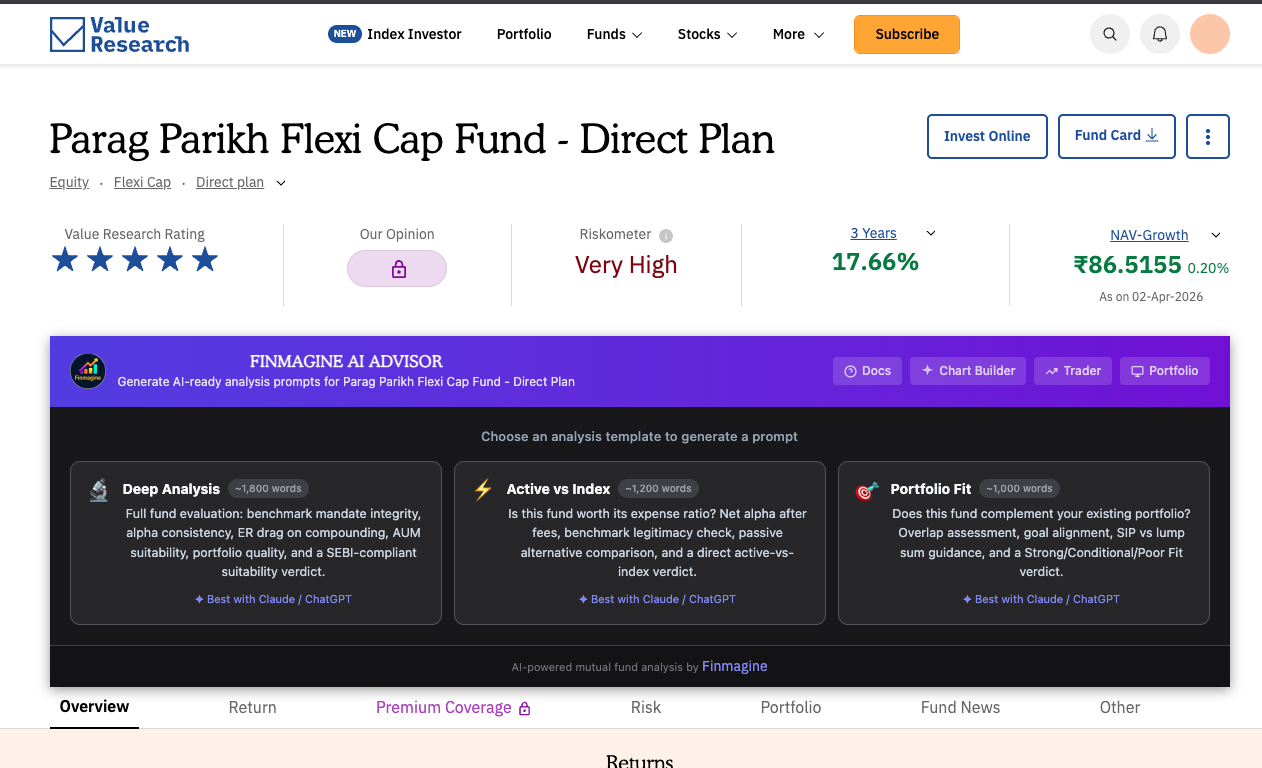
What’s new: Finmagine AI Advisor (Chrome extension) now works on
valueresearchonline.com. Visit any fund page and the AI panel appears
automatically with 3 analysis templates.


Template 1 — Deep Analysis
A 7-dimension forensic audit of the fund:

  • Benchmark mandate integrity (is the fund actually doing what it claims?)
  • Alpha consistency AND alpha decay (many funds show great 5Y alpha but
    it’s mostly from 2020-21 — this surfaces that)
  • Expense ratio drag computed as 10-year compounded impact on returns
  • AUM suitability (a ₹50,000 Cr mid-cap fund has a structural problem)
  • Portfolio construction quality
  • Return consistency vs category peers
  • SEBI suitability verdict

Best with Claude or ChatGPT.


Template 2 — Active vs Index
The question most investors don’t ask rigorously: does the alpha justify
the cost?

This template:

  • Computes net alpha after all fees (not gross alpha)
  • Checks benchmark legitimacy (TRI vs PRI — some funds still compare vs
    Price Return Index, inflating apparent alpha)
  • Identifies the best passive alternative for this fund’s mandate
  • Delivers a direct Choose Active / Choose Index verdict

Template 3 — Portfolio Fit
This one is different — it’s not about whether the fund is good, it’s about
whether it’s right for your portfolio.

You describe your current holdings, investment horizon, risk tolerance, and
goals. The AI assesses mandate overlap, concentration risk, SIP vs lump sum
suitability, and position sizing. Verdict: Strong Fit / Conditional Fit /
Poor Fit
.

Particularly useful when you already hold a large-cap fund and are
evaluating a flexi-cap — the overlap analysis alone saves a lot of guesswork.


6 tutorials covering everything:

  1. Intro & how it works: Introducing Finmagine MF Analysis on Value Research Online: Which Template to Use When | Finmagine AI Advisor
  2. Deep Analysis walkthrough: Deep Analysis: A 7-Dimension Mutual Fund Audit Using Finmagine AI Advisor | VRO MF Analysis
  3. Deep Analysis — reading the output: Reading the Deep Analysis Output: What Suitable, Conditionally Suitable and Not Suitable Actually Mean | Finmagine AI Advisor
  4. Active vs Index guide: Active vs Index: Does Your Mutual Fund's Alpha Justify Its Cost? | Finmagine AI Advisor
  5. Portfolio Fit — the context: Portfolio Fit: What to Write in the Context Box for Useful AI Analysis | Finmagine AI Advisor
  6. Portfolio Fit — practice examples: Portfolio Fit in Practice: Building a Diversified MF Portfolio with AI | Finmagine AI Advisor

Install: Finmagine AI Advisor - Free Chrome Extension for Institutional-Grade Stock Analysis on Screener.in (free, Chrome)

Happy to answer questions on how any of the templates work.

1 Like

Waited 30–40 seconds but MF Analysis doesn’t appears in the page, above the fund’s tab bar

@aranshah137:

Thanks for flagging this! This is a Chrome extension behaviour — when AIA
updated from v2.13.0 to v2.14.0, the new content scripts don’t
automatically inject into tabs that were already open before the update.

Fix (takes 5 seconds):

  1. Simply reload the VRO fund page (Ctrl+R / Cmd+R)
    → The panel should appear above the tab bar

If reload doesn’t work:
2. Go to chrome://extensions → find Finmagine AI Advisor → click the
reload ↺ icon → then reload the VRO page

Also make sure you’re on a specific fund detail page — the panel only
appears on pages like:
valueresearchonline.com/funds/19701/ppfas-flexi-cap-fund-direct-plan/
(not on fund listing or search pages)

Let me know if it still doesn’t appear after a reload!

Love the extension.
Quick feedback: Prompt is not able to fetch Insights section data.
After page loads, I click on insights section to unlock my free insight (5 free per month).
Ideally prompt should update to fetch those insights. Currently it does not.
I guess prompts are created when page loads.

Sir, I have shared the link of the Discount Stock Scanner. Could you please add it to Fin Trader and display the BRS score so that we can at least get an idea of how reliable it is for buying the stock at the bottom? BOTTOM, Technical Analysis Scanner