Hello ValuePickr community,
I’ve just launched Finmagine AI Advisor — a free Chrome extension that solves a problem every serious Screener.in user knows well: you have all the data, but turning 12 years of financial tables into a coherent investment thesis still requires the kind of structured analytical thinking that institutional teams have spent years systematizing.
The extension bridges that gap.
![]() Chrome Web Store: https://chromewebstore.google.com/detail/finmagine-ai-advisor-–-sm/gohgbkplhjbijgnnaoijnnlicbedofce
Chrome Web Store: https://chromewebstore.google.com/detail/finmagine-ai-advisor-–-sm/gohgbkplhjbijgnnaoijnnlicbedofce
![]() Landing Page & Full Documentation: Finmagine AI Advisor - Free Chrome Extension for Institutional-Grade Stock Analysis on Screener.in
Landing Page & Full Documentation: Finmagine AI Advisor - Free Chrome Extension for Institutional-Grade Stock Analysis on Screener.in
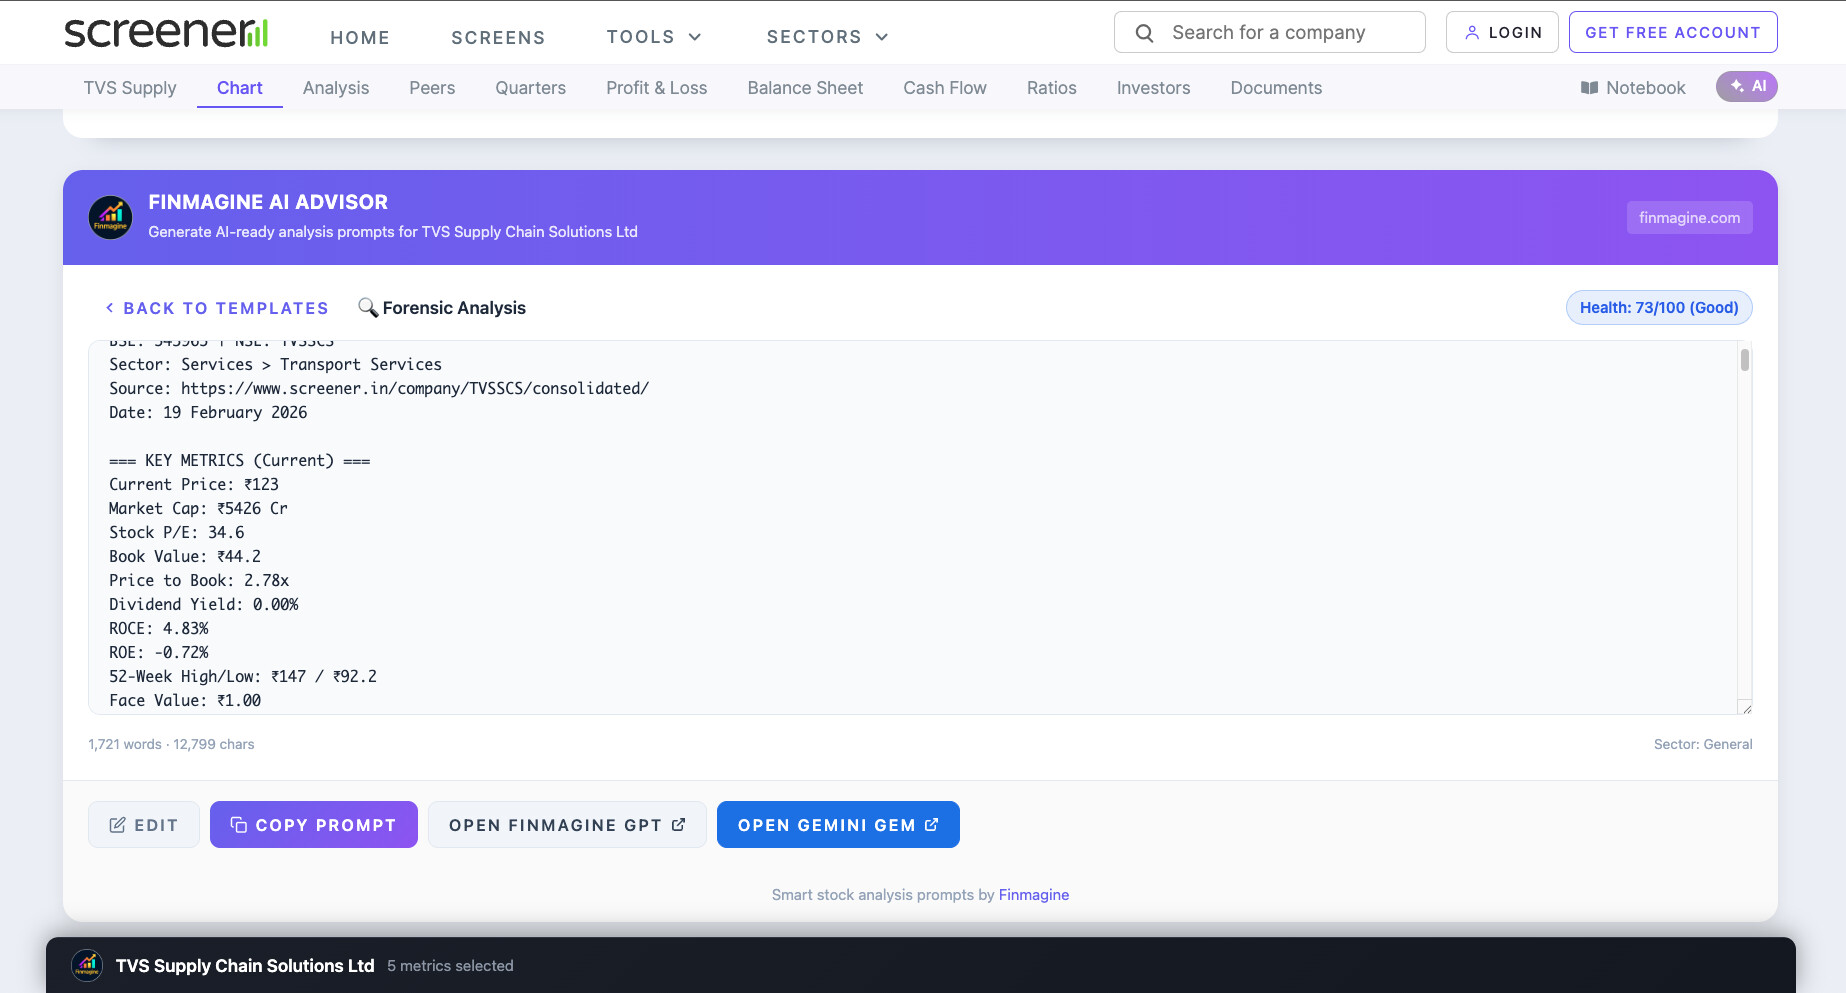
What It Does
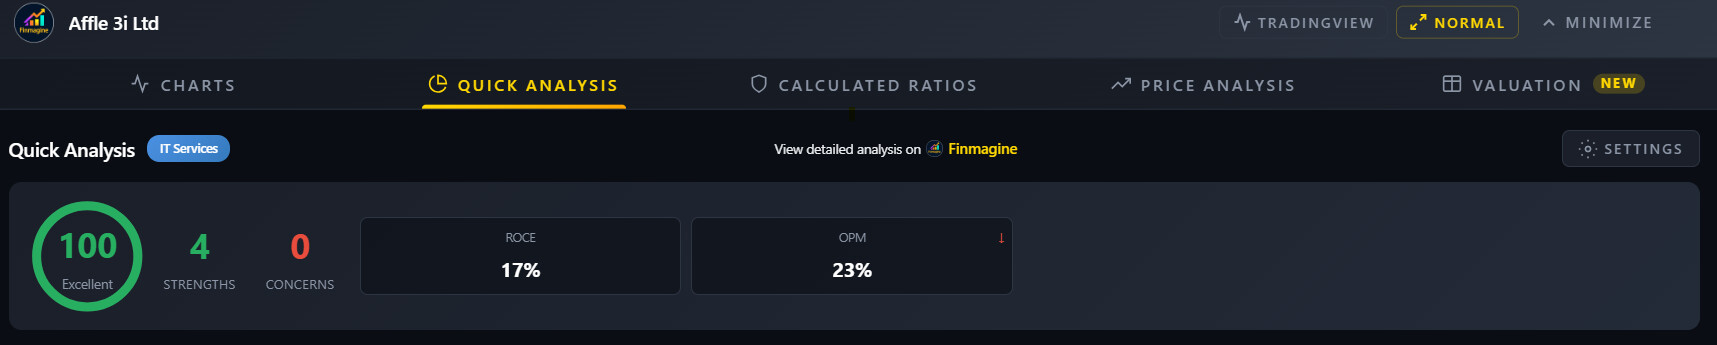
When you visit any company page on Screener.in, the Finmagine AI Advisor panel appears automatically below the chart section. It extracts everything on the page — key metrics, 6 financial tables (12 years of P&L, Balance Sheet, Cash Flow, Ratios, Shareholding, Quarterly), pros & cons, sector classification, and document links (concall transcripts, annual reports, credit ratings).
Then, with one click on a template, it:
- Detects the company’s sector (from the Peer Comparison breadcrumb)
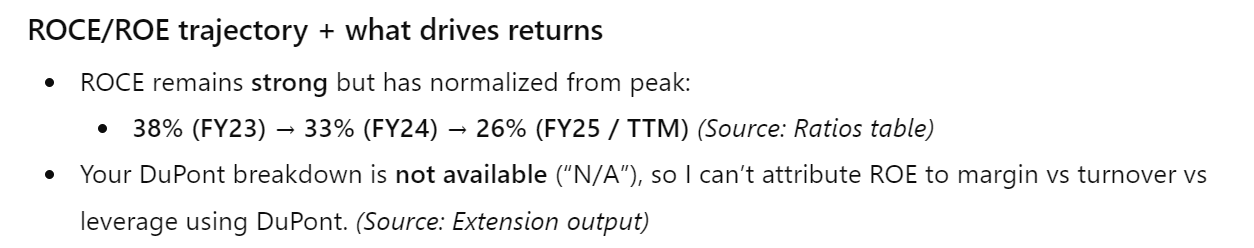
- Runs sector-aware analysis: health score, CAGRs, DuPont ROE decomposition, valuation verdicts
- Assembles a ~1,800-word structured research prompt
- You copy → paste into the Finmagine Extension Analyst Custom GPT → receive institutional-grade research output in 2–5 minutes
The 5 Analysis Templates (India / Screener.in)
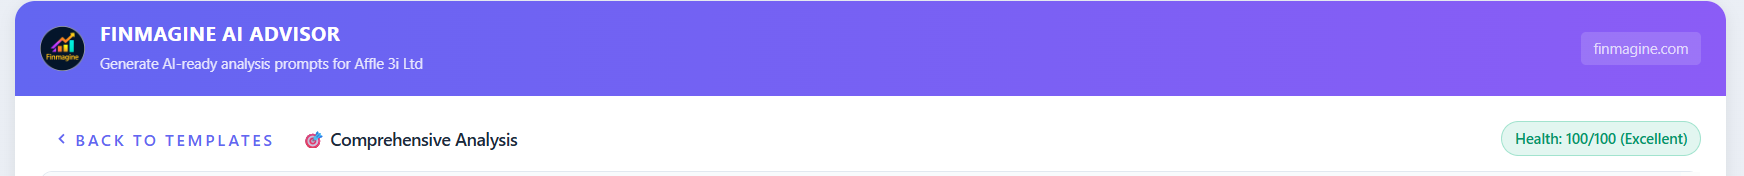
Template 1 — Comprehensive Analysis
Full 360-degree investment thesis using the Five-Parameter Weighted Scoring Framework: Financial Health (25%), Growth Prospects (25%), Competitive Position (20%), Management Quality (15%), Valuation (15%). Every parameter scored 2–10 with a weighted composite verdict.
Template 2 — Risk-Reward Analysis
Material risk identification across 5 dimensions. Probability-weighted Bull/Base/Bear return scenarios. “Cheap for a reason” detection. Margin of safety assessment.
Template 3 — Management Quality Deep-Dive
12-quarter Promise vs. Delivery tracking. Capital allocation efficiency. Governance assessment. The Management Integrity Matrix. Flags “metric shopping” red flags.
Template 4 — Quarterly Deep-Dive
Sequential quarterly trend analysis, earnings quality checks, margin trajectory, and forward guidance extraction. Answers: is quarterly momentum supporting or diverging from the annual story?
Template 5 — Deep Research (Featured)
This one goes beyond the prompt data. The GPT is instructed to browse and read actual BSE PDFs — concall transcripts, investor presentations, annual reports. It produces a 9-part forensic analysis: Sector Context → Financial Forensics → PPT Analysis (12 quarters) → Concall Transcript Analysis → Annual Report Forensics → Management Integrity Scorecard → News & Competition → Growth Triggers → Final Verdict. Takes 15–30 minutes because it actually reads the documents.
Sector-Aware Intelligence: 18 Profiles
Generic stock screeners apply the same rules to every company. The extension has 18 specialized sector profiles:
- Banking/NBFC: NIM, GNPA, CASA, ROA — D/E skipped, negative CFO is normal, P/B is primary
- IT Services: Skip D/E and Current Ratio; focus on employee cost ratio and deal wins
- Pharma: Gross margin emphasis, R&D pipeline, FDA risk flags
- Metals & Mining: EV/EBITDA primary (P/E is unreliable for cyclicals)
- Infrastructure: Interest coverage, order book-to-revenue ratio
- FMCG: Volume vs price-led growth distinction
- Plus 12 more: Telecom, Utilities, Chemicals, Auto, Capital Goods, Textiles, Fintech, Real Estate, Insurance, Healthcare, Media, and a General fallback
When the extension detects the company’s sector, every downstream analysis — health score thresholds, valuation metrics, concern flags — adjusts automatically.
The Built-In Analysis Engine
Before GPT even sees the data, the extension computes:
- Health Score (0–100): Starts at 50 (neutral). Adds/subtracts based on revenue/profit CAGR quality, ROE/ROCE levels, debt status, cash flow quality, and sector-specific metrics. Color-coded badge: Excellent → Good → Average → Below Average → Poor.
- Multi-Horizon CAGRs: Revenue, Profit, and EPS growth at 1Y, 3Y, 5Y, 10Y.
- DuPont ROE Decomposition: ROE = Net Profit Margin × Asset Turnover × Equity Multiplier. Reveals whether returns are driven by genuine profitability, operational efficiency, or financial leverage.
- Valuation Verdicts: Sector-appropriate metric compared against 5-year median and peer benchmarks.
- Strengths & Concerns: Automated identification across growth, profitability, leverage, cash flow, and shareholding dimensions.
Privacy: Zero Data Collection
This is important to me. The extension is 100% client-side. It reads visible data from the Screener.in page and generates the prompt locally in your browser. No network calls, no analytics, no tracking, no telemetry. Your financial research never leaves your machine.
Privacy policy: https://finmagine.com/chrome-extension-privacy.php
Complete India/Screener.in Deep Dive Tutorial
I’ve written a detailed 25-minute tutorial covering the complete architecture, all 5 templates, sector-aware intelligence, health scoring methodology, DuPont decomposition, and the 21-parameter scoring framework. Includes video guide, audio commentary, and 56 interactive flashcards:
![]() Turn Screener.in Into an Institutional-Grade AI Analyst | Finmagine AI Advisor Deep Dive
Turn Screener.in Into an Institutional-Grade AI Analyst | Finmagine AI Advisor Deep Dive
Coming Soon: v2.0.0 — US & Global Stocks (Under Google Review)
v2.0.0 extends the AI Advisor to stockanalysis.com with 4 templates for US and global stocks. It’s currently under Google’s review process and will be live within a few days.
4 US Templates:
Forensic Analysis (Featured) — A 7-part purely quantitative investigation that processes 11 pages of data per stock, including the exclusive /forecast/ page for analyst price targets and forward EPS estimates. No documents, no guesswork — just hard numbers:
- Part 1: Financial Forensics (P&L, Balance Sheet, Cash Flow, Ratio trends)
- Part 2: Financial Health (Altman Z-Score + Piotroski F-Score)
- Part 3: Value Creation (ROIC vs WACC spread)
- Part 4: Ownership Intelligence (Institutional, Insider, Short Interest)
- Part 5: Analyst Consensus Forensics (price target spread, recommendation trends, forward EPS)
- Part 6: Valuation Forensics (earnings yield vs 10Y Treasury)
- Part 7: Final Verdict (Five-Parameter Score + Bull/Base/Bear)
Comes with a full Amazon (AMZN) case study — Z-Score 5.06 (Safe Zone), F-Score 5/9 (Neutral), ROIC 14.23% vs WACC 11.04% (+3.19% spread), $131.8B CapEx paradox, 85% analyst price target spread, final score 7.9/10 (Core Compounder).
Comprehensive Analysis, Risk-Reward Analysis, Quarterly Deep-Dive also available for US stocks.
v2.0.0 Tutorials:
 US Stocks Deep Dive: Finmagine AI Advisor v2.0.0: Institutional-Grade US Stock Analysis in One Click | Deep Dive Tutorial
 Forensic Analysis Deep Dive (57 flashcards, video, audio): Forensic Analysis: The 7-Part Quantitative Due Diligence System for US Stocks | Finmagine AI Advisor
How to Install
- Click the Chrome Web Store link below
- Click “Add to Chrome”
- Visit any company page on Screener.in
- The panel appears automatically — pick a template and go
![]() https://chromewebstore.google.com/detail/finmagine-ai-advisor-–-sm/gohgbkplhjbijgnnaoijnnlicbedofce
https://chromewebstore.google.com/detail/finmagine-ai-advisor-–-sm/gohgbkplhjbijgnnaoijnnlicbedofce
Works on Chrome, Edge, Brave, and Opera. Completely free. No registration, no subscription, no credit card.
Happy to answer any questions. Feedback — especially on sector-specific edge cases and template output quality — is welcome.