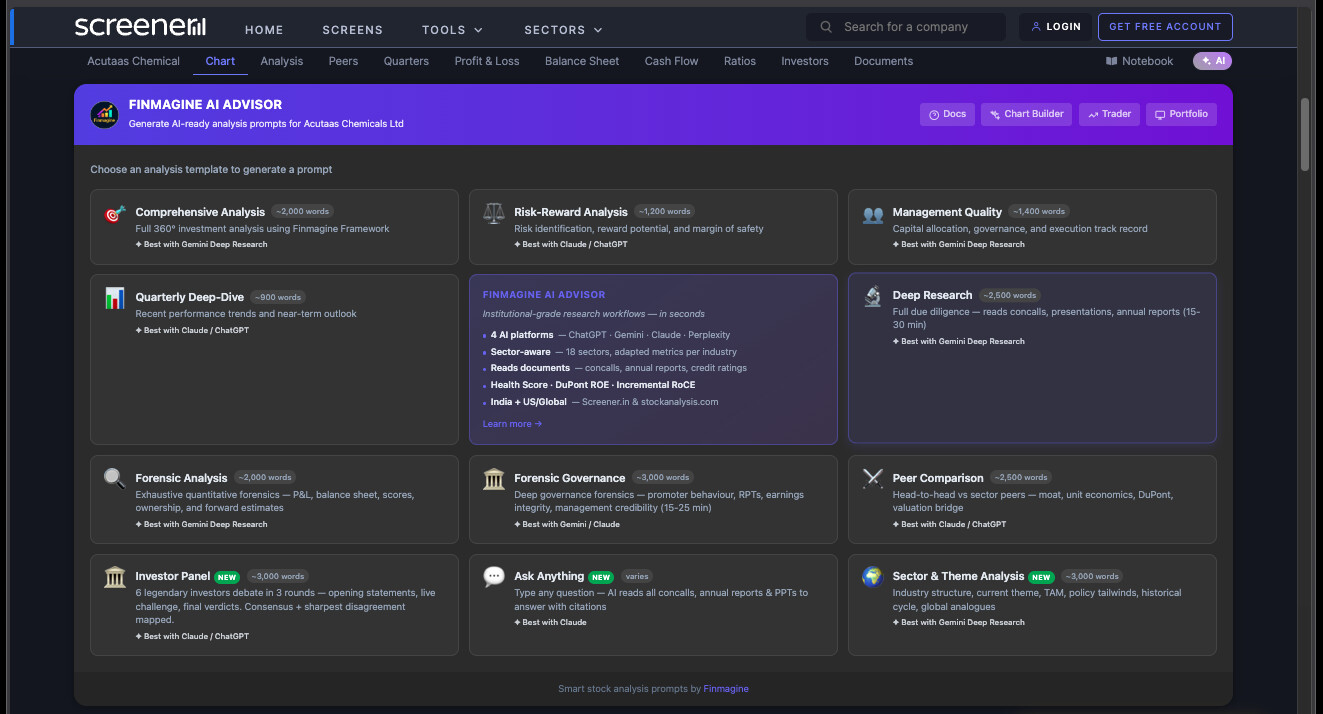
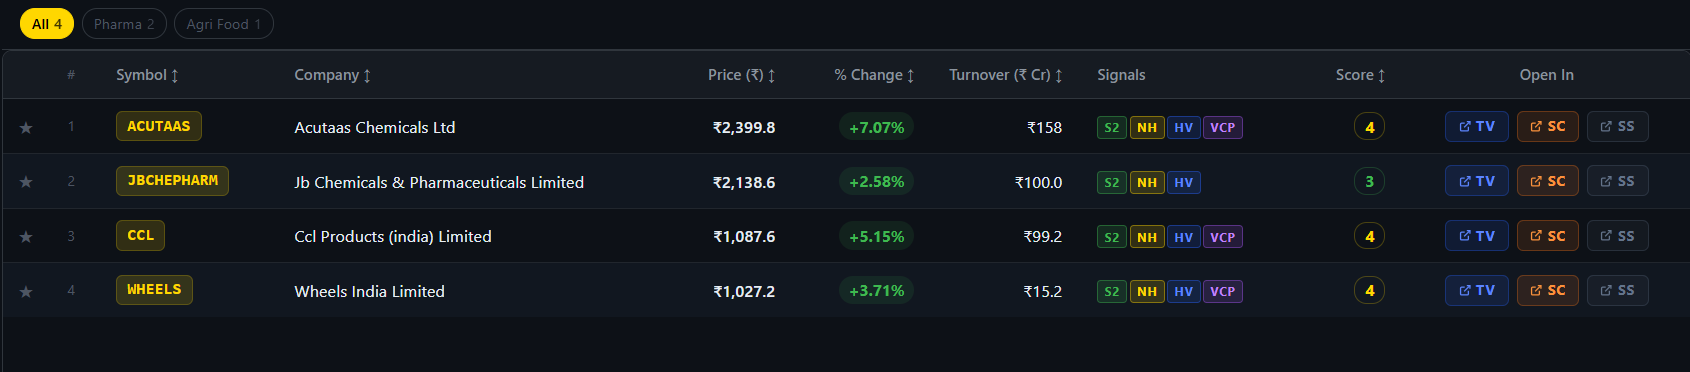
[TOOL LAUNCH] Free Chrome Extension — Turn Screener.in Data into Institutional-Grade AI Research Prompts | Zero Data Collection | v2.0.0 (US Stocks + Forensic Analysis) Under Review

@karanshah137 — this is a genuinely good structural improvement. The current Investor Panel produces 6 independent assessments in sequence, which is useful but misses the most interesting part of a real investment committee: the
friction between philosophies.

Your three-round structure fixes that:

  • Round 1 (impressions) — establishes each investor’s prior and what they focus on first
  • Round 2 (debate) — where the real signal is; Pabrai and Graham will always challenge what Jhunjhunwala accepts
  • Round 3 (verdicts) — shows whether the debate changed anyone’s mind

The “sharpest philosophical disagreement” mapping at the end is the part I’d highlight most — for any stock, that disagreement is usually the key risk the market is pricing in.

I’m going to incorporate this structure into the next version of the Investor Panel template. If you have a specific stock output you generated with this prompt, would be great to see how the debate played out.

1 Like

@karanshah137 — implemented your suggestion and tested it on DMART right away. Here’s what changed:

The old template had 6 investors giving independent sequential verdicts — they never heard each other. Your 3-round structure changes the dynamic entirely. In the DMART run, Round 2 produced 4 live exchanges: Pabrai challenging
Jhunjhunwala on the 7% OPM, Graham challenging Maheshwari on P/B 10.89x, Mukherjea and Andrade reinforcing each other on structural runway. The sharpest disagreement (Graham vs Maheshwari — same P/E 87.2 data point, opposite
conclusions) is now labelled with a framework divergence table showing exactly why balance-sheet-first vs earnings-trajectory lead to a Strong Sell vs Strong Buy from identical numbers.

One thing I’ve pushed the prompt harder on for the next run: forcing at least one position change in Round 3. In this first test nobody moved, which is the one thing a live debate should produce. Will retest.

Thanks for the suggestion — it’s a genuine structural improvement, not just cosmetic.

1 Like

@karanshah137 — tested your suggestion on DMART. Here’s what the 3-round format produced:

Round 2 had 4 live exchanges — Pabrai vs Basant on margin of safety, Graham vs Jhunjhunwala on P/B 10.89x, Mukherjea vs Andrade on 1-year profit growth slowing to 5.8%, and Graham vs the room on earnings yield of ~1.1%. The sharpest disagreement (Graham vs Maheshwari) surfaces as a framework table: same P/E 87 data point, Graham reads “overvalued,” Basant reads “acceptable premium” — same number, opposite conclusions.

The One Question the panel couldn’t answer: “How many stores can DMart realistically scale to while maintaining 7–8% OPM?” — that’s the number that determines whether P/E 87 is justified or a trap.

We’re incorporating this into the next version of the extension. Will share when it’s out.

1 Like

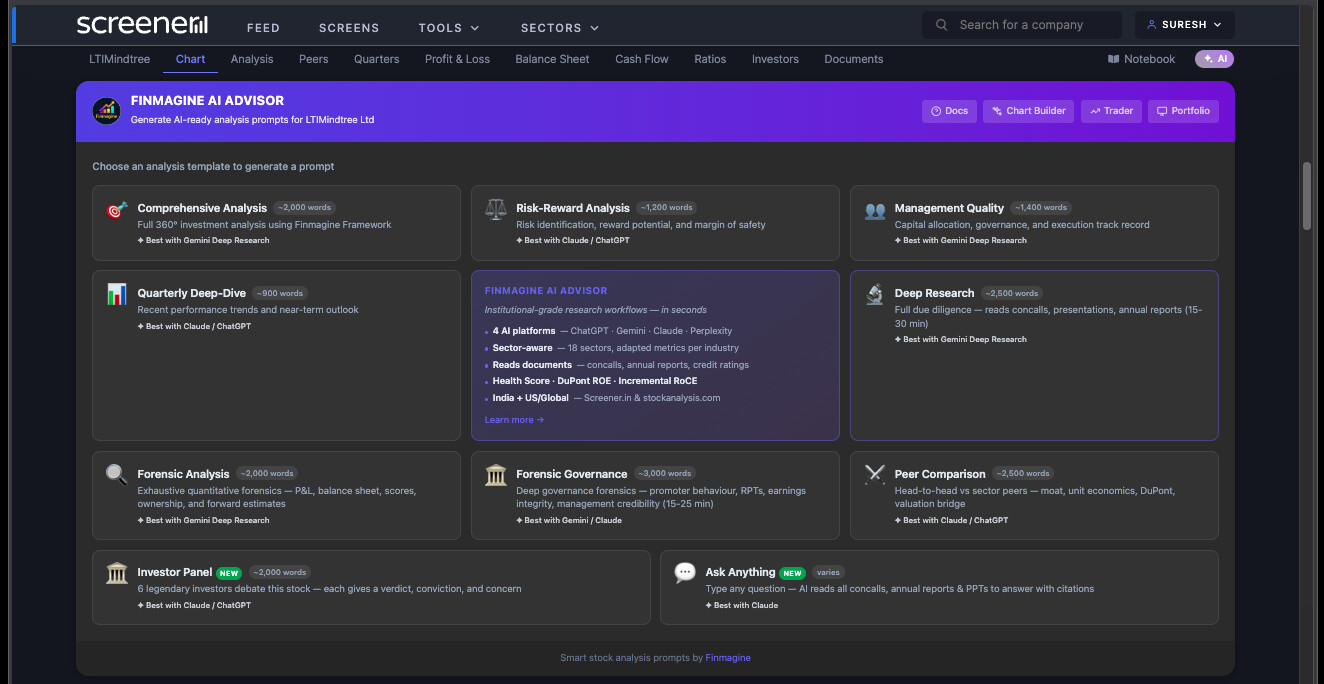
Finmagine AI Advisor v2.8 — Ask Anything + Manual Peer Selection

Two updates I’ve wanted for a while finally landed in v2.8. Sharing here since both directly address problems I’ve seen discussed on VP.


:speech_balloon: Ask Anything — citation-grounded Q&A on any stock

The existing templates (Comprehensive, Deep Research, etc.) are fixed-format analysis briefs. Ask Anything is different — you type whatever you want to know and the AI answers using only that company’s own concalls and annual
reports, with mandatory source citations (document name + quarter/year).

Some examples I’ve been using:

  • “What has management said about operating leverage — have they committed to any margin targets?”
  • “Has there been any discussion of promoter monetisation or stake dilution plans?”
  • “What are the key risks management themselves acknowledge in annual reports?”

The extension auto-extracts all document URLs from Screener.in (concalls, ARs, credit ratings). When you click Generate, the AI receives a fully structured prompt with the company’s entire document library pre-referenced — it’s
then up to the AI to actually read them. Claude and Gemini Deep Research both read PDFs natively, so they do this well.

Five pre-filled example questions are built in if you need a starting point.


:bullseye: Manual Peer Selection — fix wrong comparables

The Peer Comparison template auto-detects peers from Screener.in’s Peers tab using GICS codes. This often gives bad results — a pharma CDMO might get bulk API manufacturers as peers, a B2B specialty chemicals company gets
commodity peers.

With v2.8 you can now:

  1. Deselect any auto-detected peers that don’t belong
  2. Type in your own NSE codes (comma-separated: AKUMS, WINDLAS, SOLARA)
  3. Generate the comparison with the right peer set

The template then fetches live snapshots (P/E, ROCE, ROE, OPM, D/E, Promoter Holding) for each peer and runs a 4-analyst head-to-head with a pre-filled scorecard table.


The extension is free, no account needed, works on any Screener.in company page. 14 templates total now (10 India, 4 US).

Full feature guide + tutorial: Ask Anything & Manual Peer Selection: Finmagine AI Advisor v2.8.0 | Finmagine
Install from Chrome Web Store: https://chromewebstore.google.com/detail/finmagine-ai-advisor-–-sm/gohgbkplhjbijgnnaoijnnlicbedofce
Landing page (all templates): Finmagine AI Advisor - Free Chrome Extension for Institutional-Grade Stock Analysis on Screener.in

2 Likes

Finmagine AI Advisor v2.9.0 — Sector & Theme Analysis + Investor Panel Debate

Two new features in this release.


:globe_showing_europe_africa: Sector & Theme Analysis

New template (10th for India). An 8-part prompt that covers the full sector story:

  1. Industry structure & competitive dynamics
  2. Current theme & TAM
  3. Policy & government support
  4. Tailwinds and headwinds
  5. Historical cycle — is this sector cyclical and where are we?
  6. Global analogues — how did China/US/Korea play out?
  7. Risk scenarios if the theme fails
  8. Where does this specific company sit within the theme?

Best with Gemini Deep Research or Claude (both browse BSE/SEBI PDFs natively). Particularly useful for pharma, defence, specialty chemicals, capex-driven cyclicals — any sector where the macro story matters as much as the
company.

Full write-up with example outputs: Sector & Theme Analysis: Finmagine AI Advisor v2.9.0 | Finmagine


:classical_building: Investor Panel — Rebuilt as a 3-Round Live Debate

The old Investor Panel had 6 legendary investors delivering independent reports. This version puts them in a room together.

Round 1 — Opening Statements
Each investor gives their first impression of the company in 2-3 sentences, independently. Must cite one specific number.

Round 2 — The Debate
Investors now react to each other. Direct challenges, named disagreements, philosophy clashes. At least 3 exchanges where frameworks diverge on the same data point. The prompt asks the AI to identify The Sharpest Disagreement —
the one moment where two investors reach opposite conclusions from identical data, and explain exactly why.

Round 3 — Final Verdicts
Each investor’s final position after hearing the debate. Consensus map + where the real disagreement lies.

Every statement throughout must cite a specific number from the company’s actual financials. The output reads like a genuine investment committee transcript rather than parallel monologues.


Install free on Chrome:
https://chromewebstore.google.com/detail/finmagine-ai-advisor-–-sm/gohgbkplhjbijgnnaoijnnlicbedofce

Landing page: Finmagine AI Advisor - Free Chrome Extension for Institutional-Grade Stock Analysis on Screener.in

Four pre-configured AI platforms:

Sir Are there any updates on this trader scans section you shared on Finmagine AI Advisor?
Along with the Small Size of visualization with Finmagine Icon

Hi @karanshah137 — great timing on this question!

On the Trader scans in AI Advisor:
This just went live today. Finmagine Trader v1.6.0 was published to the Chrome Web Store a few hours ago:
https://chromewebstore.google.com/detail/finmagine-trader/ndkonkooaokgngjhjjefnnkdbmhgekkf

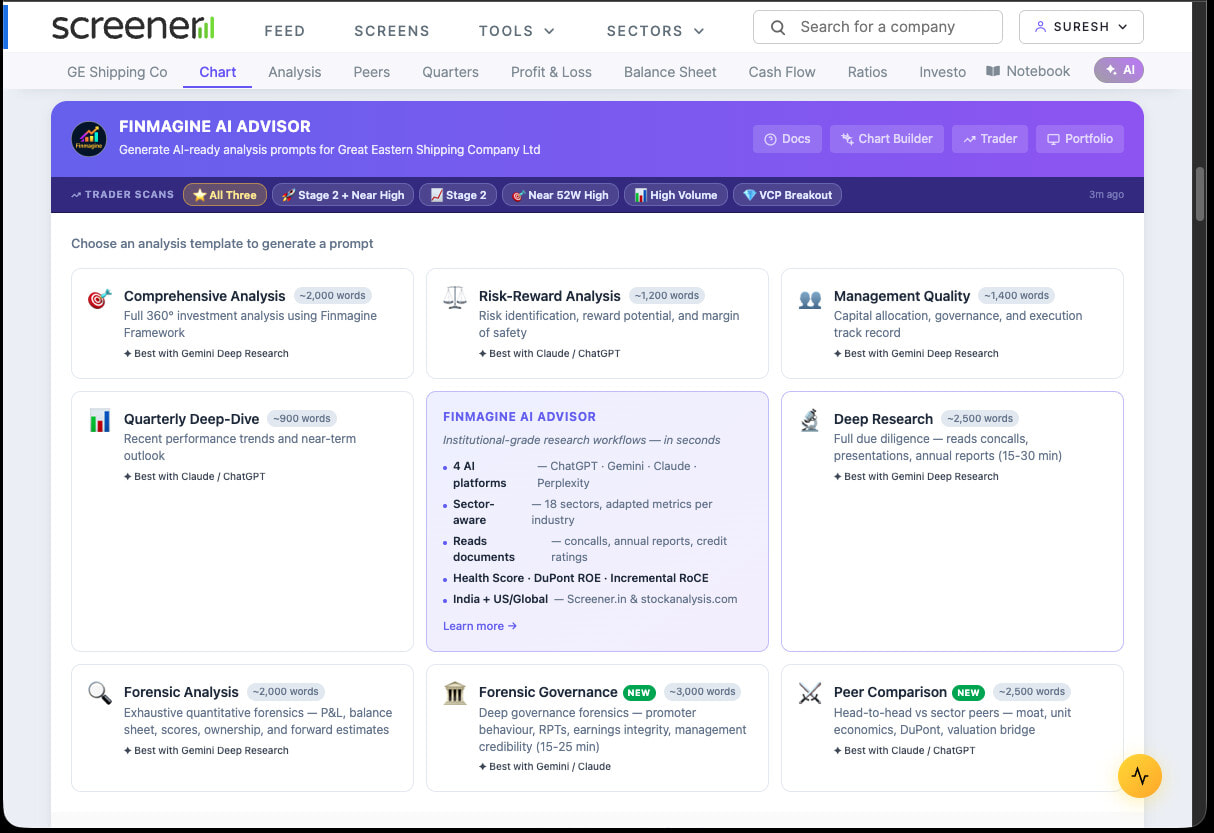
With this version, the Trader Signals Ribbon is active on Screener.in — the AI Advisor picks it up automatically and shows which scans your current stock appears in (Stage 2, Near 52W High, VCP Breakout, etc.) right above the
template selector. No configuration needed. If you have both extensions installed, it just works.

The v1.6.0 release also adds background auto-refresh — Trader now fetches scan data every 6 hours in the background even when the popup is closed, so the signals are ready from the moment you open Screener.

On the small “Visualize with Finmagine” icon/button:
That’s the new float button in Chart Builder v2.9.0 — a compact 44×44px circle that expands on hover to show the full label. That version is currently pending CWS review. Should be live within a few days.

1 Like

Finmagine Trader v1.6.0 — Scanner + Analyst Integration

v1.6.0 is live. One headline feature and one quality-of-life improvement.


:bar_chart: Trader Signals Ribbon in AI Advisor

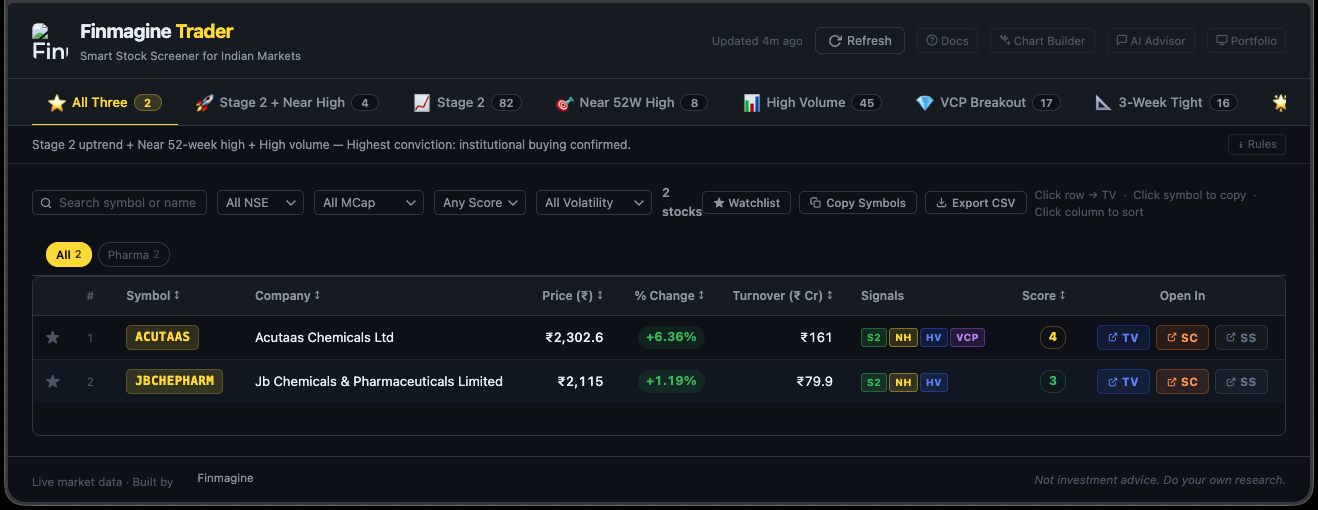
If you have both Finmagine Trader and Finmagine AI Advisor installed, a signals bar now appears in the AI Advisor panel on every Screener.in page. It shows which of Trader’s 8 scans the current stock qualifies for:

  • :star: All Three (Stage 2 + Near 52W High + High Volume)
  • 🚀 Stage 2 + Near Pivot
  • :chart_increasing: Stage 2
  • :bullseye: Near 52W High
  • :bar_chart: High Volume
  • :gem_stone: VCP Breakout
  • :glowing_star: IPO Breakout
  • :triangular_ruler: 3-Week Tight

The idea: before you send a stock to AI for fundamental analysis, you can immediately see its momentum setup. A stock that’s Stage 2 + Near Pivot + VCP Breakout gets a very different AI prompt conversation than one with no scan hits.

This works via a DOM bridge — Trader writes scan results as a data attribute on the page, AI Advisor reads it. No data leaves your browser.


:stopwatch: Background Auto-Refresh Every 6 Hours
Previously, Trader only fetched scan data when you opened the popup. The signals bar in AI Advisor would show nothing until you manually opened Trader once.

Now Trader runs a background service worker fetch every 6 hours. Scan data is always fresh. The signals bar works from the moment you install both extensions — nothing to configure.


@karanshah137 — this directly answers your question from earlier today. The signals bar is live with this release.

Full write-up with setup screenshots: Your Scanner Meets Your Analyst: Trader v1.6.0 & the AI Advisor Signals Bar | Finmagine

Install Finmagine Trader: https://chromewebstore.google.com/detail/finmagine-trader/ndkonkooaokgngjhjjefnnkdbmhgekkf

Landing page (all tutorials linked): Finmagine Trader - Free Chrome Extension for Indian Stock Momentum Scanning

1 Like

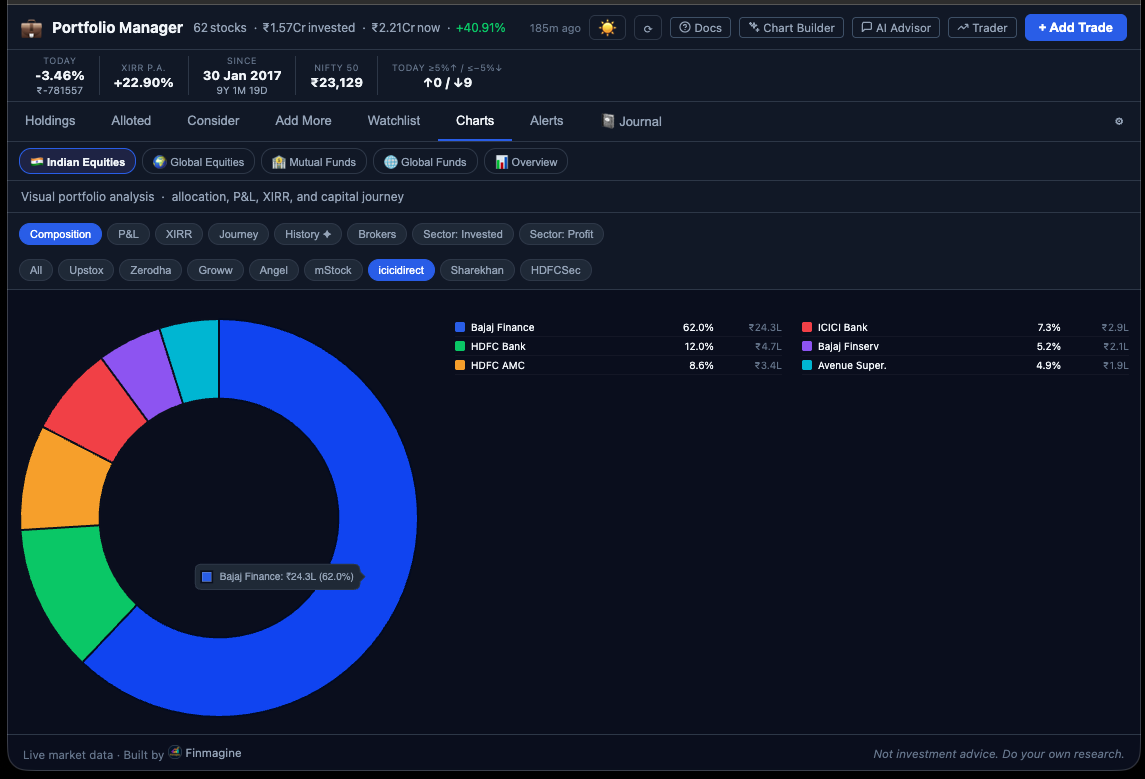
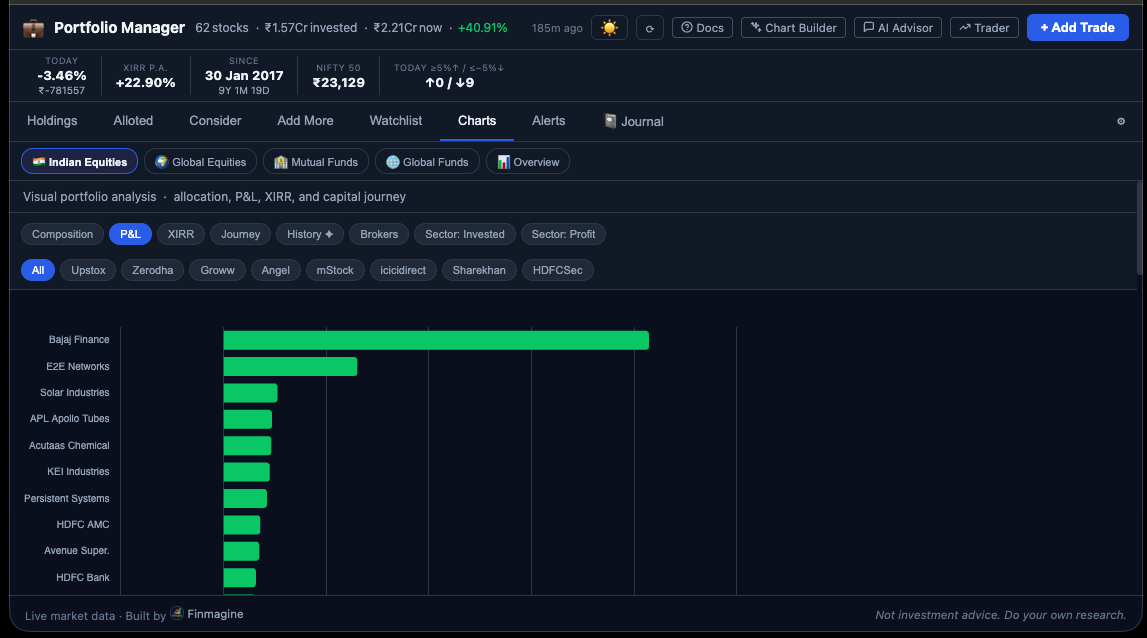
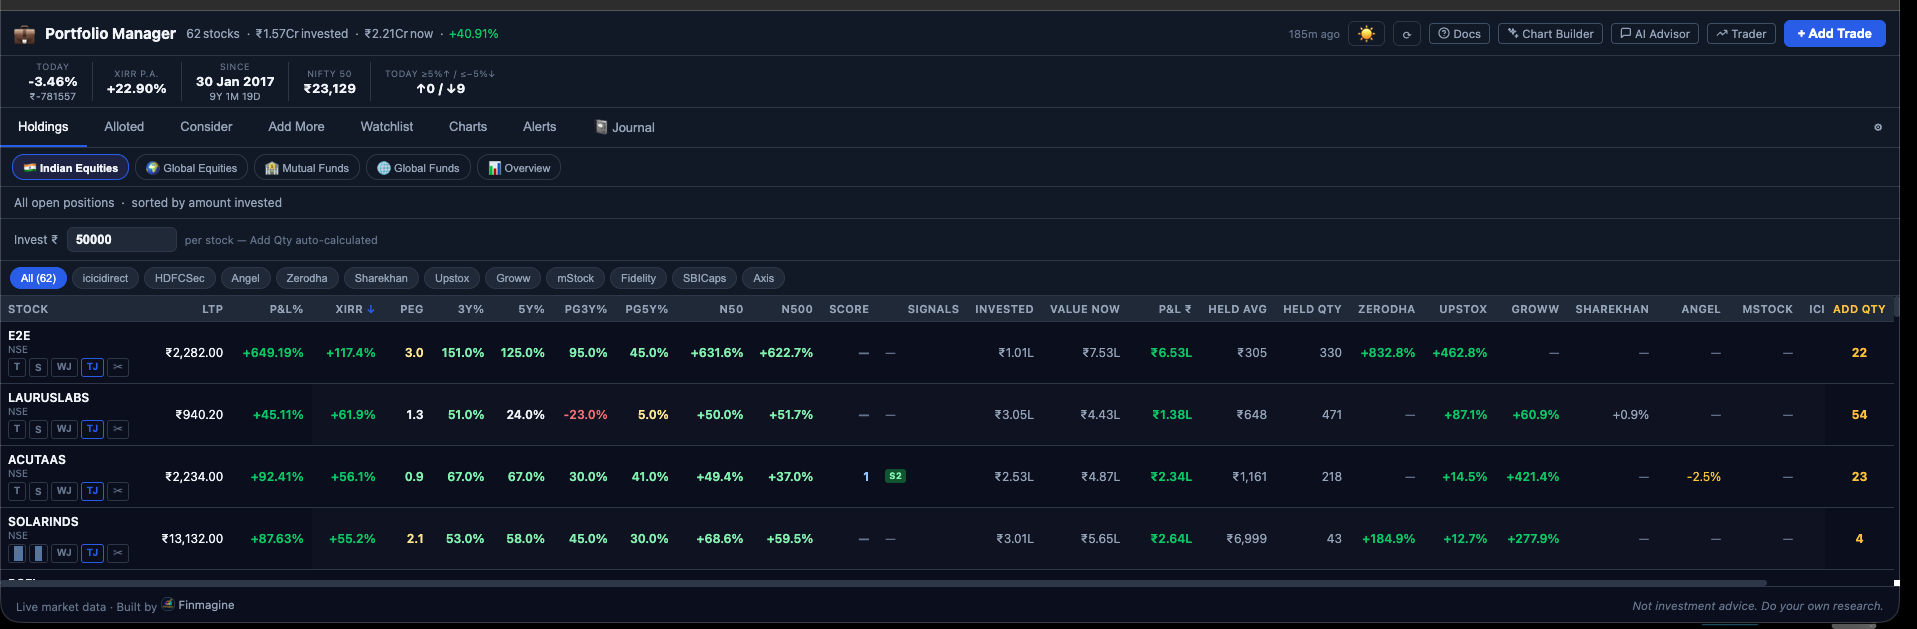
Introducing Finmagine Portfolio Manager — a free Chrome Extension for serious retail investors

Hi VP community,

I’ve been quietly building a portfolio tracking extension that goes beyond the usual “total P&L” dashboards. Sharing it here for the first time.

The problem it solves: Most portfolio trackers show you blended returns — which hide underperformers. You need XIRR per stock, per broker, per asset class to know what’s actually working.

What it does:

Holdings & Returns

  • Works with any broker — enter your holdings manually (stock, qty, buy price, date). 9 popular broker charge profiles built in (Zerodha, Upstox, Groww, Sharekhan, Angel, mStock, ICICIDirect,
    HDFC Sec, INDMoney) so brokerage costs are factored into your P&L automatically
  • True XIRR per holding (time-weighted, accounts for partial sells and DCA)
  • Index Beat: compares your XIRR vs Nifty 50 (India) / S&P 500 (US) on the same capital deployed
  • Split/Bonus corporate action adjustments

Watchlist as a Research Dashboard

  • 25 columns: LTP, Finmagine Score, PEG, 3Y/5Y CAGR (price + profit), Nifty 50/500 inclusion, Trader Signals, Sector
  • Pulls live data from Screener.in + ChartInk automatically when you open a stock page
  • Works alongside Finmagine Chart Builder (fundamentals) and Finmagine Trader (momentum signals) — all three share data

Decision Journal

  • Log why you bought each stock at time of purchase
  • 7 thesis categories (Earnings Acceleration, Quality Compounder, Turnaround, Sector Tailwind, etc.)
  • Pattern analysis — see which thesis types are actually working for you over time
  • Watchlist journal for pre-buy thesis documentation

Other features

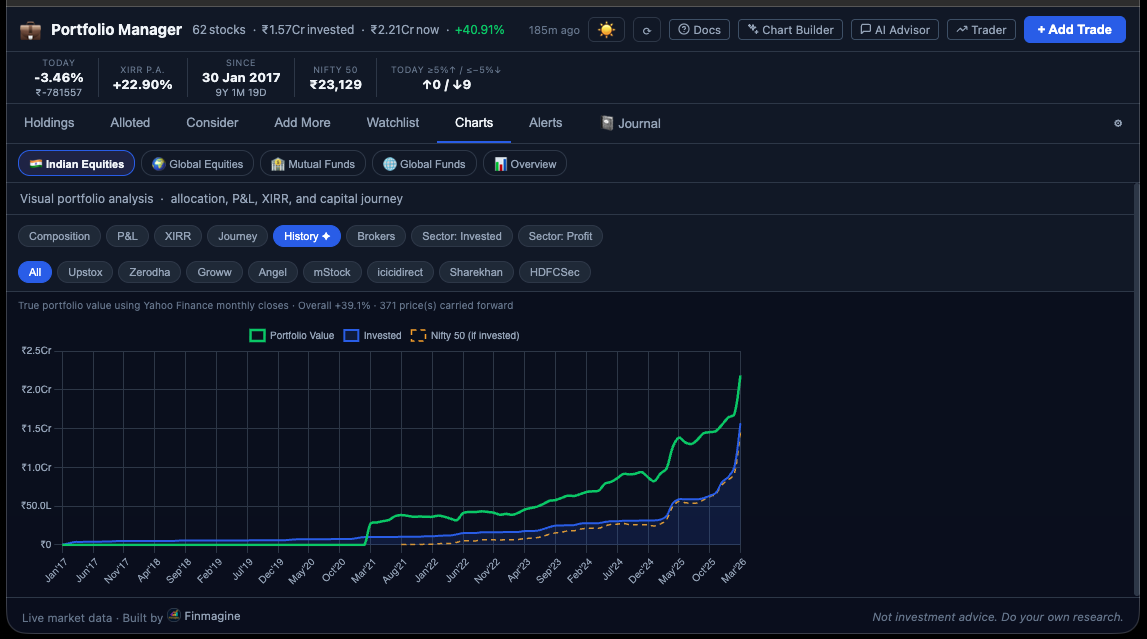
  • 13 chart types including true portfolio value history vs index benchmark
  • Multi-asset: Indian Equity, Indian MF, US Stocks, Global ETFs
  • Dark/Light theme, cloud sync across devices

Install (Chrome — free):
https://chromewebstore.google.com/detail/finmagine-portfolio-manag/ifmhlfbapokfkhohdghjgdmpbekdbipp

Landing page:
Finmagine Portfolio Manager - Free Chrome Extension for Multi-Broker Portfolio Tracking

8-part tutorial series:

  1. Introducing Finmagine Portfolio Manager: Stop the Blended Average Trap | Finmagine — Stop the Blended Average Trap
  2. Per-Broker Stop-Loss: The Portfolio Discipline Most Investors Skip | Finmagine Portfolio Manager — Per-Broker Stop-Loss
  3. XIRR & Index Beat: Are You Really Beating the Market? | Finmagine Portfolio Manager — XIRR & Index Beat
  4. The Portfolio Charts Playbook: 12 Chart Types Explained | Finmagine Portfolio Manager — All 13 Chart Types
  5. Watchlist as a Research Dashboard: 25-Column Fundamental Comparison | Finmagine Portfolio Manager — 25-Column Watchlist
  6. Multi-Asset Tracking: Indian MF, US Stocks & Global ETFs in One Dashboard | Finmagine Portfolio Manager — Multi-Asset Tracking
  7. The Decision Journal: Why Did You Buy This Stock? | Finmagine Portfolio Manager — The Decision Journal
  8. Portfolio Manager v1.1.0: History Chart, Corporate Actions, Dark Mode & More | Finmagine — v1.1.0 Update

Happy to answer questions here. Feedback welcome — especially on what ratio/metric you’d most want added to the Watchlist tab.


Excellent Yet Again, One Request. Yet again :grinning_face_with_smiling_eyes:

Can we add a mutual fund simulation tool in here that takes paper trades and calculates how our fund performed and how the profit gets reallocated and our NAV or PF value Keeps increasing or decreasing, taking into account each stock’s buy and sell value and all stuff. We can have the option to rebalance it just like a small case and see how did we performed vs. benchmark indices had we built that portfolio in real

@karanshah137 — thank you, and great timing on this request!

You’ll be happy to know the groundwork is already built. The History ✦ chart in the Charts tab already tracks your portfolio’s true value month by month and benchmarks it vs a Nifty 50 DCA —
same cash, same dates. So the “how did I perform vs the index” question is already answered.

What you’re asking for on top of that — NAV normalization (index your portfolio to ₹1,000 at inception, track it like a fund’s NAV) and rebalancing simulation (set target weights like a Smallcase, see what quarterly rebalancing would have done vs buy-and-hold) — is genuinely the right next step and I’ve noted it for v1.3.0.

Paper trades (what-if positions without real cost basis) is a bigger scope shift — that’s essentially a separate simulator — so I’ll hold that for later rather than dilute the core tracker.

For reference:

Keep the feedback coming — this community has shaped every version so far.

1 Like

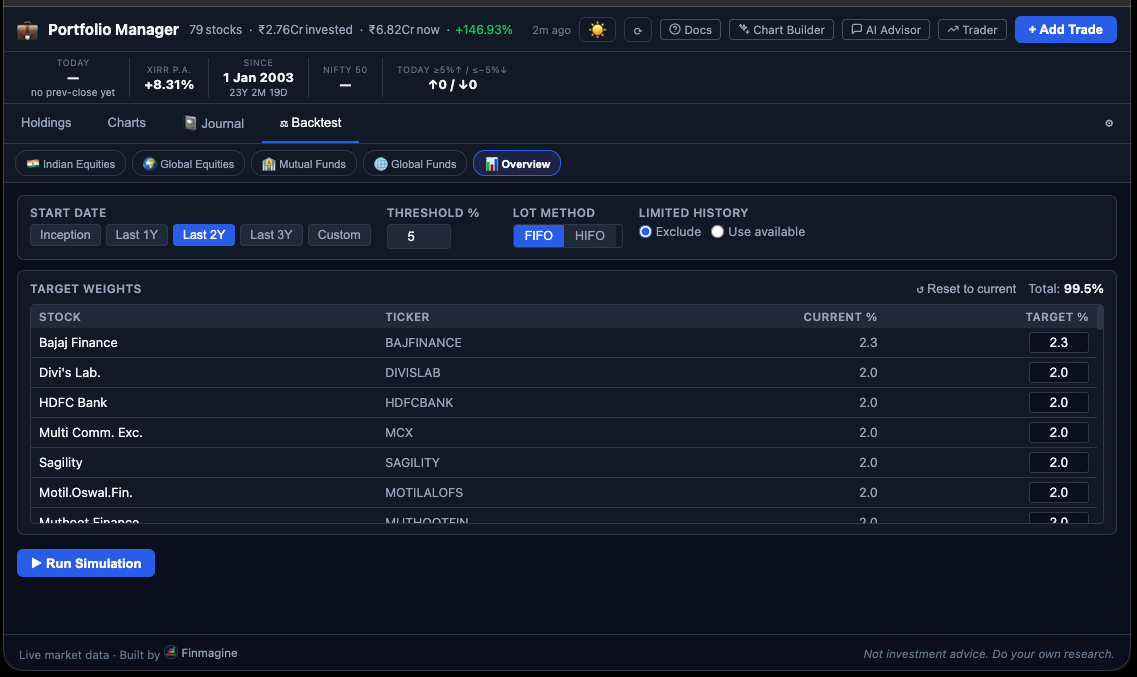
Quick update on the Backtest / Rebalancing Simulator:

The feature is live now on the Finmagine Portfolio Manager WebApp — you don’t need to wait for a Chrome extension update to try it.

Head to Sign In - Finmagine → sign in → click the :balance_scale: Backtest tab.

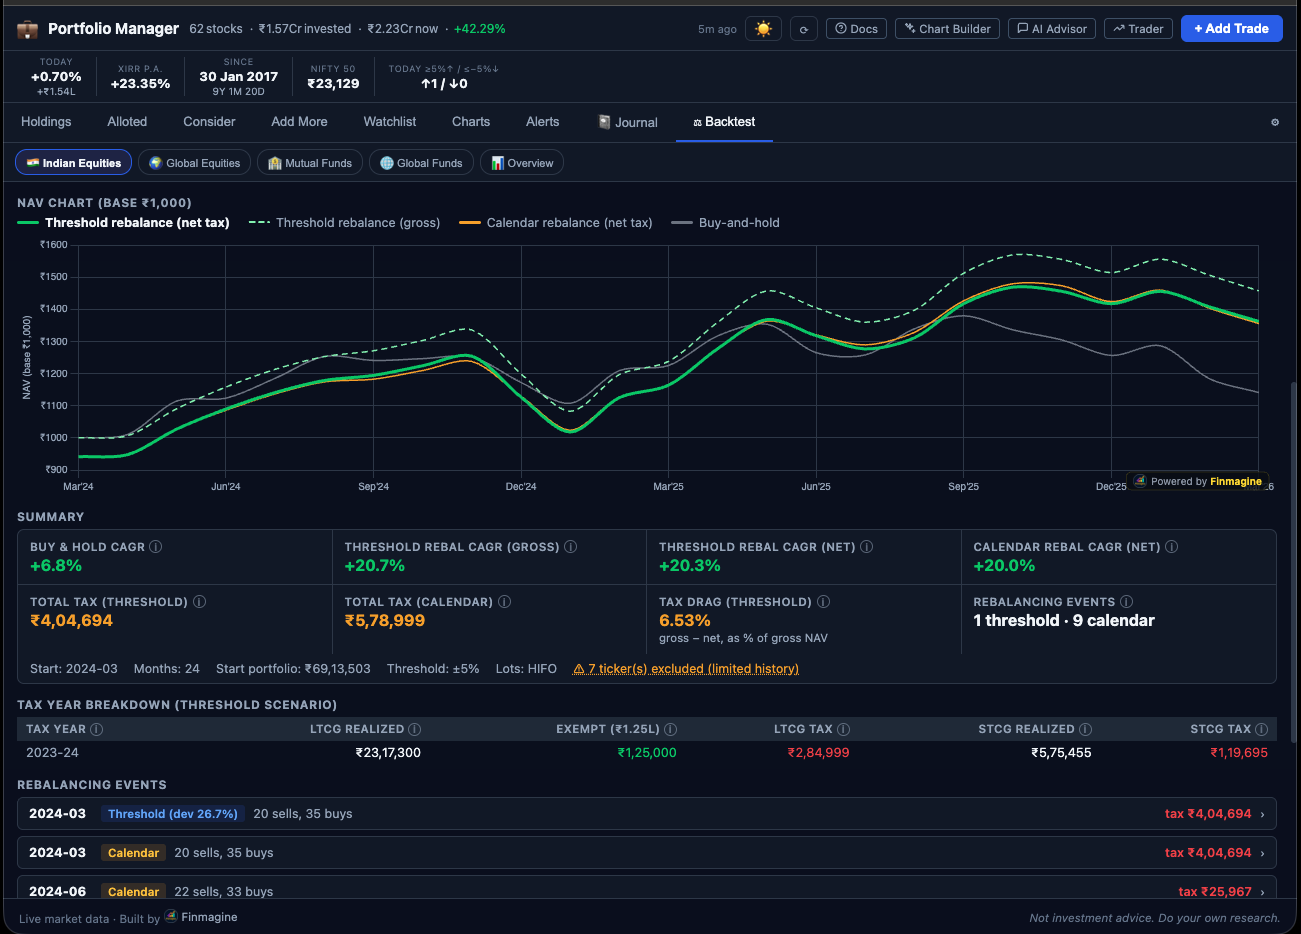
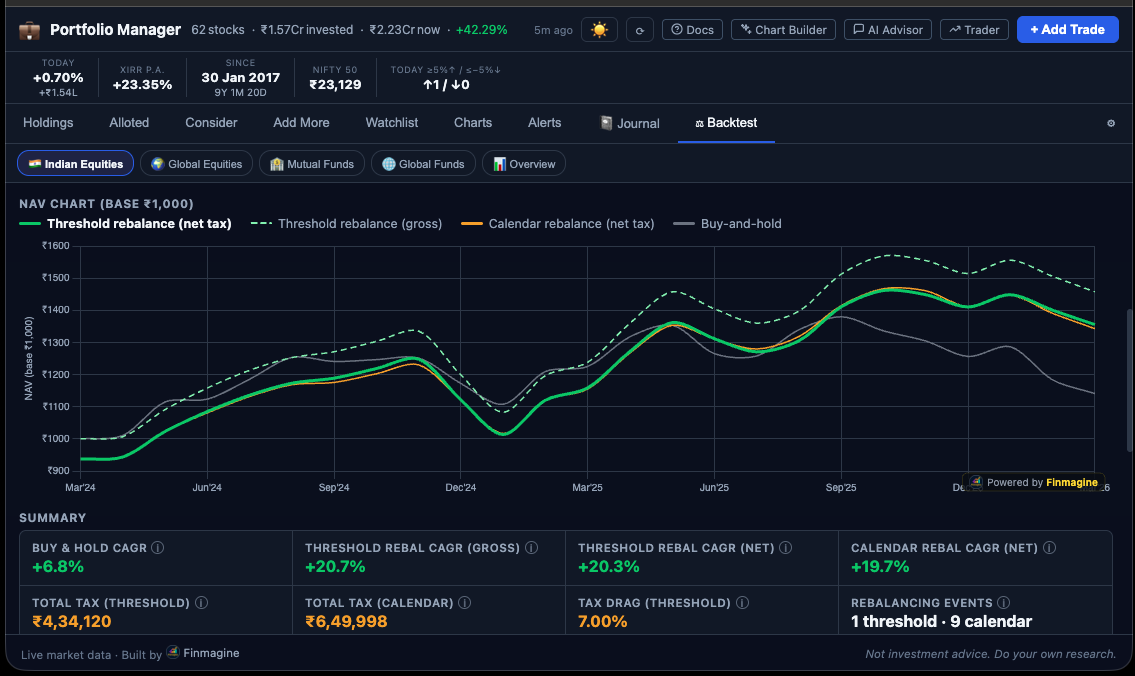
What it does in one line: Runs your actual trades through 4 parallel scenarios — Buy & Hold, Threshold Rebalance (gross & net of tax), and Calendar Rebalance (net) — and plots them as a NAV
chart starting at ₹1,000.

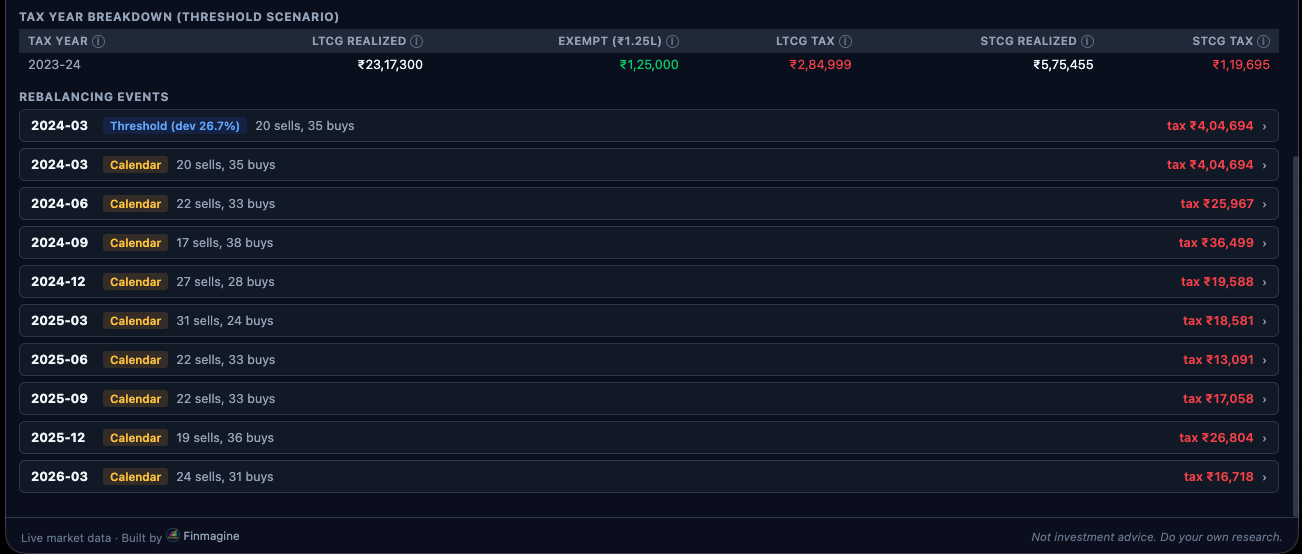
Under the hood it’s fully tax-aware (LTCG 13% / STCG 20.8% / ₹1.25L annual exemption), supports FIFO and HIFO lot selection, and shows a per-year tax breakdown plus a full rebalancing event
log. No dummy data — it runs on your real portfolio.

The Chrome extension version (v1.3.0) is coming soon — we have a submission in review right now so the pipeline opens up once that clears.

Full walkthrough here: Backtest Your Rebalancing Strategy: Does Discipline Beat Inertia? | Finmagine Portfolio Manager

And if you haven’t tried the extension yet: Finmagine Portfolio Manager - Free Chrome Extension for Multi-Broker Portfolio Tracking


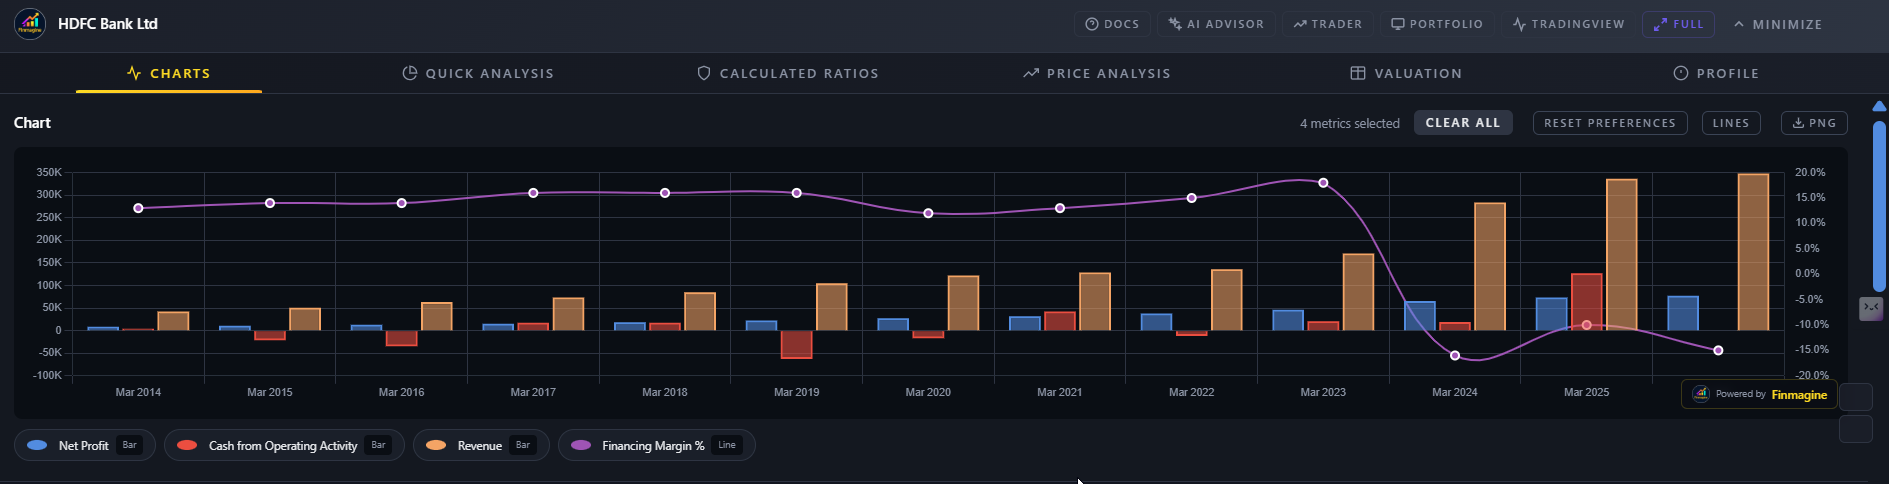
On downloading the PNG image of the graph. The TTM column is gets hidden.. ALSO THE Downloaded png does not show the legend/ index (the colour coding of the columns)

@Jay_Shukla — thanks for the detailed screenshots, very helpful!

Two separate things going on:

  1. Legend missing from PNG export — confirmed bug. The chart legend isn’t being drawn onto the exported image. Fix is ready and will ship with the next release.

  2. TTM CFO bar missing for HDFC Bank — this is actually a Screener.in data gap, not a chart bug. If you check HDFC Bank’s Cash Flow table on Screener.in directly, the TTM cell for “Cash from
    Operating Activity” is blank — Screener doesn’t publish a TTM CFO figure for HDFC Bank. Since there’s no value to plot, the bar simply doesn’t appear at the TTM position. Revenue, Net Profit,
    and Financing Margin % all have TTM values on Screener, so those bars show up correctly.

So to summarize: the only actual bug is the missing legend in the PNG export. Everything else is working as intended — the chart plots exactly what Screener.in provides.

Feature Request:

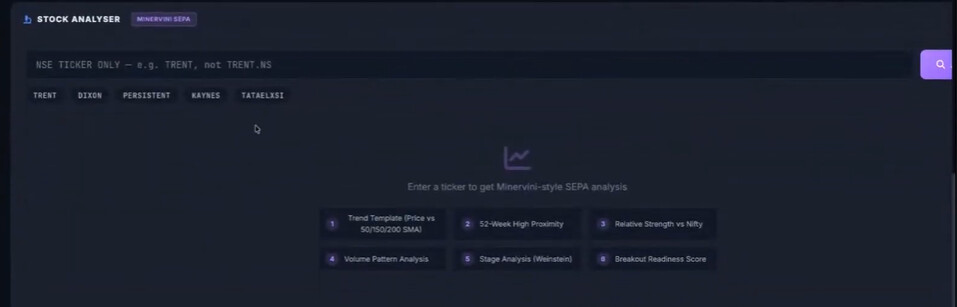
I came across the (attached image) Dashboard, recently. It Would be Great if we add this to Finmagine Chart Builder or Finamagine Trader.

What this covers is when I input a stock ticker and it outputs Minervini-style technical + trend analysis with scoring.

First is Trend Template Check (Minervini)

  • Conditions:
    • Price > 50 DMA > 150 DMA > 200 DMA
    • 200 DMA trending up (last 1 month)
    • Price > 1.3 × 52-week low
    • Price within 15% of 52-week high
    • Relative Strength (vs Nifty)

Output:
In Trend Template / Not in Template"

Second is Compare stocks vs Nifty over time: (Available in Chartink so would be easy)

  • 3 months
  • 6 months
  • 12 months

Output: Outperform / Underperform over 3 / 6 / 12 Months.

Third is Stage Analysis (Weinstein)

  • Stage 1: Base
  • Stage 2: Uptrend
  • Stage 3: Top
  • Stage 4: Downtrend

Based on:

  • 30-week MA slope
  • Price position vs MA

And then Combining all three of the output, we get

Breakout Readiness Score (IMPORTANT)

Combine:

  • Trend template (25%)
  • RS (25%)
  • Proximity to highs (25%)
  • Stage (20%)

:backhand_index_pointing_right: Final Output:

  • Score out of 100
  • Tag:
    • 80+ → “High Potential”
    • 60–80 → “Watchlist”
    • <60 → “Avoid”

We can also use this score just like we have in Finmagine Trader naming this SEPA Score

@karanshah137 — we built it because you asked! Your suggestion went up and we coded it up the same day. Here’s what’s ready in v1.8.0:

:white_check_mark: Trend Template column — a new TT column in every scan tab showing a green TT✓ badge when all 7 Minervini criteria pass simultaneously: Close > SMA50 > SMA150 > SMA200, SMA200 rising over 20
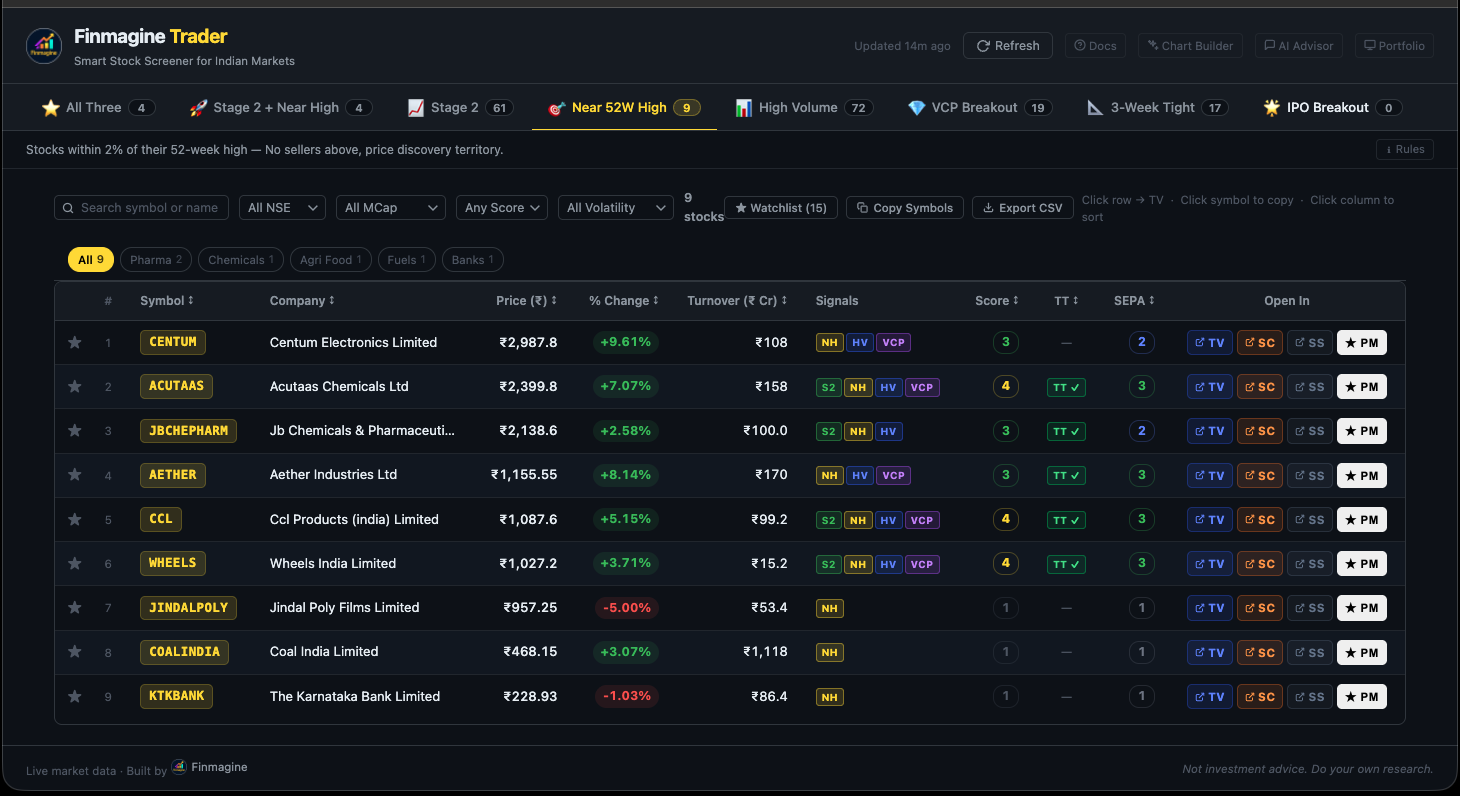
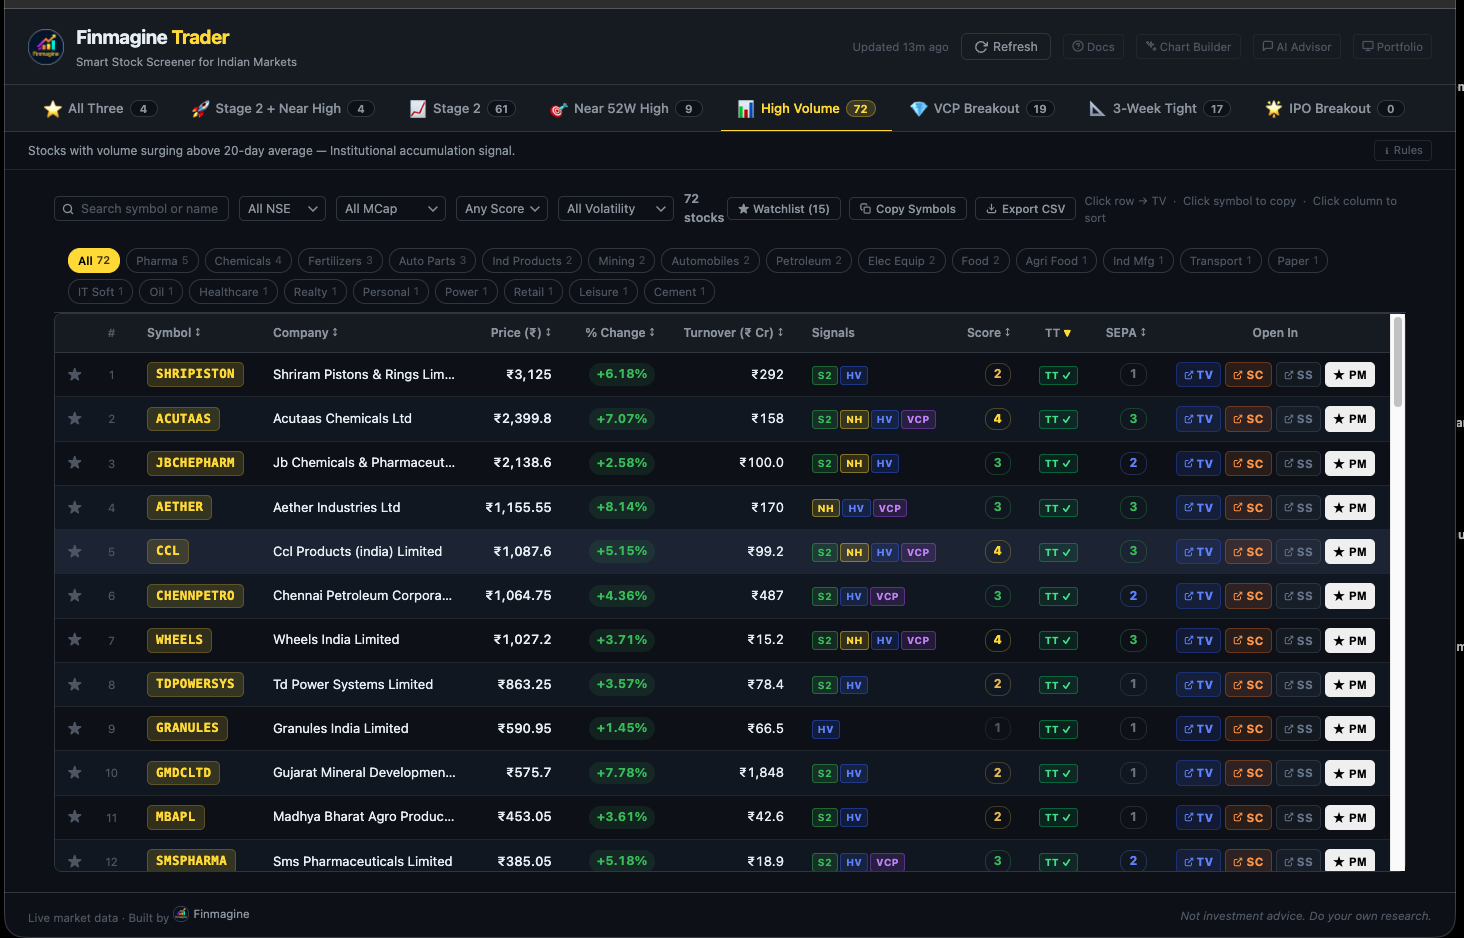
days, price ≥30% above 52W low, and price within 25% of 52W high. Sortable.

One bonus it surfaces: quality stocks that pass all 7 Minervini criteria but fail Stage 2’s liquidity filter — structurally sound small/mid-caps Stage 2 never shows. AETHER Industries is a
recurring example.

The code is done and tested — we’re just waiting on the Chrome Web Store review queue before we can submit. Could be a couple of weeks before it’s live in the store, but it’s coming.

Relative Strength vs Nifty is next — agree that’s the missing piece.

Full write-up: The Minervini Trend Template: 7-Criteria Structure Quality Check for NSE Stocks | Finmagine Trader

Extension landing page: Finmagine Trader - Free Chrome Extension for Indian Stock Momentum Scanning


2 Likes

@karanshah137 — your feature request directly inspired v1.9.0 of Finmagine Trader, which implements everything you described and more:

:white_check_mark: Minervini Trend Template — all 7 criteria checked simultaneously (Price > SMA50 > SMA150 > SMA200, SMA200 rising, 30%+ above 52W low, within 25% of 52W high)

:white_check_mark: Relative Strength vs Nifty 50 — 3M / 6M / 12M comparison, shown as ↑/↓ arrows per period

:white_check_mark: Weinstein Stage 1–4 — classified via ChartInk scans, colour-coded badge per stock

:white_check_mark: Breakout Readiness Score (BRS) — 0–100 composite: TT(25) + RS(25) + Proximity(20) + Stage(20) + Setup Quality(10), with a dedicated BRS tab that ranks all scanned stocks

The tag system ended up as 5 tiers: :fire: Elite Breakout (95+) · Breakout Ready (85–94) · Setup Forming (70–84) · Early Stage (55–69) · Avoid (<55)
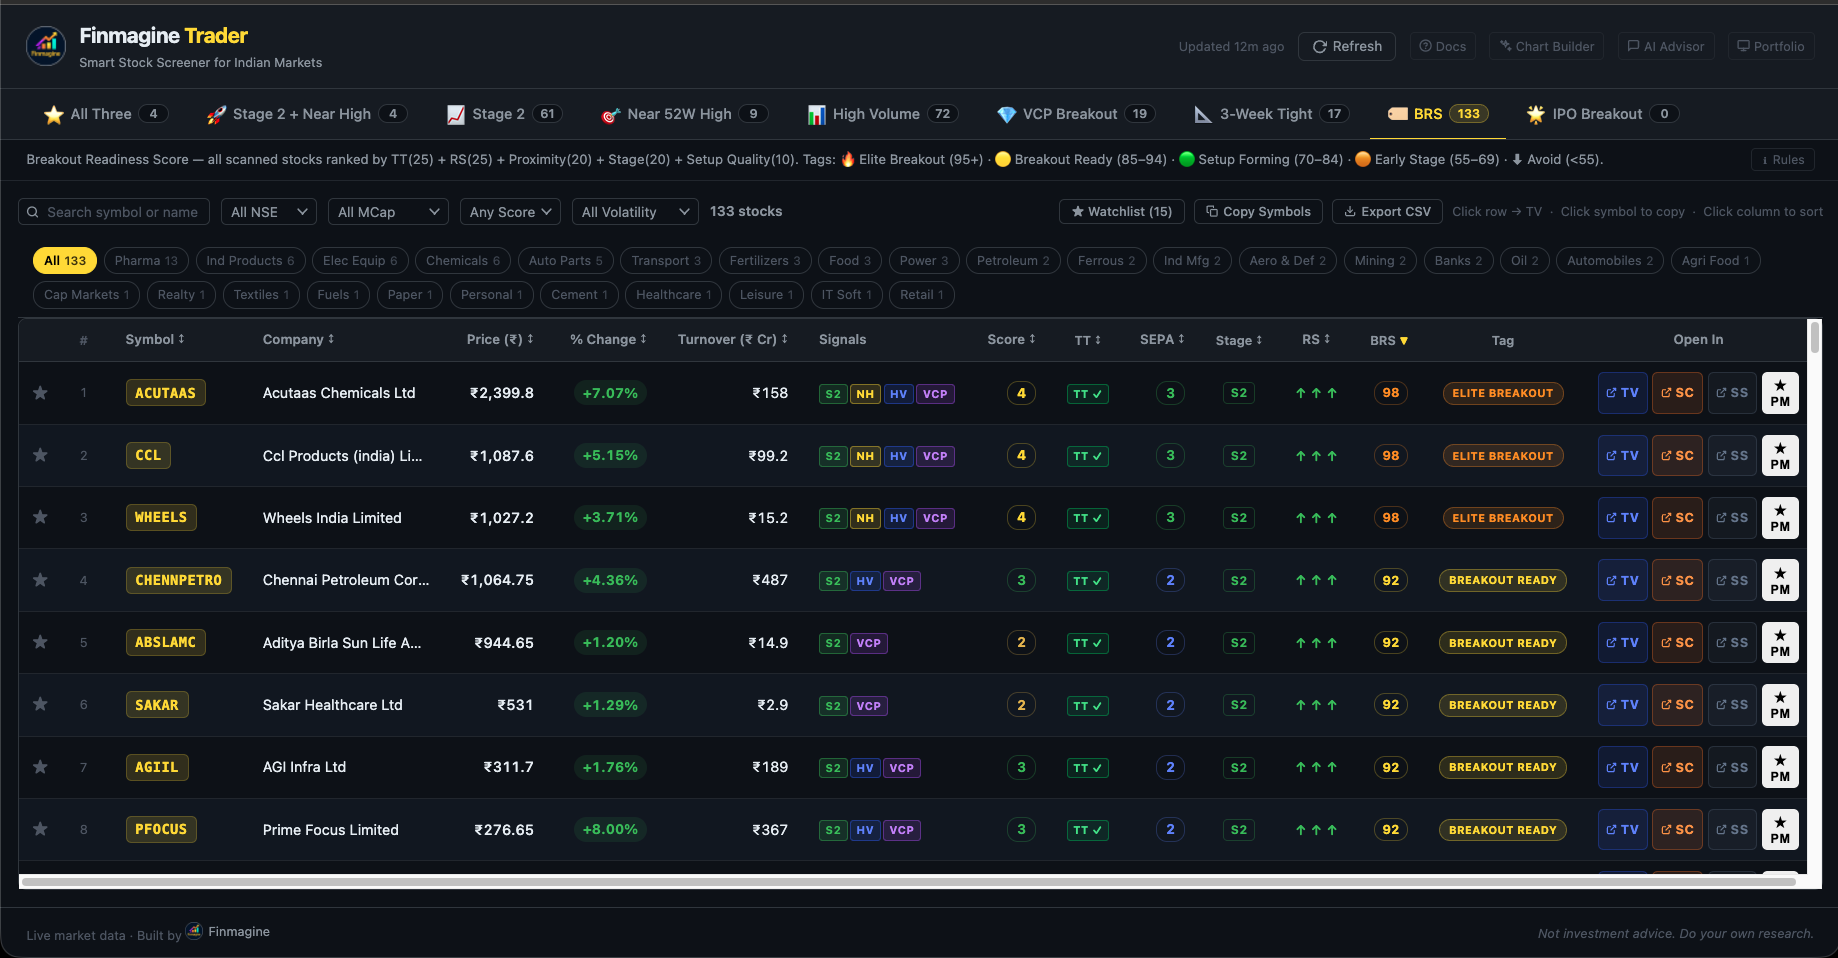
Full methodology with worked examples: The Breakout Readiness Score: From Scanner to Decision Engine | Finmagine Trader

v1.9.0 is built and pending CWS review queue. Will update here once live.

Finmagine Trader: Finmagine Trader - Free Chrome Extension for Indian Stock Momentum Scanning

5 Likes

Excellent Thank you, this is killer. Waiting for v1.9.0 of Finmagine Trader to go live

hello sir can you make scanner for stocks that declined 60–70% from their peak then recovered 20–30%, formed a bullish flag pattern and consolidating around the 50-day EMA.

Hi @gaurav_aggarwal1 — great setup idea. The 52W high/low and EMA proximity criteria are technically doable in ChartInk, but the flag pattern itself can’t be reliably automated — any scan
would surface candidates that need visual confirmation anyway.

For now, the most practical workflow using Trader:

  1. BRS tab → filter by Stage = S1 (base-building stocks, above SMA200 but below SMA50 — exactly the “post-decline consolidation near 50 EMA” phase)
  2. Cross-check those against stocks that are significantly off their highs visually on the chart
  3. Enter only when the stock breaks above SMA50 with volume (Stage 2 confirmation)

The “All Three” and “Stage 2 + Near High” tabs will catch these stocks after the breakout happens — which is arguably the safer entry anyway.

3 Likes