We’re keeping a watch on this but as per EW ,we are not getting clear wave counts.
It may go up but it does not fit our criteria of technical anaysis as of now.
Our view may change if the chart changes.
We’re keeping a watch on this but as per EW ,we are not getting clear wave counts.
It may go up but it does not fit our criteria of technical anaysis as of now.
Our view may change if the chart changes.
Any clear EW counts visible in the second and third rung PSU banks like can bank, indian bank, BOI, JK bank, UCO bk, Union BK, IOB, etc… You can post views on whichever chart you can see clear waves. rgds.
Good call on sanghvi movers.
After the 3(1) as projected by you, would this be followed by a wave 4 down sideways/down move? Is it safe to assume that?
If not to inconvenient could you maybe roughly chart out how patterns play out after 3(1) stage.
Thank you.
Sir please have look at Praj industries getting crazy target as per channel can you check using EW. Stock is in mega theme sector of Renewable energy, Bio plastic, CBG etc…
Hello Sir,
Can you please share your chart analysis on Manappuram Finance??
Can you please share your analysis of the following names:
Holding Max India and Zomato from lower levels and unsure whether to hold or sell after the steep and fast run ups.
Thanks!
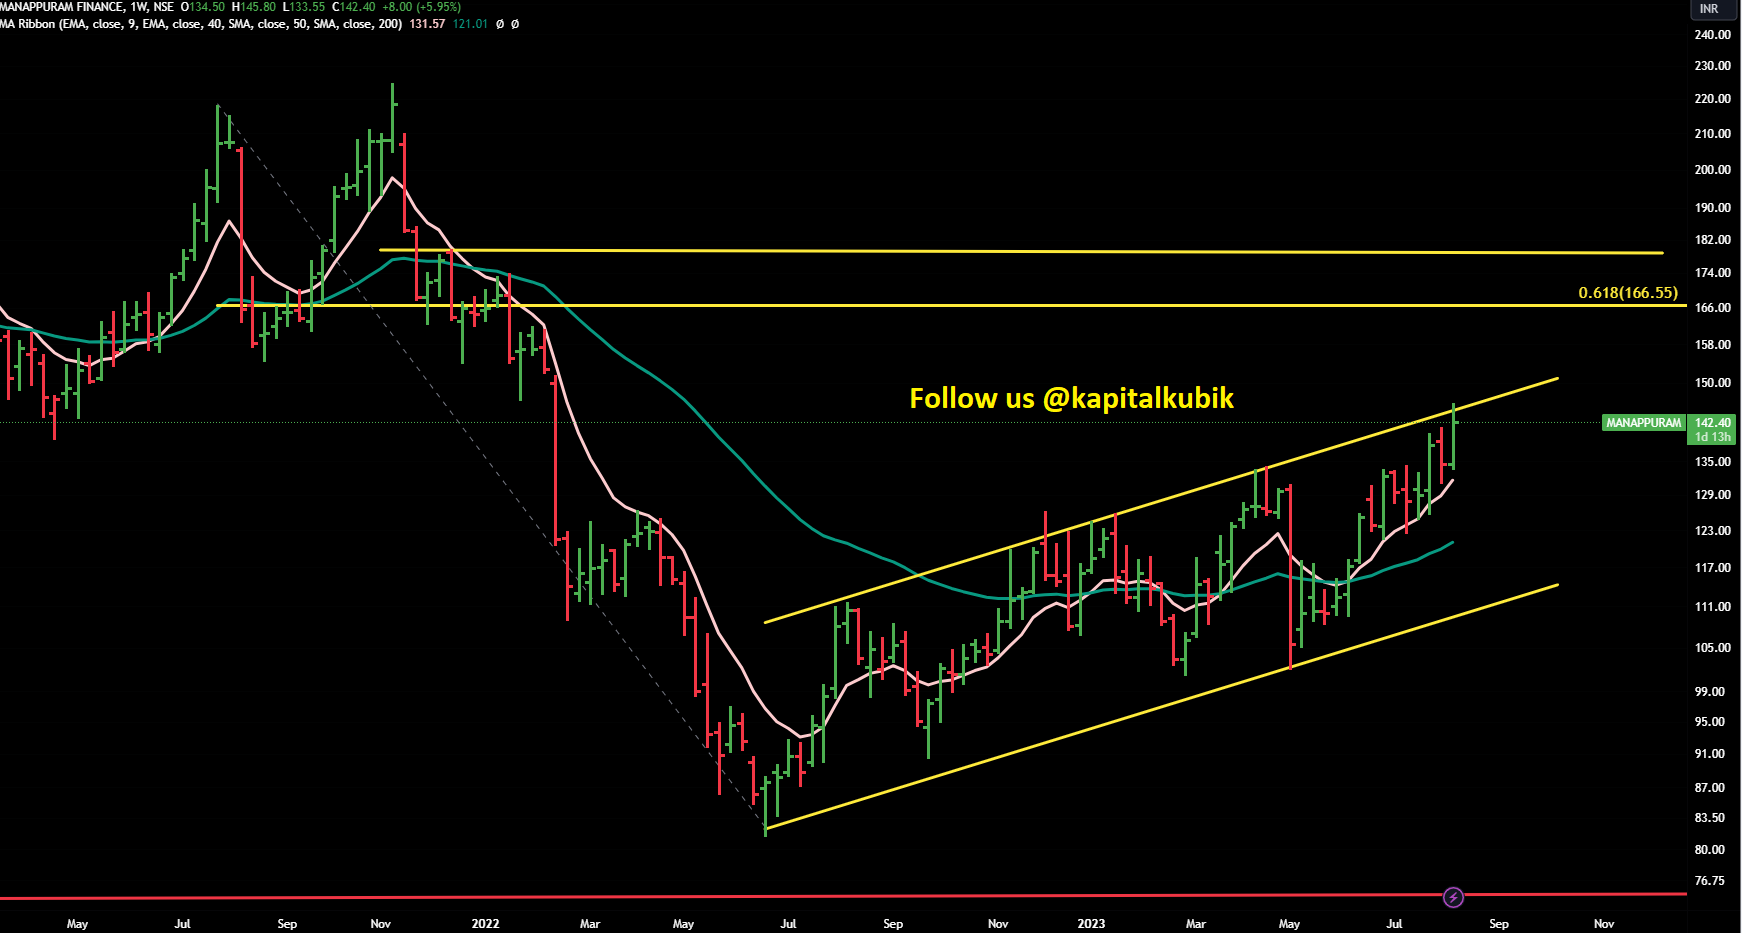
Manappuram
CMP 142
Three levels are important.
So one can go by position -sizing - initial postion after it closes and trades above the parralel channel for 1-2 weeks, additional postion once it crosses Fib level (61.8% , yellow line) and 3rd level is 179.
It has multiple 3 waves rise from the bottom of June 22 ,hence it does not give much confidence to us. Because there are lot of clean charts available in this bull run and money is limited , we tend to avoid these kind of charts.
Would be able to project the targets once the above mentiond levels are done.
Weekly Chart
If you’re a long term investor, there is no need to worry.
Somehow this company is out of our bucket of investment -options . Hence won’t look at the chart.
Please keep in consideration that we don’t give any calls. We share long term investment ideas as per EW and Stage -Analysis .
On your query, if you’re a real long term investor, then you don’t need to worry about ups and downs if the sector and the company is doing good.
zzzzzzzzzzzzzzzzzzzzzzzzzzz ![]()
![]()
![]()
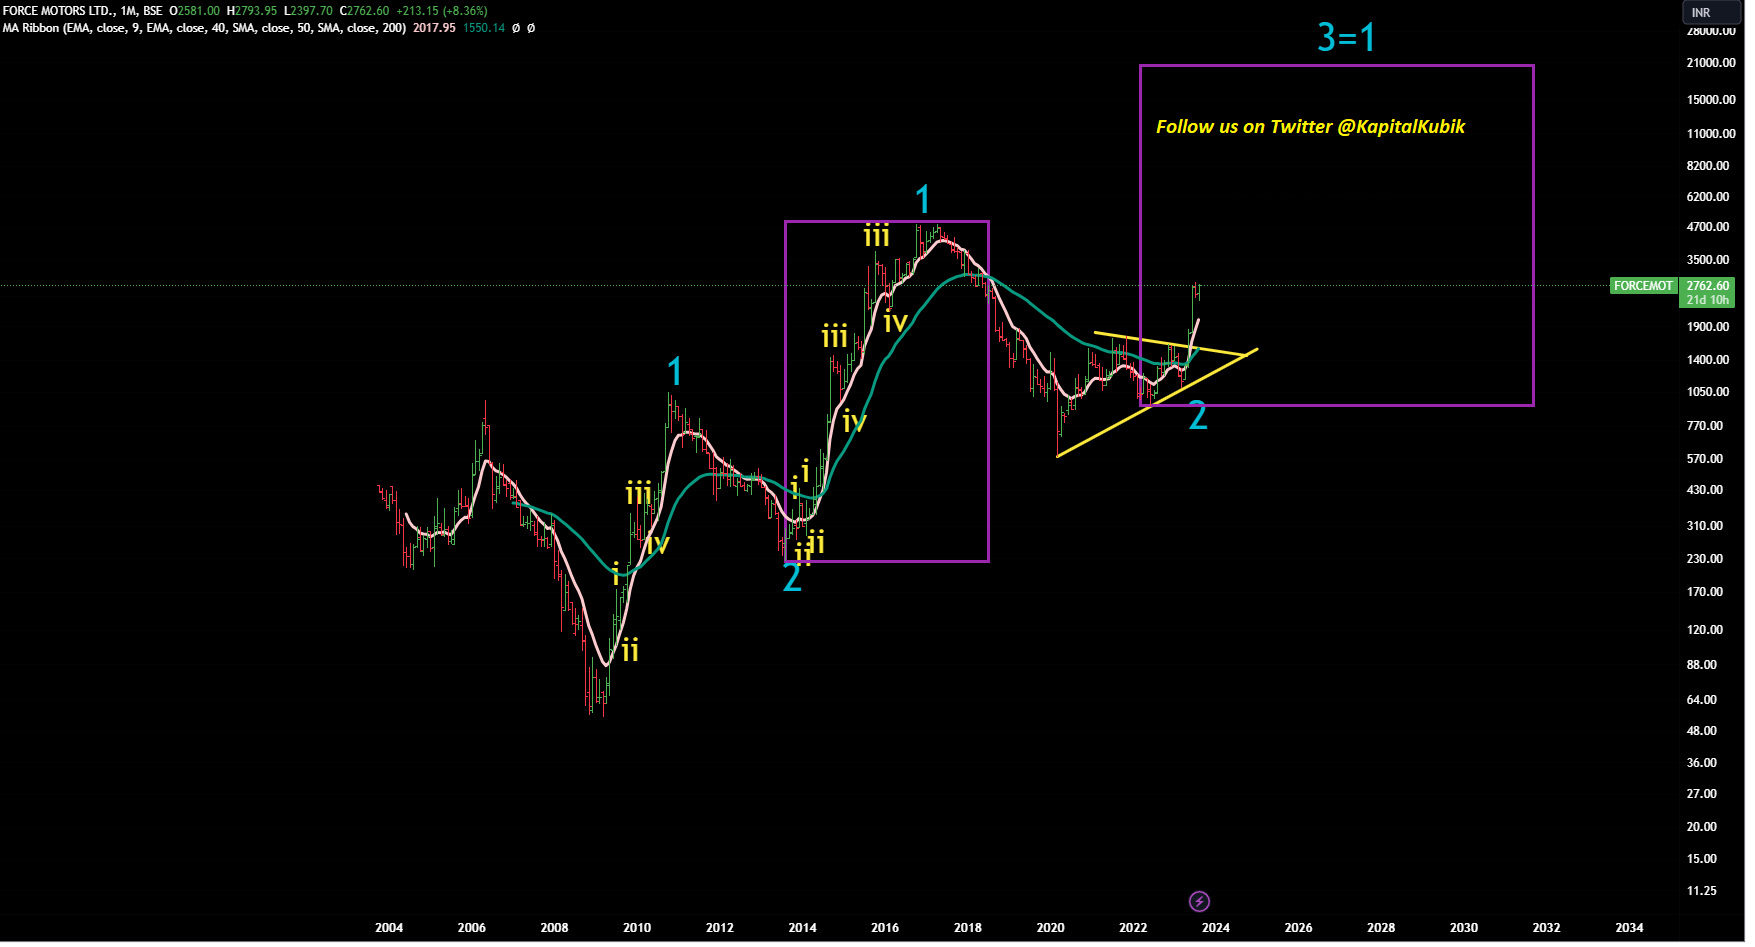
Force Motors
CMP 2762
We were waiting for Q1 results to check whther chart structure aligns with the sector and fundamentals of the company.
We have got additional confidence from yesterday’s announcement of results.
Targets/Projections as per EW look crazy …but let’s see how it pans out.
This is a monthly chart …a play and projections for next few years.
Monthly Chart
Disclaimer : This post is just for learning few methods of price-patterns. Views are personal and are purely based on our limited knowledge of charts. No buy/sell recommendations. These are probability-study methods and chances of success/failure depend upon various factors
Sir thanks for checking…it is always an honor to interact with you.
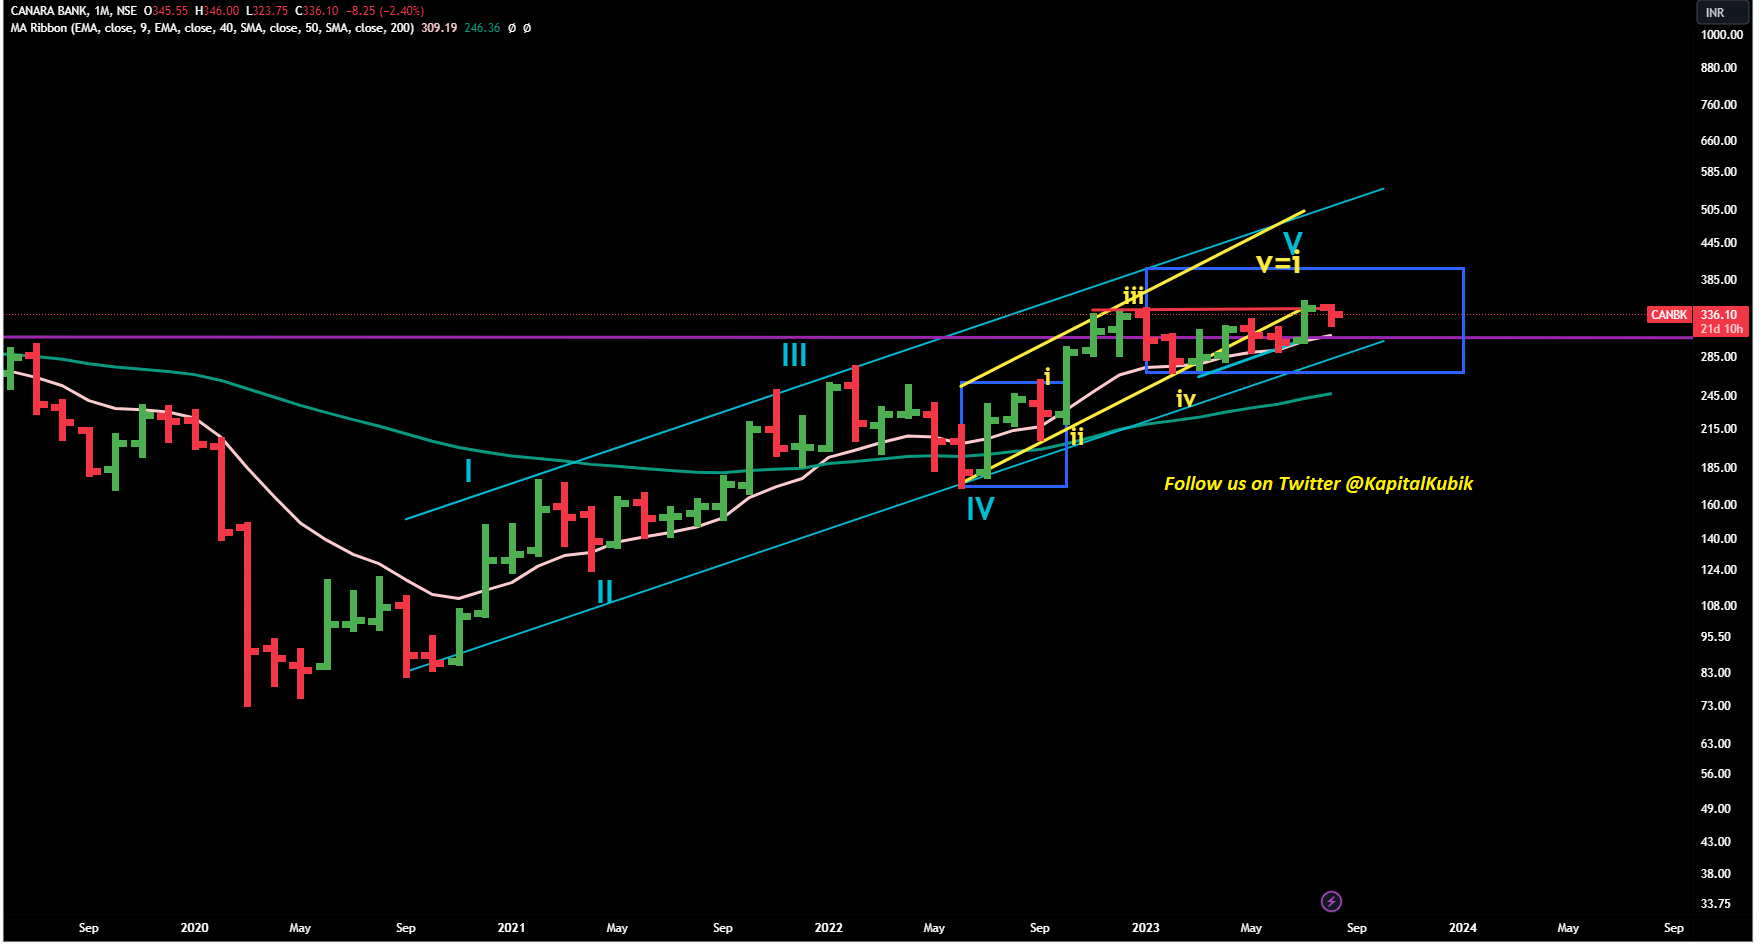
We are bullish on PSUs as well as on PSU banks .
PSU Bank Index itself looks good …and because the whole sector looks bullissh so all the stocks in the sector also good.
We can see clear EW patterns on several of PSU Banks charts .
Here are two that are in our watch-list .
Canara Bank
CMP 336
Monthly Chart
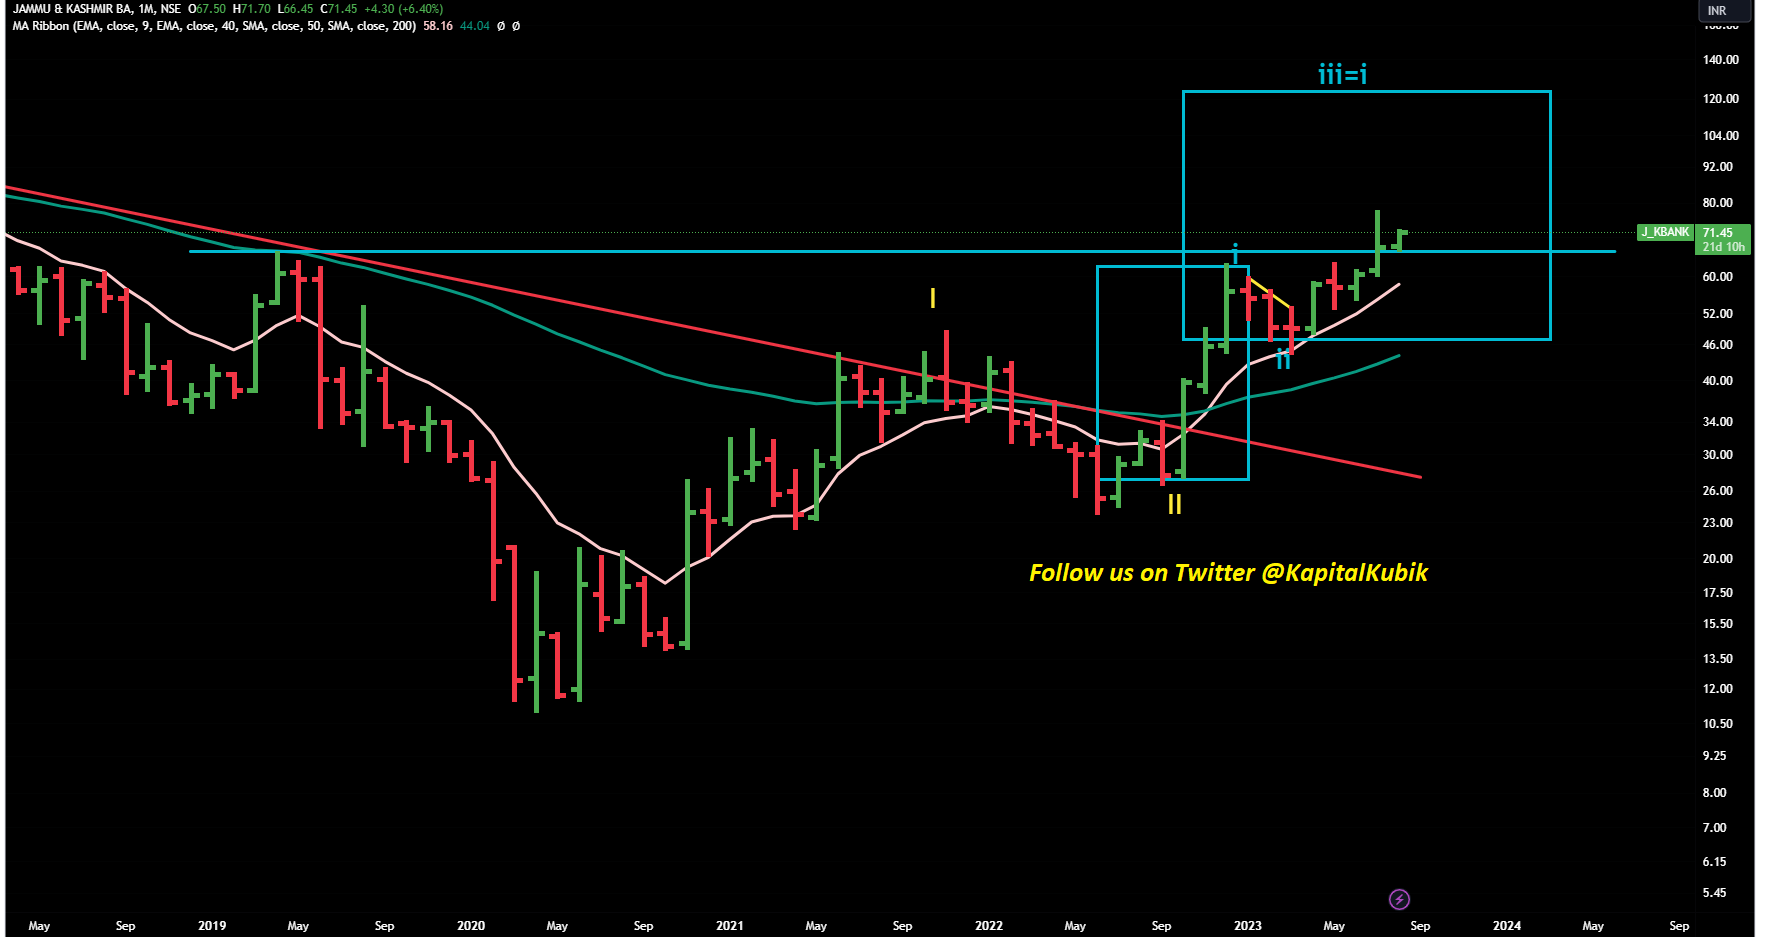
Jammu & Kashmit Bank
CMP 71
Monthly Chart
I am a long term investor who is learning technicals. Been invested in Sanghvi since 2018-19. Don’t need any targets from you. I’ve seen all the ups and downs.
Like i mentioned in the post, wanted to know how the charts generally proceed after stage 3(1). Didn’t mention anything about providing targets.
Anyways, Thank you for you reply.
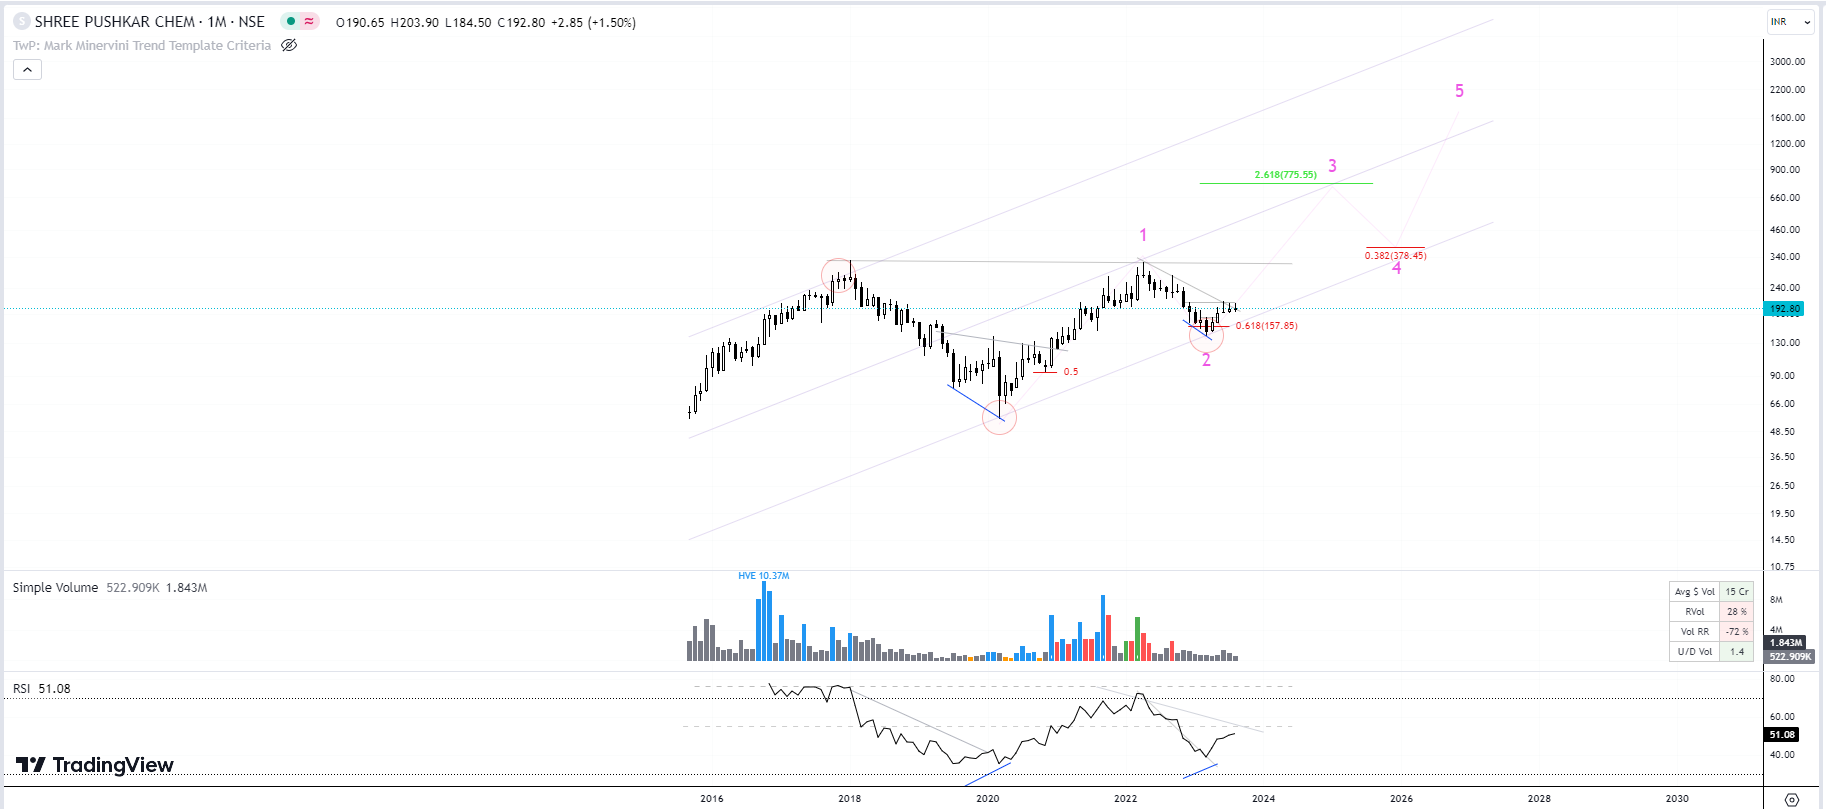
You might want to consider looking at the chart of Shree Pushkar. Below is how i am reading it. I may be wrong:
Thanks for your suggestion. We don’t have any money left to invest as of now - just keeping some for the auto chart posted today ![]()
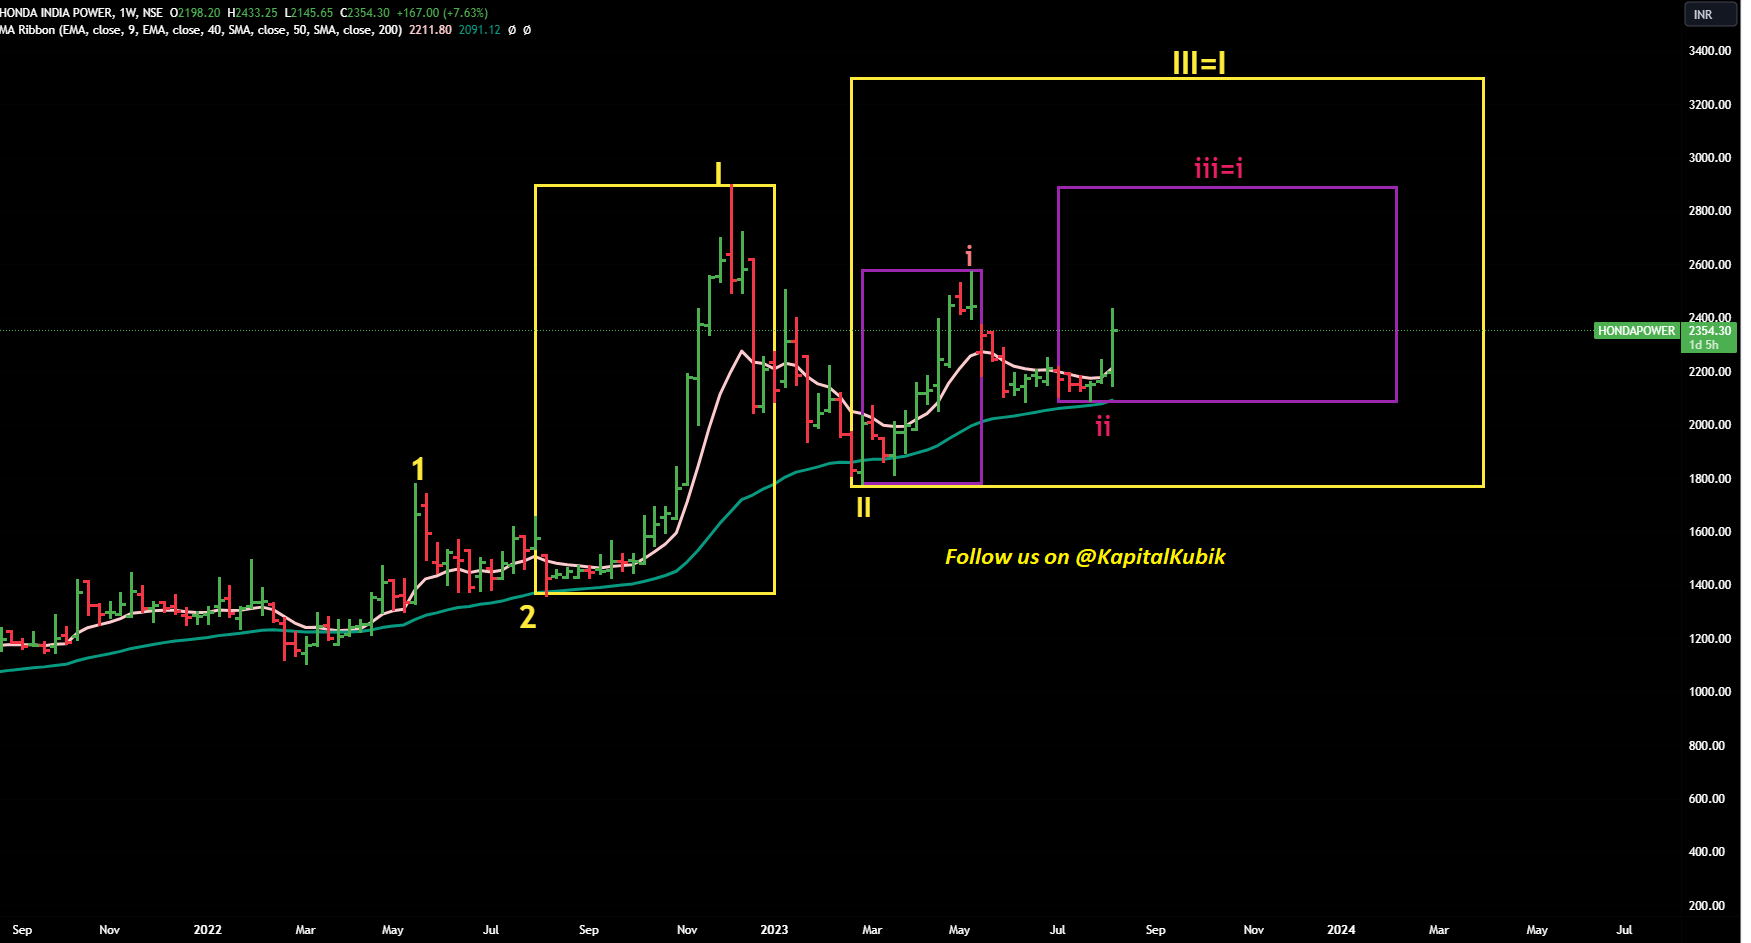
Honda Power
CMP 2340
Other great results and other good set-up as per EW.
Weekly Chart.
@StageInvesting How does Maruti look?
We tend to avoid those large caps that have been fully discovered- it is difficult to make Alpha there.
Hello Stage !
Would you have a time to look at Oil India ?
Many thanks in advance.
Hello @StageInvesting
What are your thoughts on HANGSENG index chart?