
Sorry …currently we;re not looking at it .We’re just waiting for some stimulus from China government or some postive data from that country. Otherwsie it is just a distraction as of now.
1 Like
Hi StageInvesting - you had earlier looked at MPS Ltd… but that time it had not given a break out… now the break out is done… definitely in Stage 2… and on fundamentals company has guided for 3x revenue and 3x profits in the next 5 years…how do you see the stock on Elliot Waves
Hi StageInvesting,
Can you please share chart analysis of Subros
We’re holding the same. It has completed a wave ,hence consolidating a bit. Bollinger Bands have expanded a lot , hence they need to tighten.
It can happen in two ways :
a) Price should correct a bit
b) Or it can get into a time correction (that is moving in a range for some time) ,so that averages can come up .
The path would depend upon overall market situation. But long term , we don;t see any issue.
2 Likes
We don’t know much about the company ,hence won’t post the chart. But looking at charts, it seems that more correction is due.
Dear @StageInvesting ,
Ambika cotton mills is one undergone huge correction since Feb 22 and looks like consolidating for the last 8-9 months. How does it looks in EW charts ?
Ambika Cotton
Weekly Chart
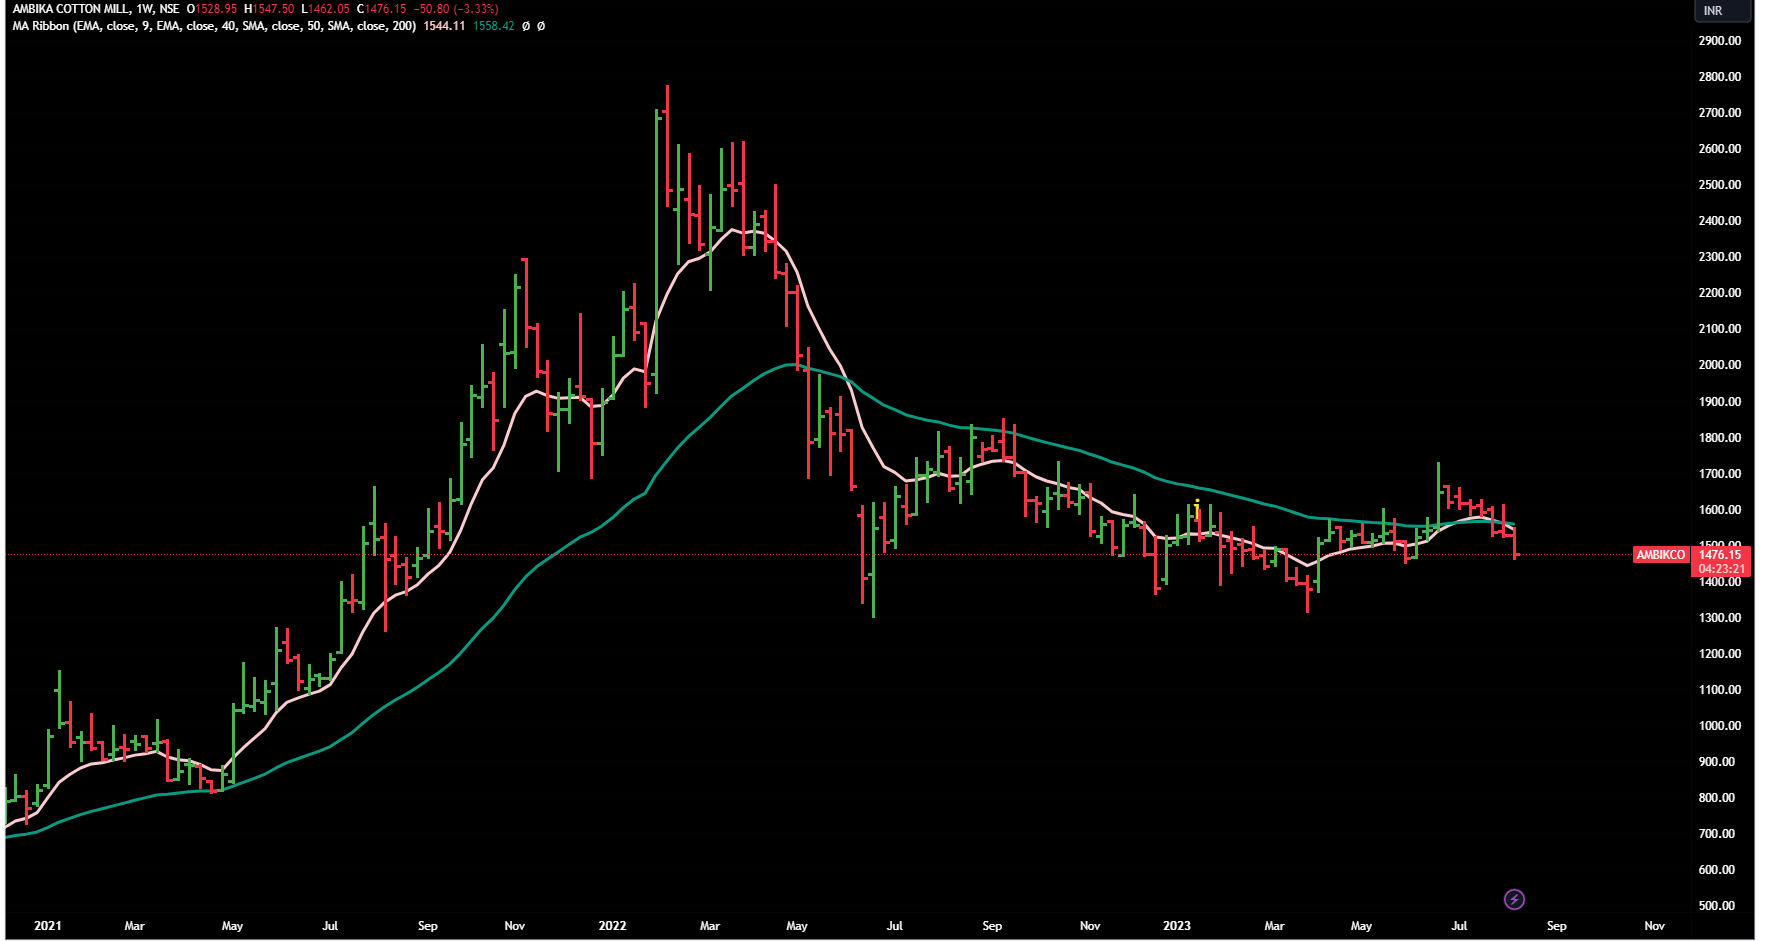
It is lingering below 40 WEMA …hence we don’t see any hope as per now as per the chart.
Only good thing is that it is arading above 40 MEMA …hence it may not fall much and keep moving in 5-10% range till the time sector/company shows some business-momentum.
No buy/sell reco.
2 Likes
Thank you for your detailed analysis.
Hello,
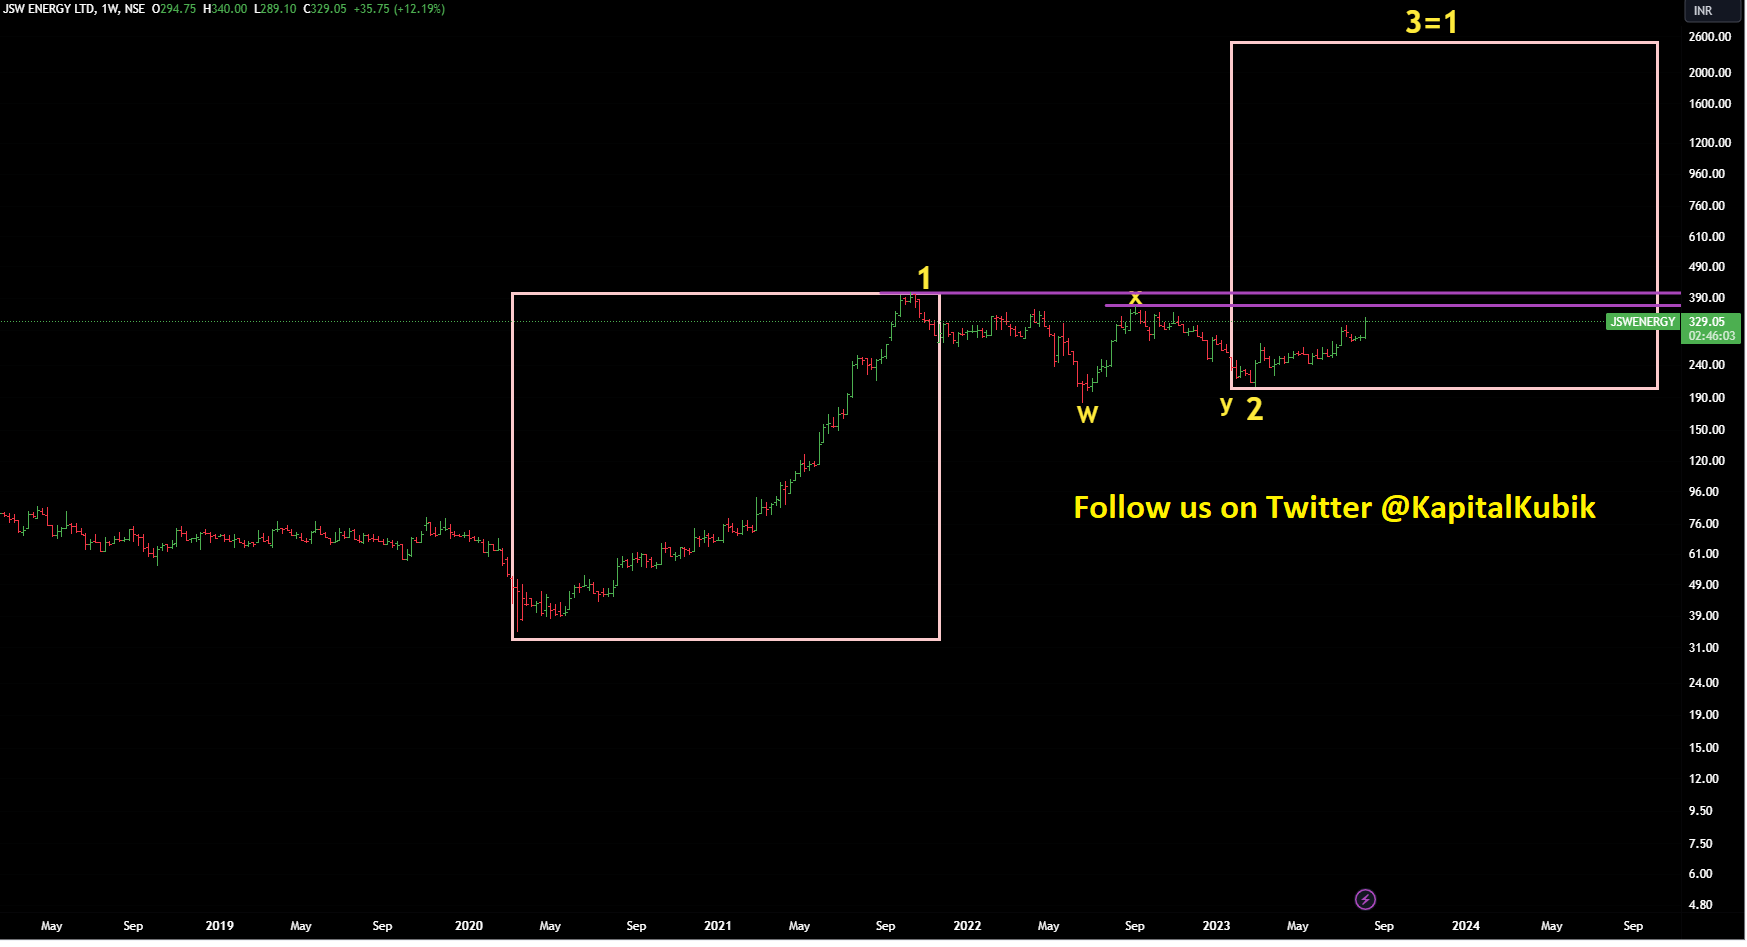
JSW energy seems to be completed stage2 (or 4?) on weekly time frame. Could you please check it once?
JSW Energy
CMP 327
Well ,little difficult to say as we can’t see a new clear impulse.
But looking at the momentum ,one can follow postion siziing method.
As per these methods, one can start Initial positions at these levels (286 as SL level) and can add on to positions once it crosses the hurdles of 370 and 402.
If it is really wave 3 , then long term targets are well beyond imagination.
Monthly Chart.
Disclaimer : This post is just for learning few methods of price-patterns. Views are personal and are purely based on our limited knowledge of charts. No buy/sell recommendations. These are probability-study methods and chances of success/failure depend upon various factors
3 Likes
Dear @StageInvesting ,
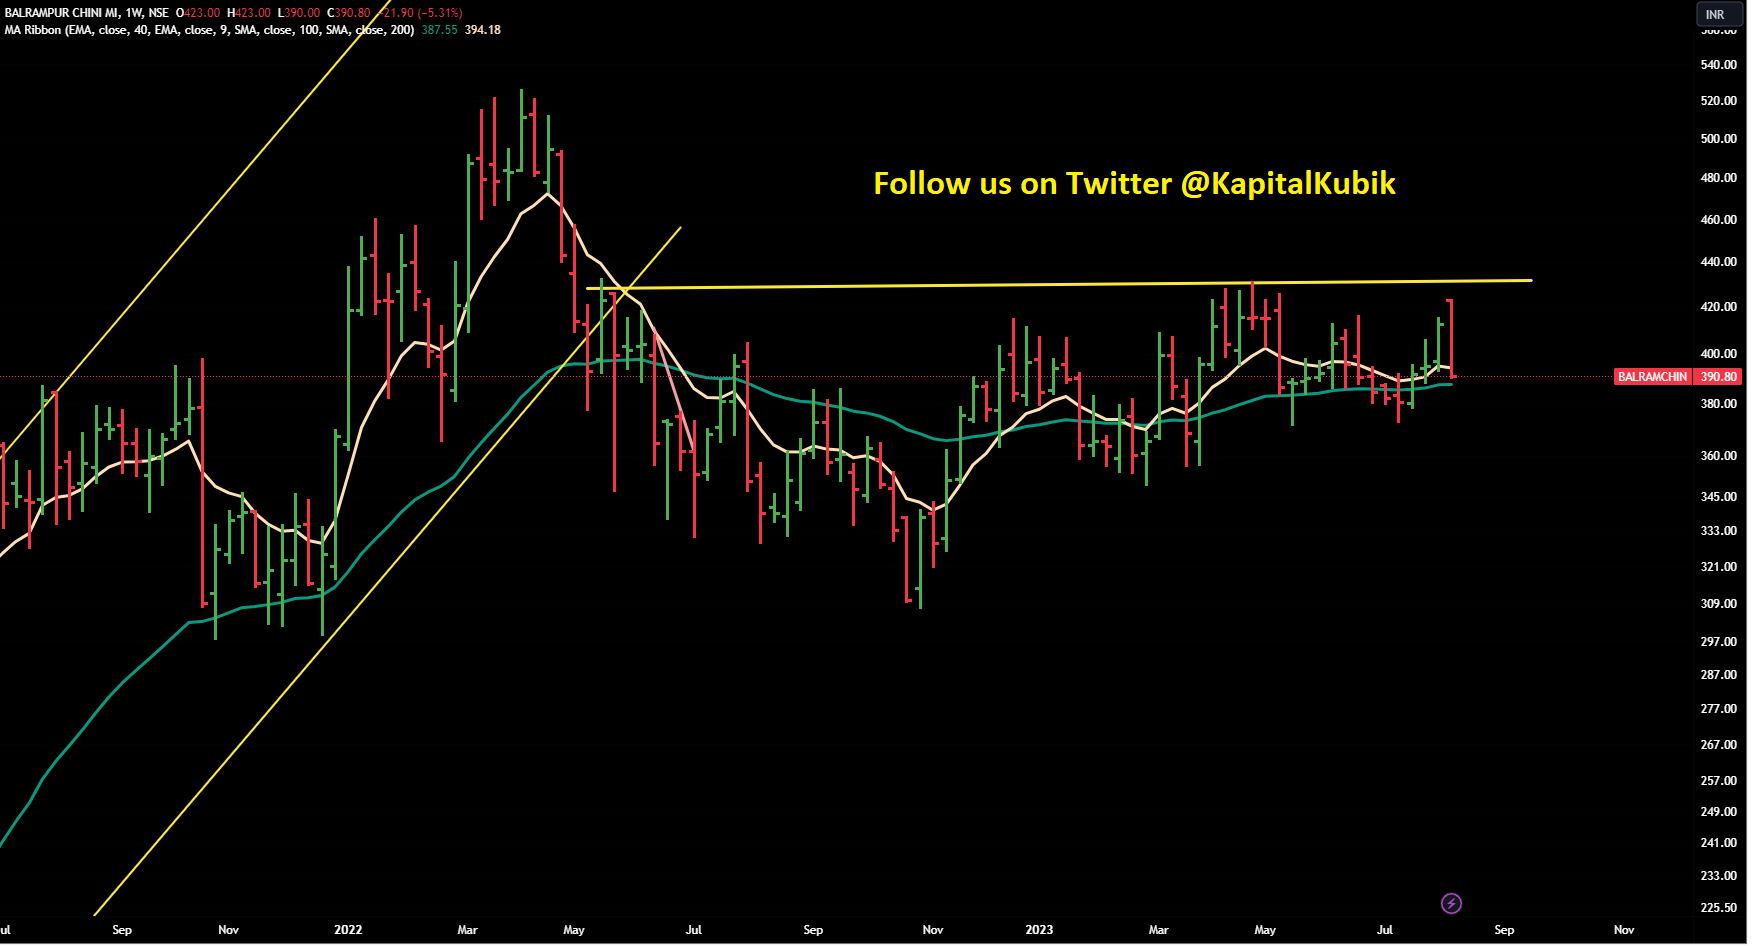
Could you please give your view on Balrampur Chinni, It had a good Q1.
Thanks for all your help in this forum.
Keep a watch at 426-430 levels (yellow -line). Till the time it does not give 2-3 weekly closes above this level, there is no hope.
One suggestion to everyone - look at few of our charts, see where we draw the resistance lines- find the pattern and your life would become easier.
Weekly Chart
Disclaimer : This post is just for learning few methods of price-patterns. Views are personal and are purely based on our limited knowledge of charts. No buy/sell recommendations. These are probability-study methods and chances of success/failure depend upon various factors
1 Like
A naive question. In most of the charts and in above JSW energy chart you mention 3=1 on top of the box… Is it the relationship between wave 1 and wave 3? e.g in JSW energy in Wave 1, stock price went up around 9-10 times, so in wave 3 too you expect stock price to go up 9-10 times from starting price of wave 3? rgds.
Sir In EW method, we go by the thoery that says that 2 of the impulse waves ( 1,3,5) have to be equal i.e. 3=1 or 5=1 or 5=3).
Hence when we see a 3rd wave starting , we begin with an assumption that wave 3 would be qual to wave 1.Wave 3 can be bigger ( or smaller) than wave 1 but the starting point assumption remains same till the time wave 3 does not cross the equality principle.
As far as the length is concerned, we don’t take multiples wrt wave 1 rather we take equal % ge on a logarithmic chart.
9 Likes
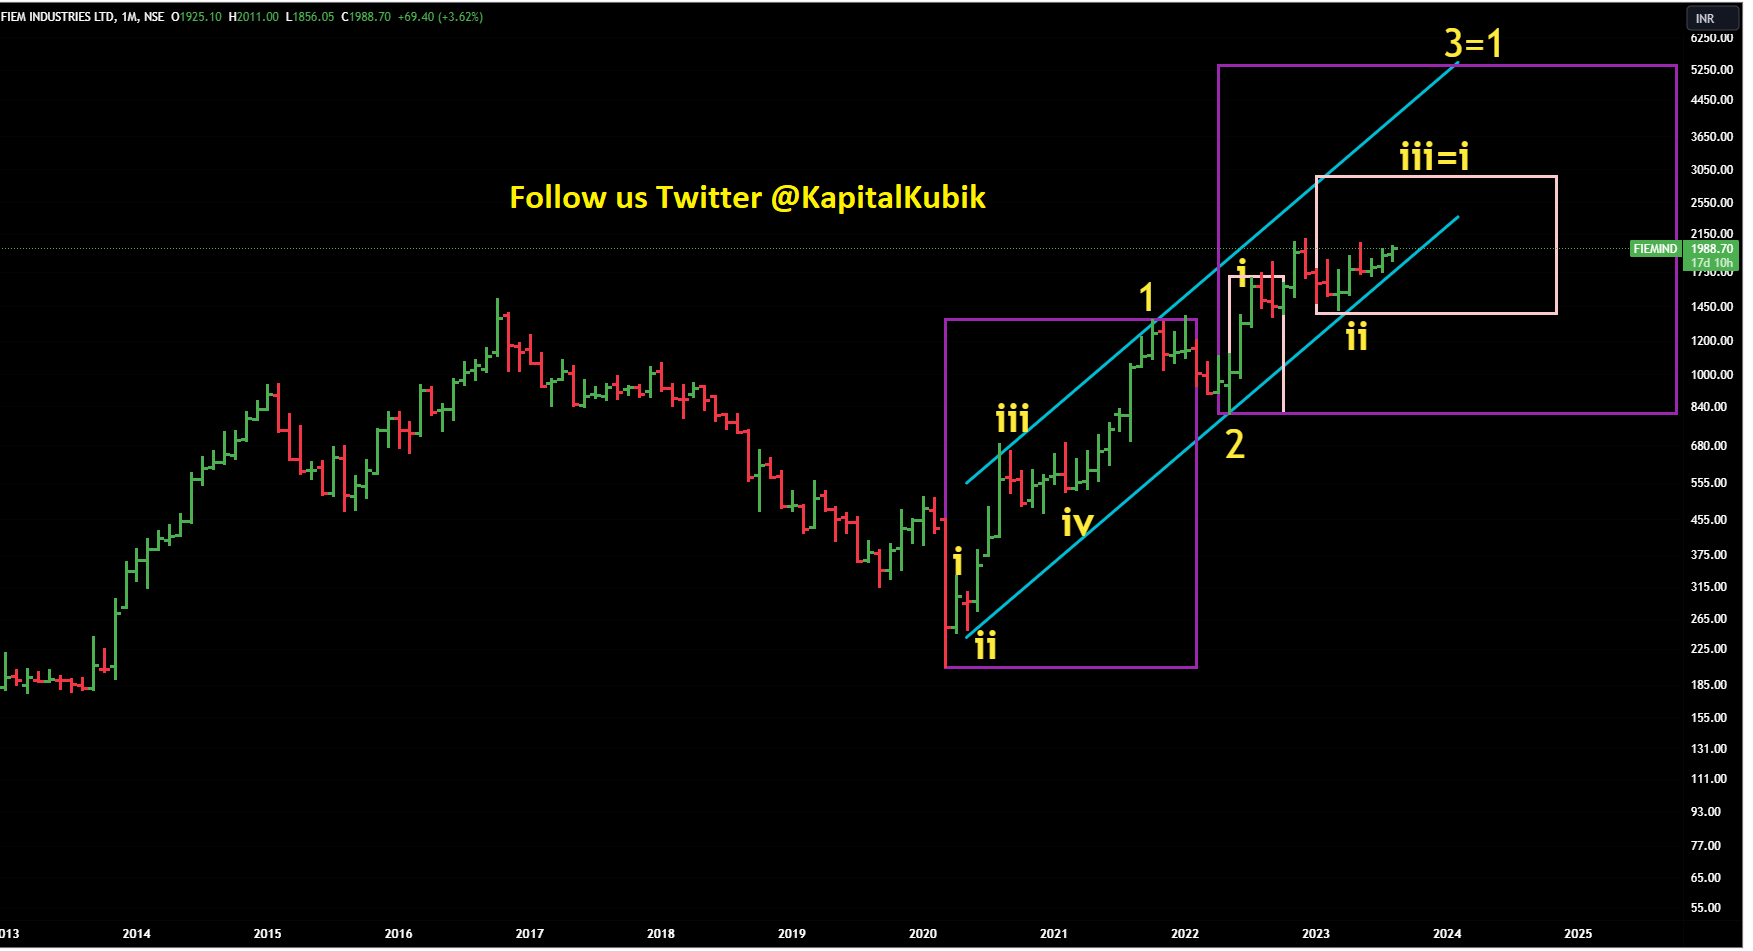
Fiem
CMP 1988
Will it start iii of 3rd wave …results are expected to be announced today.
If the results come good ( as per chart ,the expectations are high) , then we can see this.
Monthly Chart
Disclaimer : This post is just for learning few methods of price-patterns. Views are personal and are purely based on our limited knowledge of charts. No buy/sell recommendations. These are probability-study methods and chances of success/failure depend upon various factors
1 Like
DXY -Follow up
CMP 102.92
As mentioned above , level of 100 was not broken on monthly basis ( month-end closing ) , hence doubts still remain.
Currently it has broken above the falling trend-line , that sounds bullish !
But let’s see whether that sustains. Commodities are yet to confirm the upmove ( if DXY has to really move up, commodities prices should start cracking – that is yet to happen.
Hence keeping the fingers crossed.
3 Likes
Hi @StageInvesting - Could you please elaborate on the special situation with Aarti Pharmlabs? I know it is demerger but what is the special situation here and what is the rationale for trading/ investing?
Wave 3 cannot be smallest wave as compared to wave 1 and 5, so initially one can assume it will be at least be equal to wave 1.
This is another novice trying to explain.
Regards
2 Likes
Please read the thread on this forum on the said company.
Just an update …we have exited Shivalik Bimetals this week.
2 Likes