
Stage analysis of JKIL please. It seems undervalued and is bagging new orders but not performing well in last 9 months. How do you take volume into account for stage investing ? Here, would you consider it a positive that the decline from top is mostly on lesser volume.
Good day Sir, Could you kindly revist Greenpanel Industries again?
Do you think the bottom is formed and ripe for the next up move?
One more help, I am not able to find any kind of wave in SIS ltd, its just falling. Does Elliot Waves dont apply for some charts?
Hi, can you check chart for ge t&d and ge power and advise for 2-3 years?
where do you see Nifty 500 in 6 to 8 months
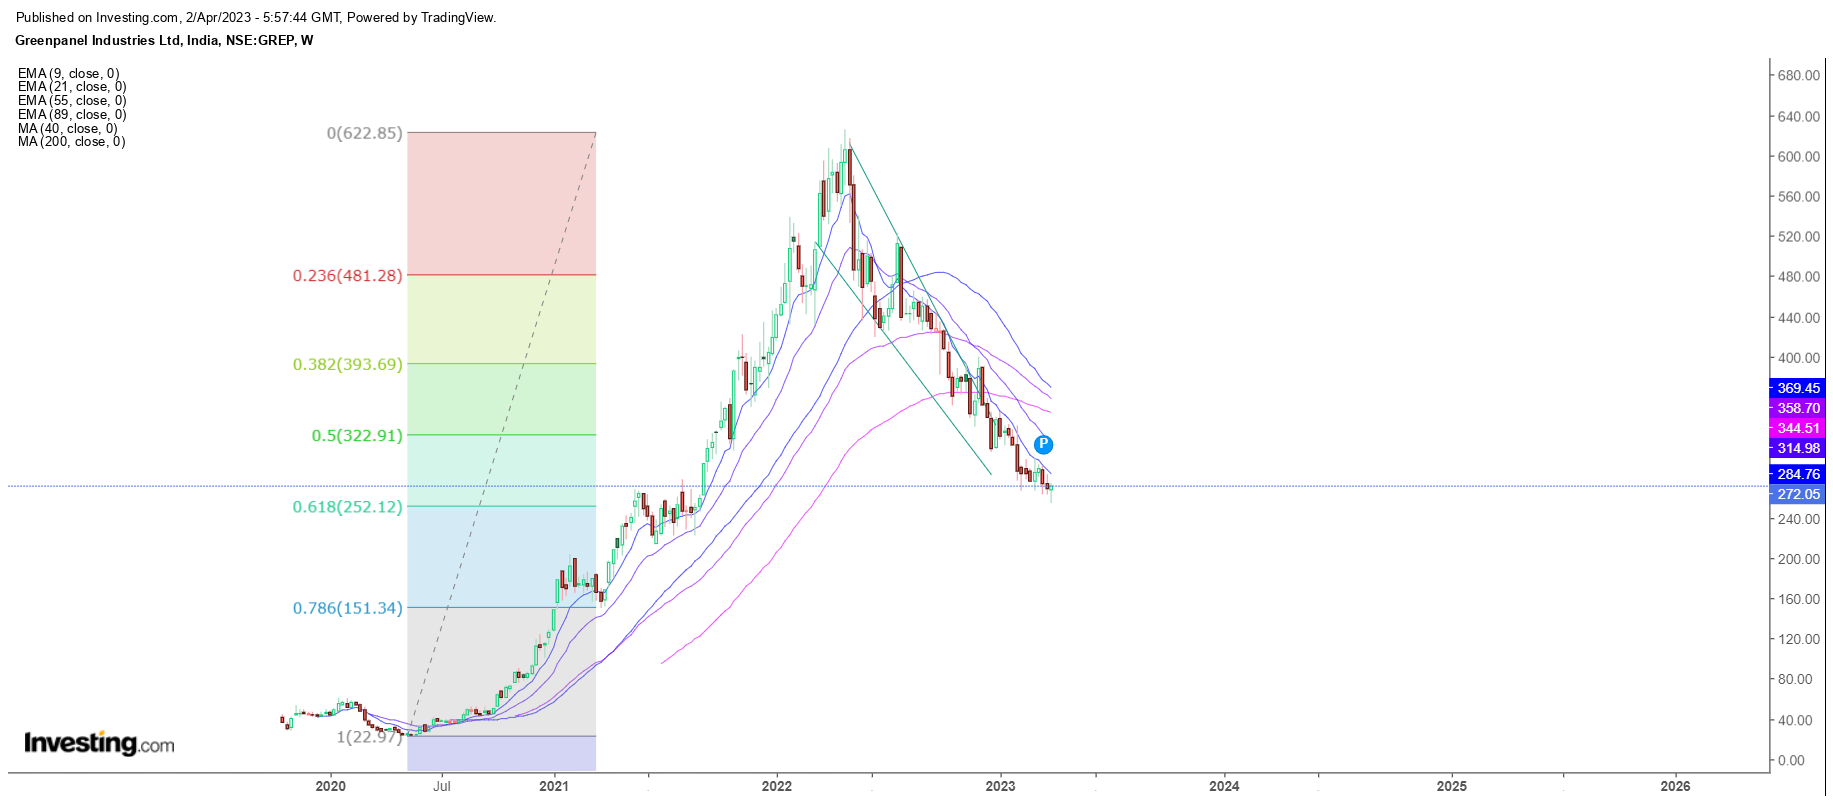
GreenPanel
CMP 270
We have been posting about it from the levels of 400.
As projected earlier, it came down near 260 levels.
Would it go up now ?
Don’t see any reason !
Fundamentally speaking,every player has expanded MDF capacity so competition would be strong as well as pressure on margins would remain.
Technically , it seems all big hands have exited and now it is left with retail -guys.
If any big guys are still stuck, they would take it little up and would then exit,
Don’t foresee any significant upside except some sideways movements and consolidation for next few months ( even years!)
Disclaimer : This post is just an effort for learning few methods of price-patterns. Views are personal and are purely based on our limited knowledge of charts. No buy/sell recommendations. These are probability study methods and chances of success/failure depend upon various factors
4 Likes
We don’t track Nifty Indexes —they’re of no use for us.
We track macros - credit growth,inflation, money-supply, economic-conditions etc etc to decide the levels of our exposure in the equities.
All waves are corrective waves , no impulse waves. Till the time ,we don;t see any new impulse wave, we don’t see any big upside in this.
1 Like
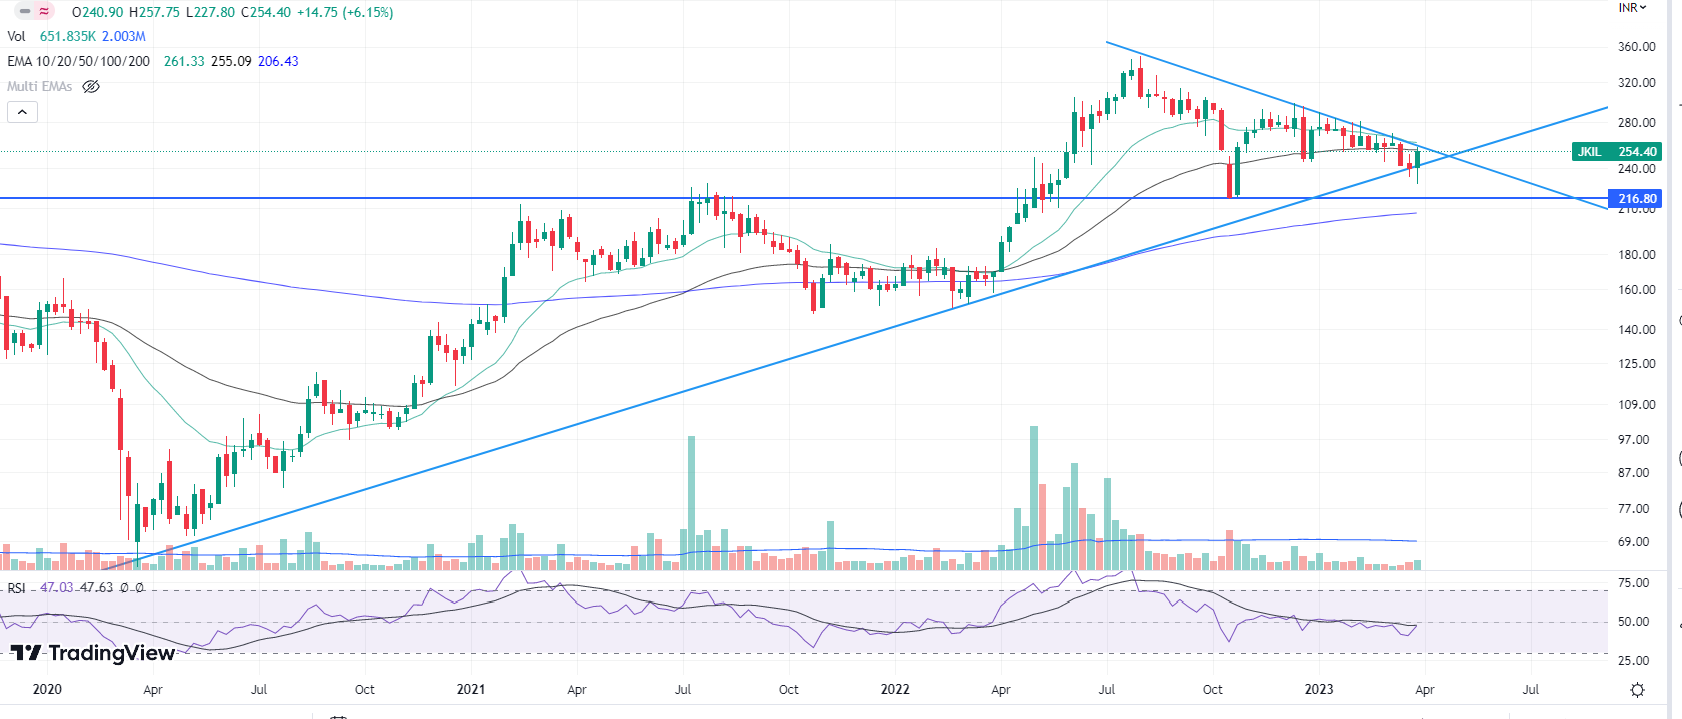
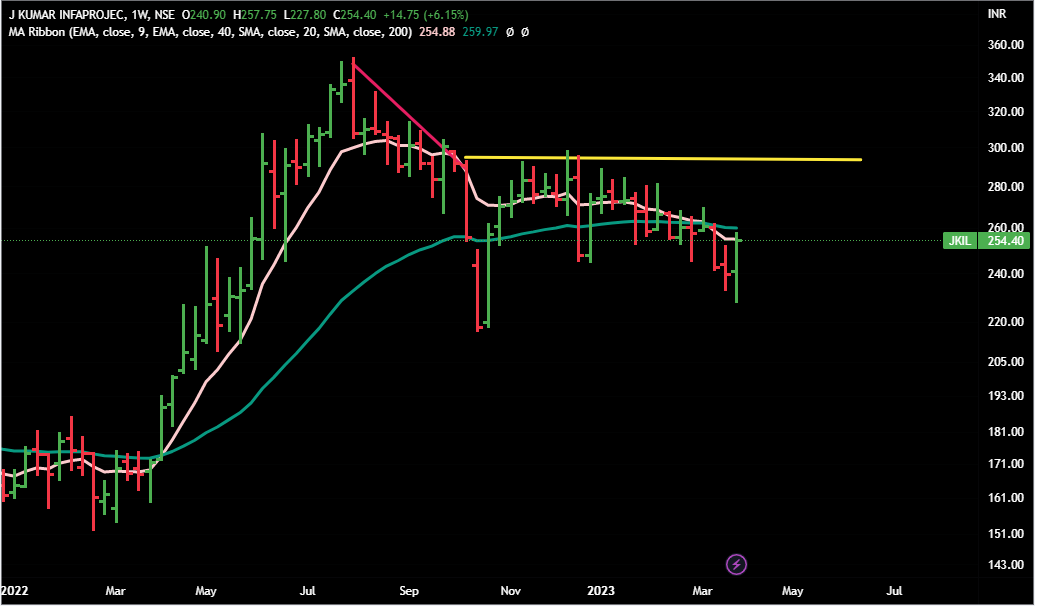
JKIL
CMP 254
It is a clear Stage 4 stock .
Till the time it does start trading and closing above 290-300 levels , no major upside should be expected.
Weekly Chart
Disclaimer : This post is just an effort for learning few methods of price-patterns. Views are personal and are purely based on our limited knowledge of charts. No buy/sell recommendations. These are probability study methods and chances of success/failure depend upon various factors
1 Like
GE Power
CMP 99
Don’t know why you want to know about this company. You’re wasting yours as well as our time.From pric-eaction it seems that this company has no business …it is either falling or going no where for last 15-16 years.
It might bounce a bit from here. But we don’t see any future in this unless some restructring happens in the business.
Half Yealry Chart
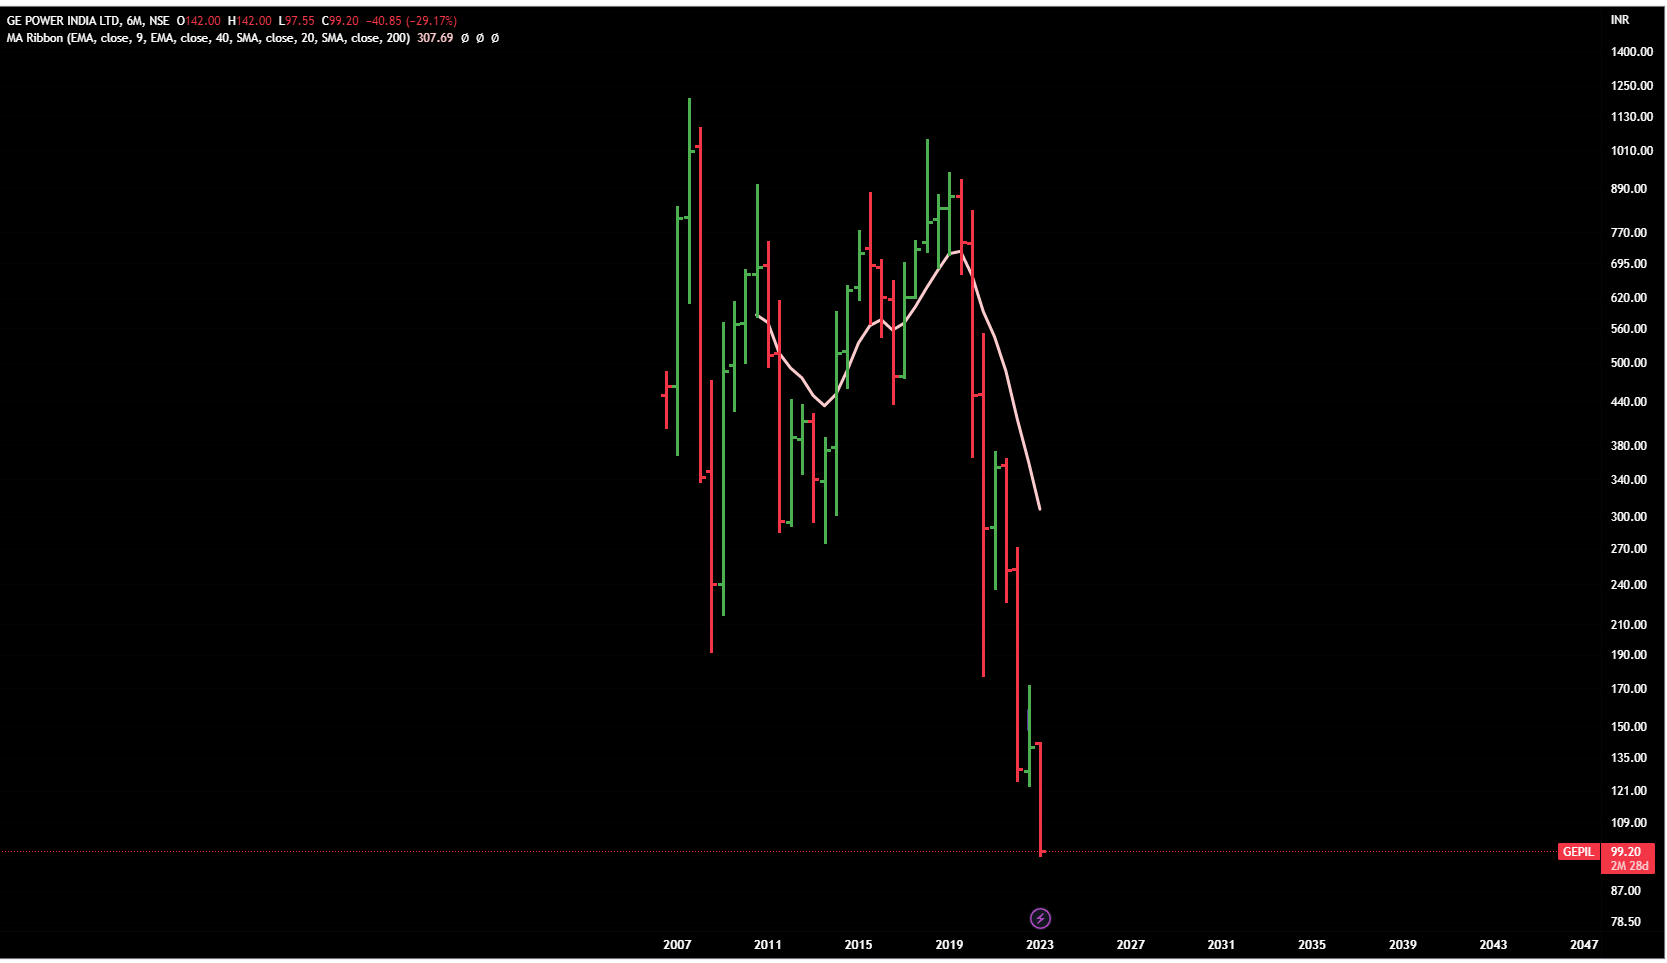
Same seems to apply to the other company you asked.
Would request you to please spend your time on studying good companies and businesses.
Disclaimer : This post is just an effort for learning few methods of price-patterns. Views are personal and are purely based on our limited knowledge of charts. No buy/sell recommendations. These are probability study methods and chances of success/failure depend upon various factors
2 Likes
You had earlier posted about KRBL having huge potential. Want to know has there been any updates on the same ?
Fundamentally, the firm is doing well and it has now slipped a lot.
1 Like
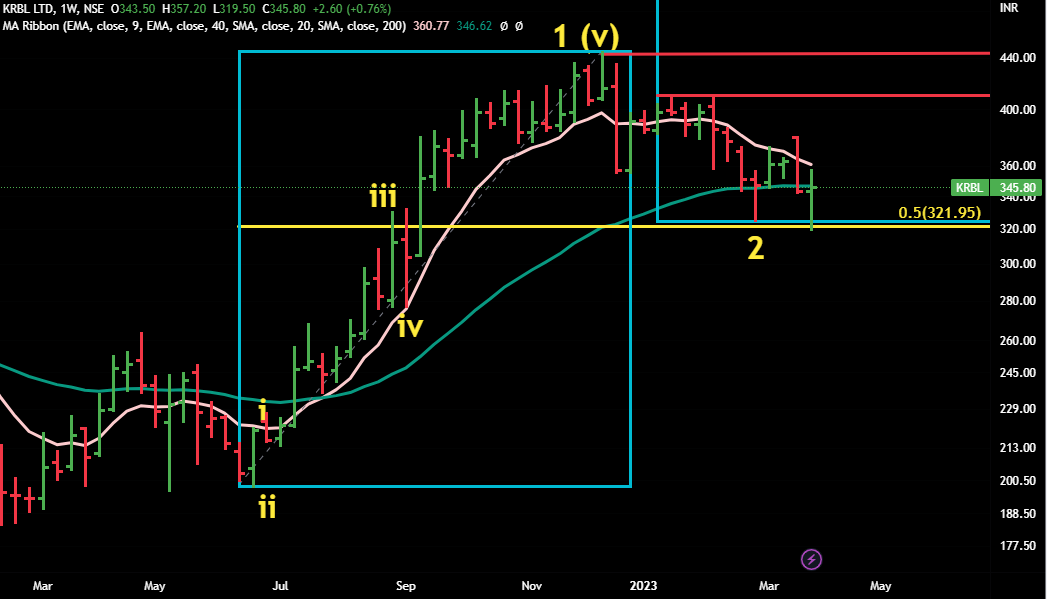
KRBL
CMP -345
Please keep in consideration that we go buy Stage Analysis and EW method of tracking the good fundamental companies.
Hence if one is following the bullish stocks pointed out by us, should have at least basic knowlwdge of Stage-Analysis .
That’s why we give full background and reasoning on the basis of technicals in the most of our posts.
In case of KRBL, it is still in good phase as per Stage Analysis - it has not closed below 40 WEMA for more than obe weekend in recent weekends.
If it closes below 40 WEMA for 2-3 weekends and is unable to reclaim this important weekly EMA , we would back -out and would consider it weak.
Hope it is helpful…while tracking the stocks ,by keeping the key MAs in consideration and one can take a call by himself.
Weekly Chart
Disclaimer : This post is just an effort for learning few methods of price-patterns. Views are personal and are purely based on our limited knowledge of charts. No buy/sell recommendations. These are probability study methods and chances of success/failure depend upon various factors
4 Likes
Strong Charts Series
Here are 2 more ![]()
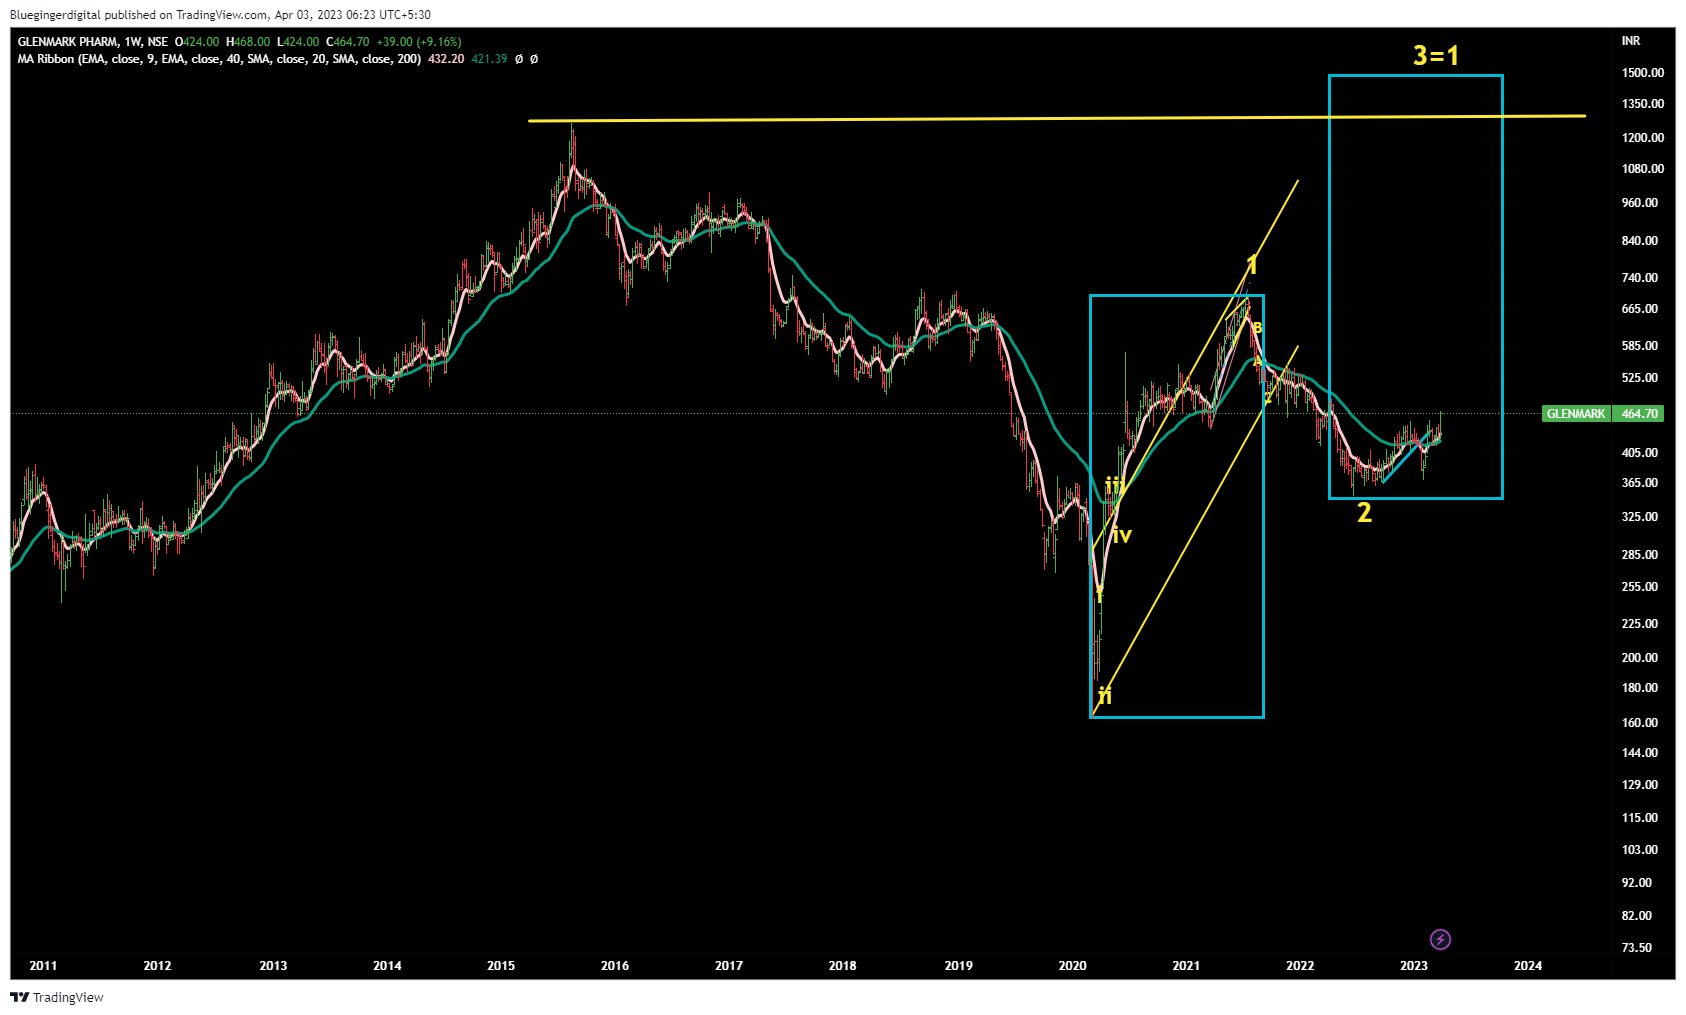
Glenmark Pharma
CMP 464
Seems that wave 2 is over and wave 3 has begun.
Further confirmations would come once it starts trading /closing above :
i) Level 1-490
ii) Level -540
iii) Level -680
Weekly Chart
Other one ![]()
Cochin ShipYard
CMP 475
Seems that wave 2 is over and wave 3 has begun.
Further confirmations would come once it starts trading /closing above :
i) Level 1-542
ii) Level -647
iii) Level -690
Weekly Chart
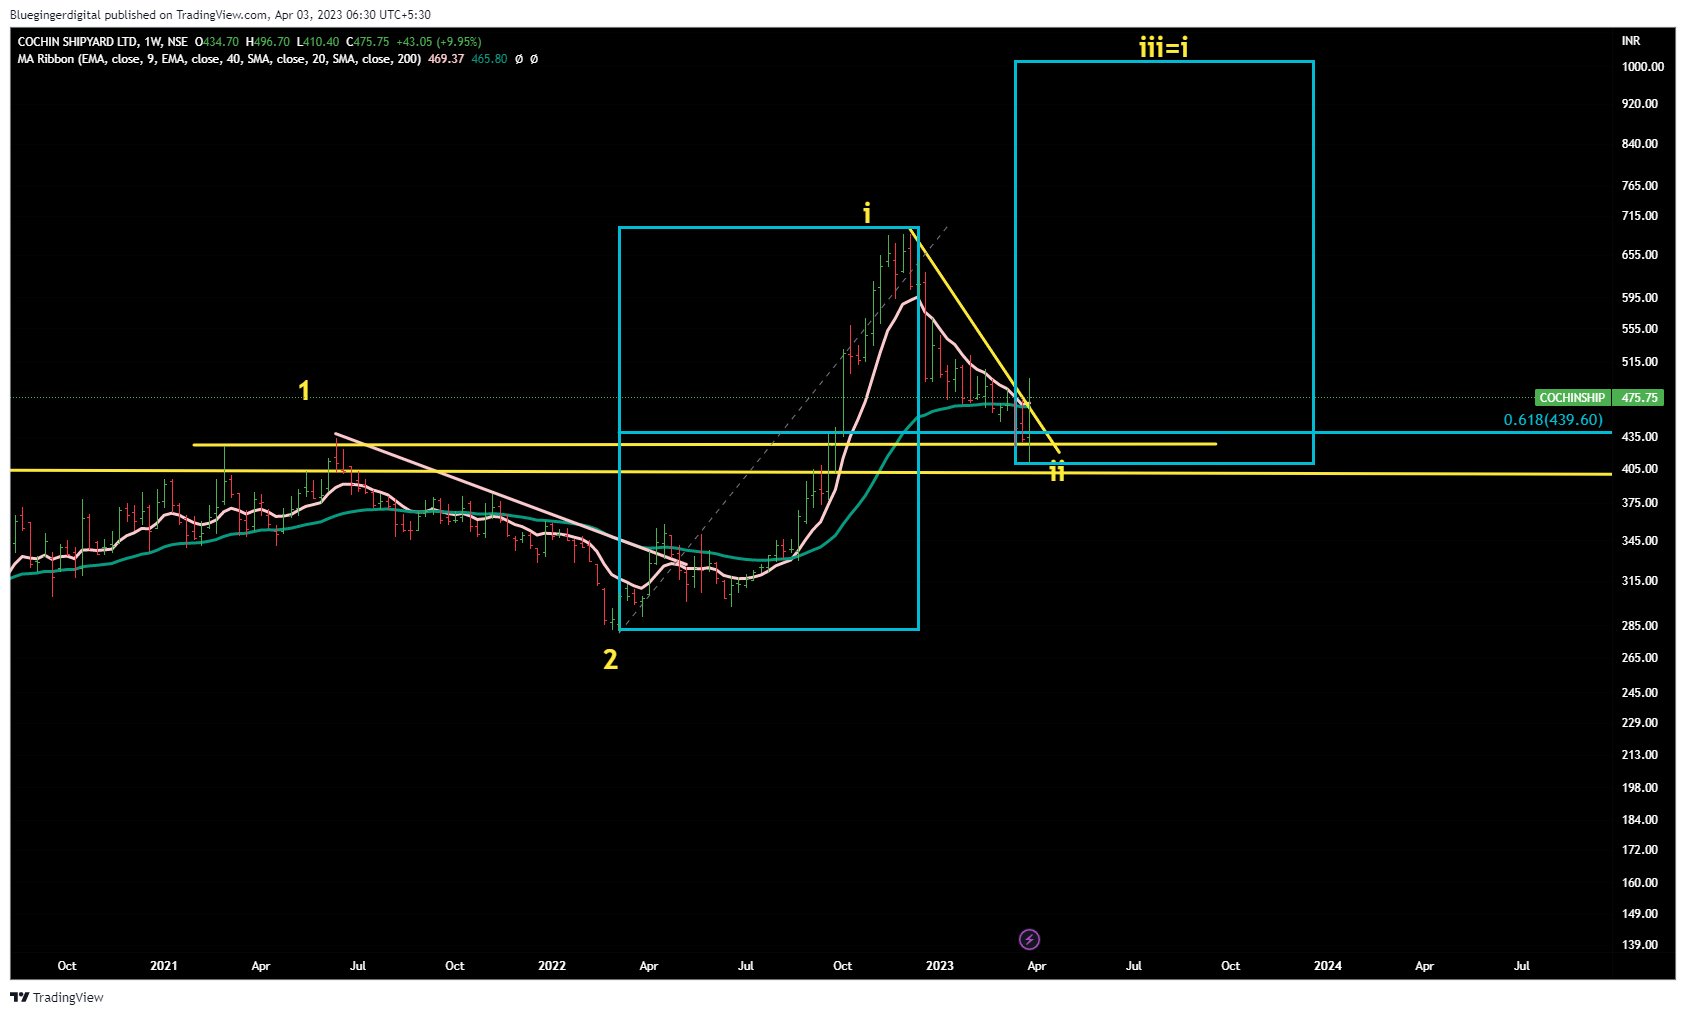
On downside - keep a watch on weekend closing levels - if any of these starts closing below 40WEMA , the set-up should be considered cancelled.
Disclaimer : This post is just an effort for learning few methods of price-patterns. Views are personal and are purely based on our limited knowledge of charts. No buy/sell recommendations. These are probability study methods and chances of success/failure depend upon various factors
3 Likes
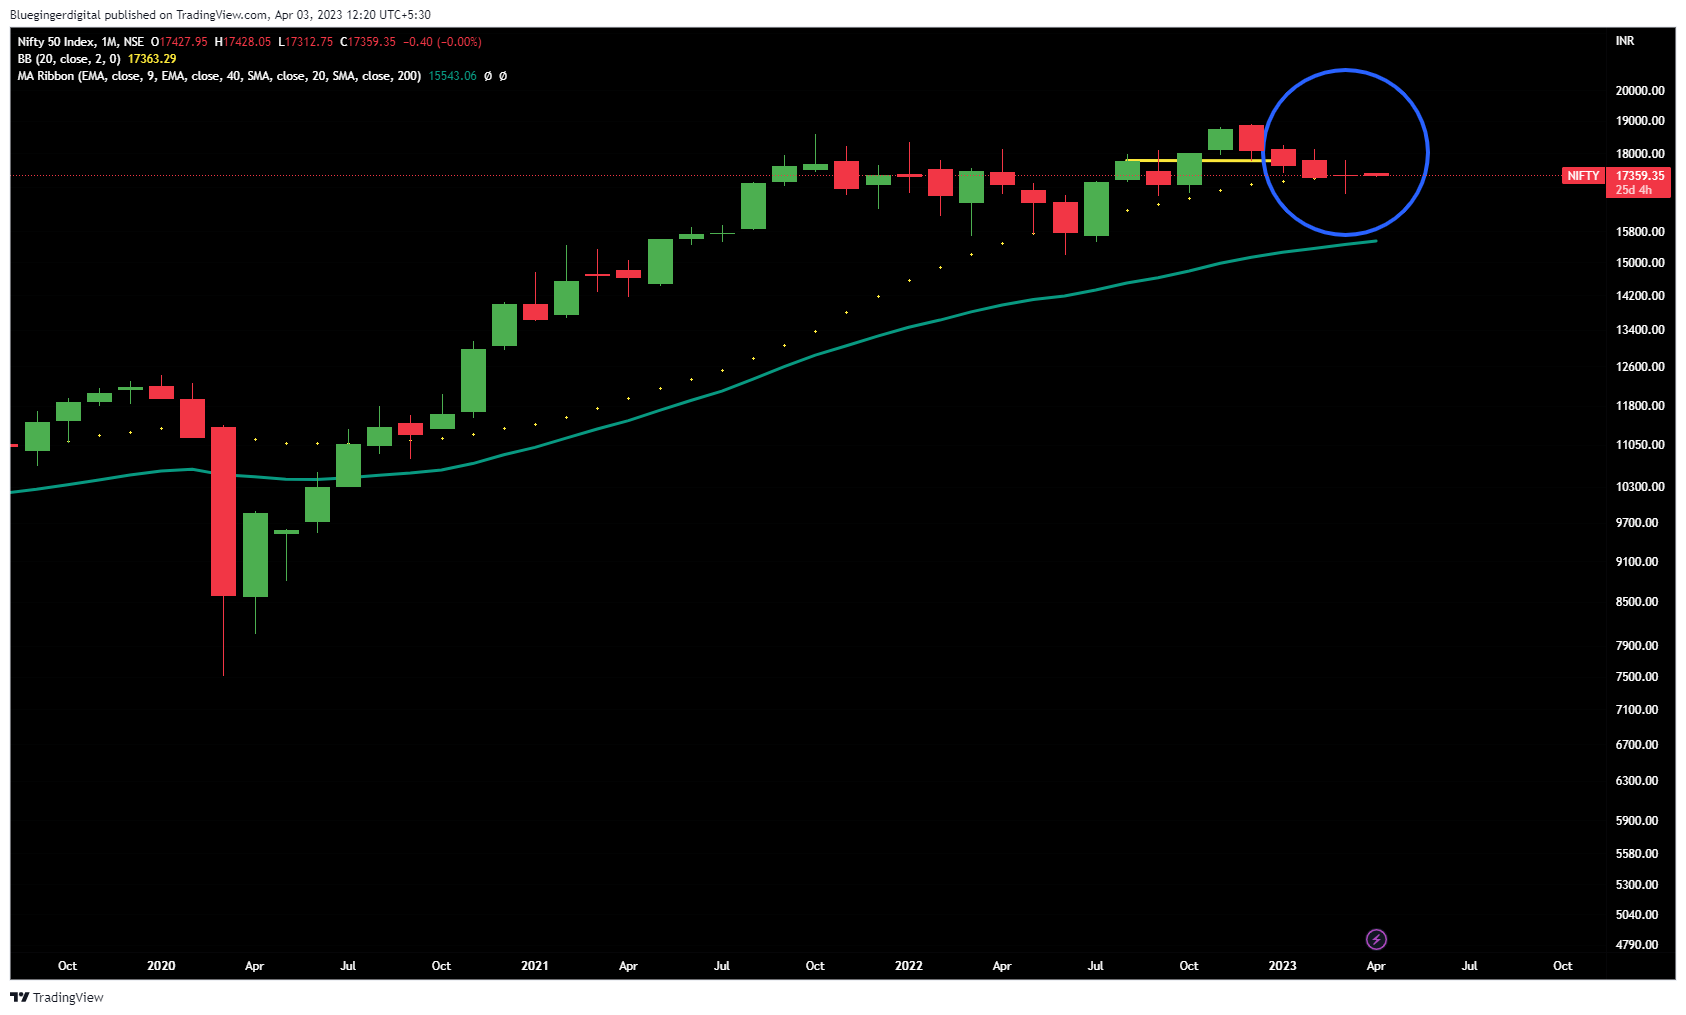
Nifty 50
April Start
We made a long legged doji on Monthly Chart on March enc after 3 Black Crows formation during Dec-Feb period.
As per candle- stick pattern theory, this doji is a reversal pattern.
How long we would go in this leg…well that’s difficult to say but let’s keep tracking.
Similar pattern was formed in Nifty 500.
This would help in faster movement in the stocks where charts were already strong.
Disclaimer : This post is just an effort for learning few methods of price-patterns. Views are personal and are purely based on our limited knowledge of charts. No buy/sell recommendations. These are probability study methods and chances of success/failure depend upon various factors
3 Likes
KPIT Follow-Up
CMP 850
In lieu of lots of insider selling in last few weeks and overstretched charts, we’re no longer tracking this or interested in this stock for the time-being.
Can you look into vidhi speciality,They have planned a capex of 3x which should come on board in the near future and have hit full capacity utilization in the past quite frequently.
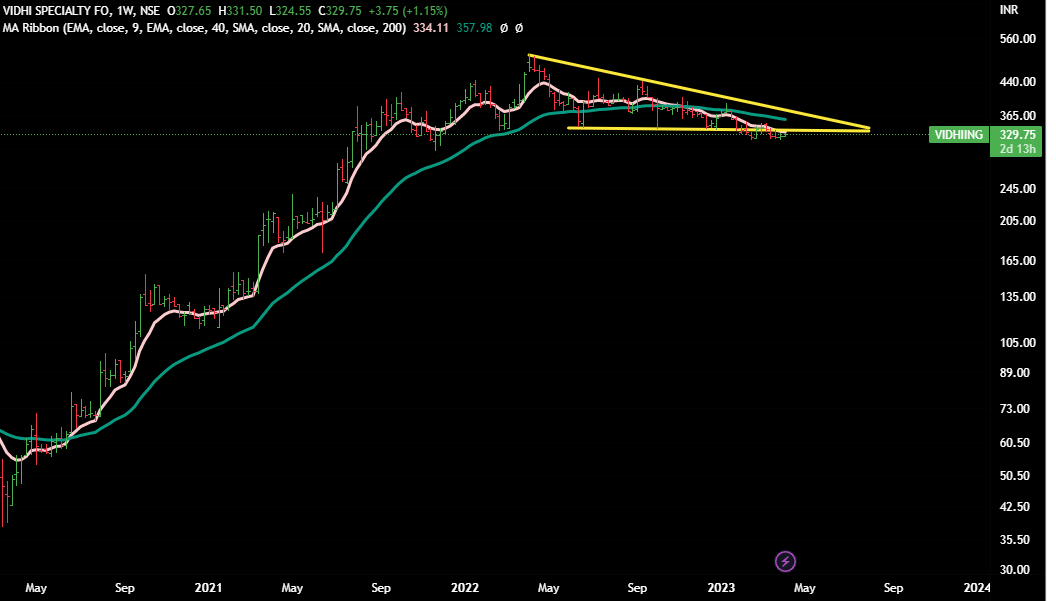
Vidhi Speciality
CMP 328
As of now ,the stock looks weak as it is making lower highs and lower lows. It also has brokend down from the triangle.Also the stock is trading below 40 WEMA.
There is small RSI divergence on weekly chart,but we can’t make much inference from the same.There is further scope of the price going down.
Weekly Chart
Disclaimer : This post is just an effort for learning few methods of price-patterns. Views are personal and are purely based on our limited knowledge of charts. No buy/sell recommendations. These are probability study methods and chances of success/failure depend upon various factors
4 Likes
Hi, Please share your views on Rushil Decor & Shreyas Shipping. Thank you.
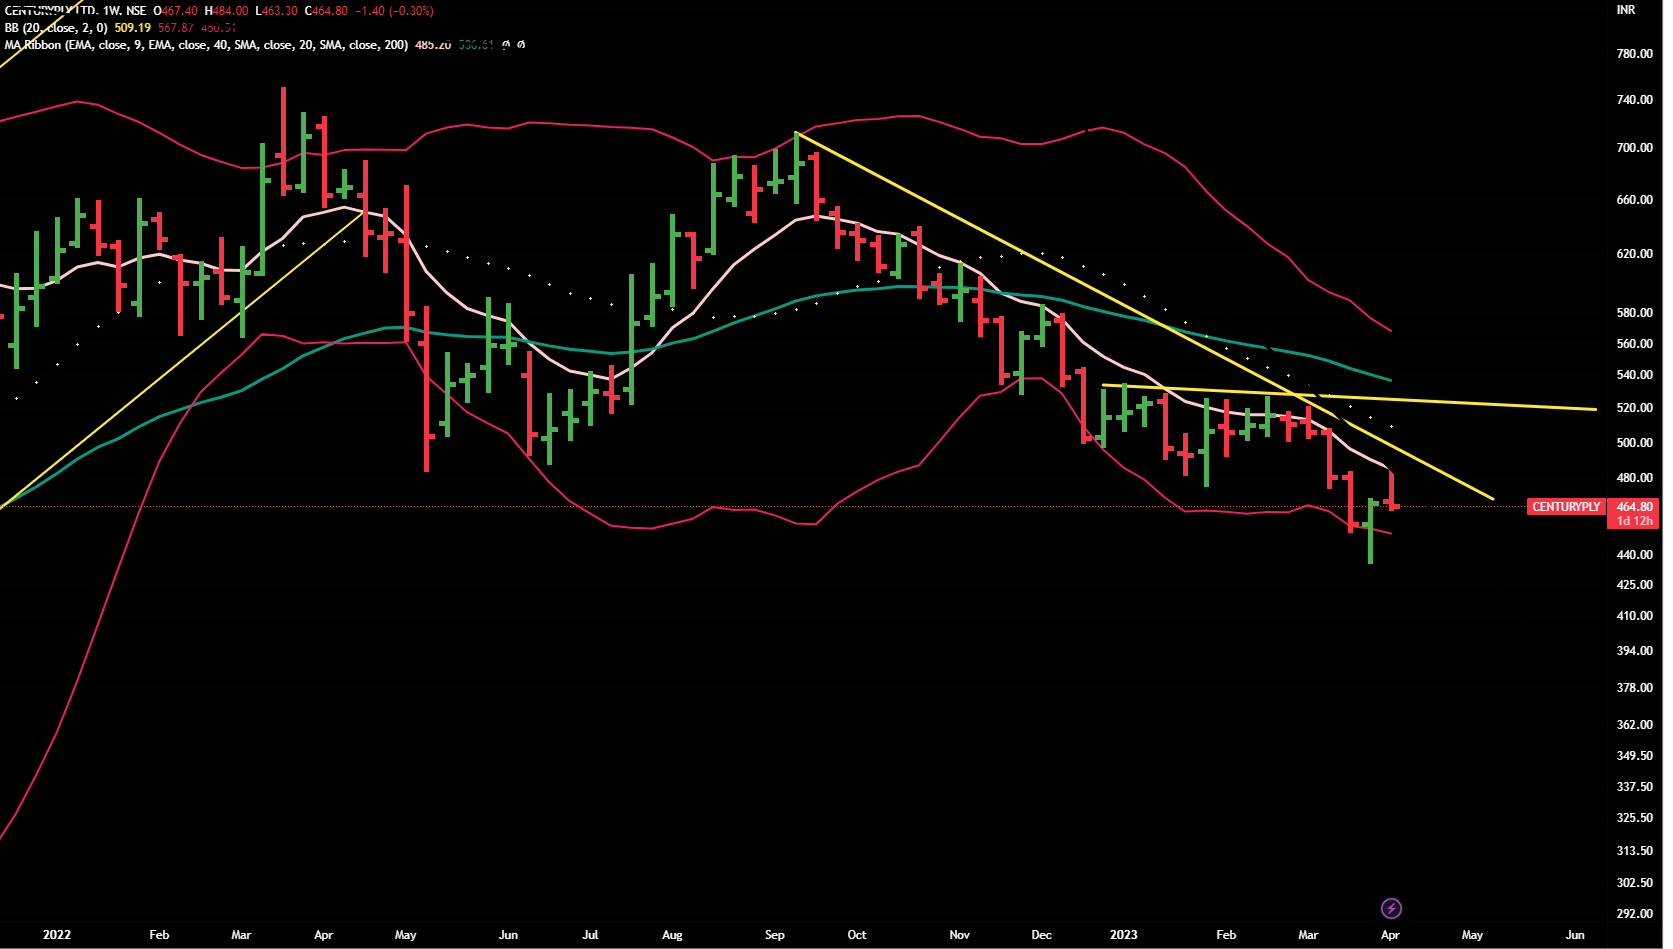
Please share your views on century ply.
CMP 464
Difficult to say whether it has bottomed out or not. But it is still a weak chart.
For any significant upmove, it needs to cross several resistances and those are very nearby ( yellow lines , moving averages etc etc )
Till it does not starts trading/clsing abve 40 WEMA for few weeks, it will remain weak.
Weekly Chart
Disclaimer : This post is just an effort for learning few methods of price-patterns. Views are personal and are purely based on our limited knowledge of charts. No buy/sell recommendations. These are probability study methods and chances of success/failure depend upon various factors
1 Like