
Hi check chart of acrysil at bse. Nse it was listed only few months before
Thanks. We generally check the charts on bth the exchanges. In this case, it does not make much difference as we’re studying the recent fall.
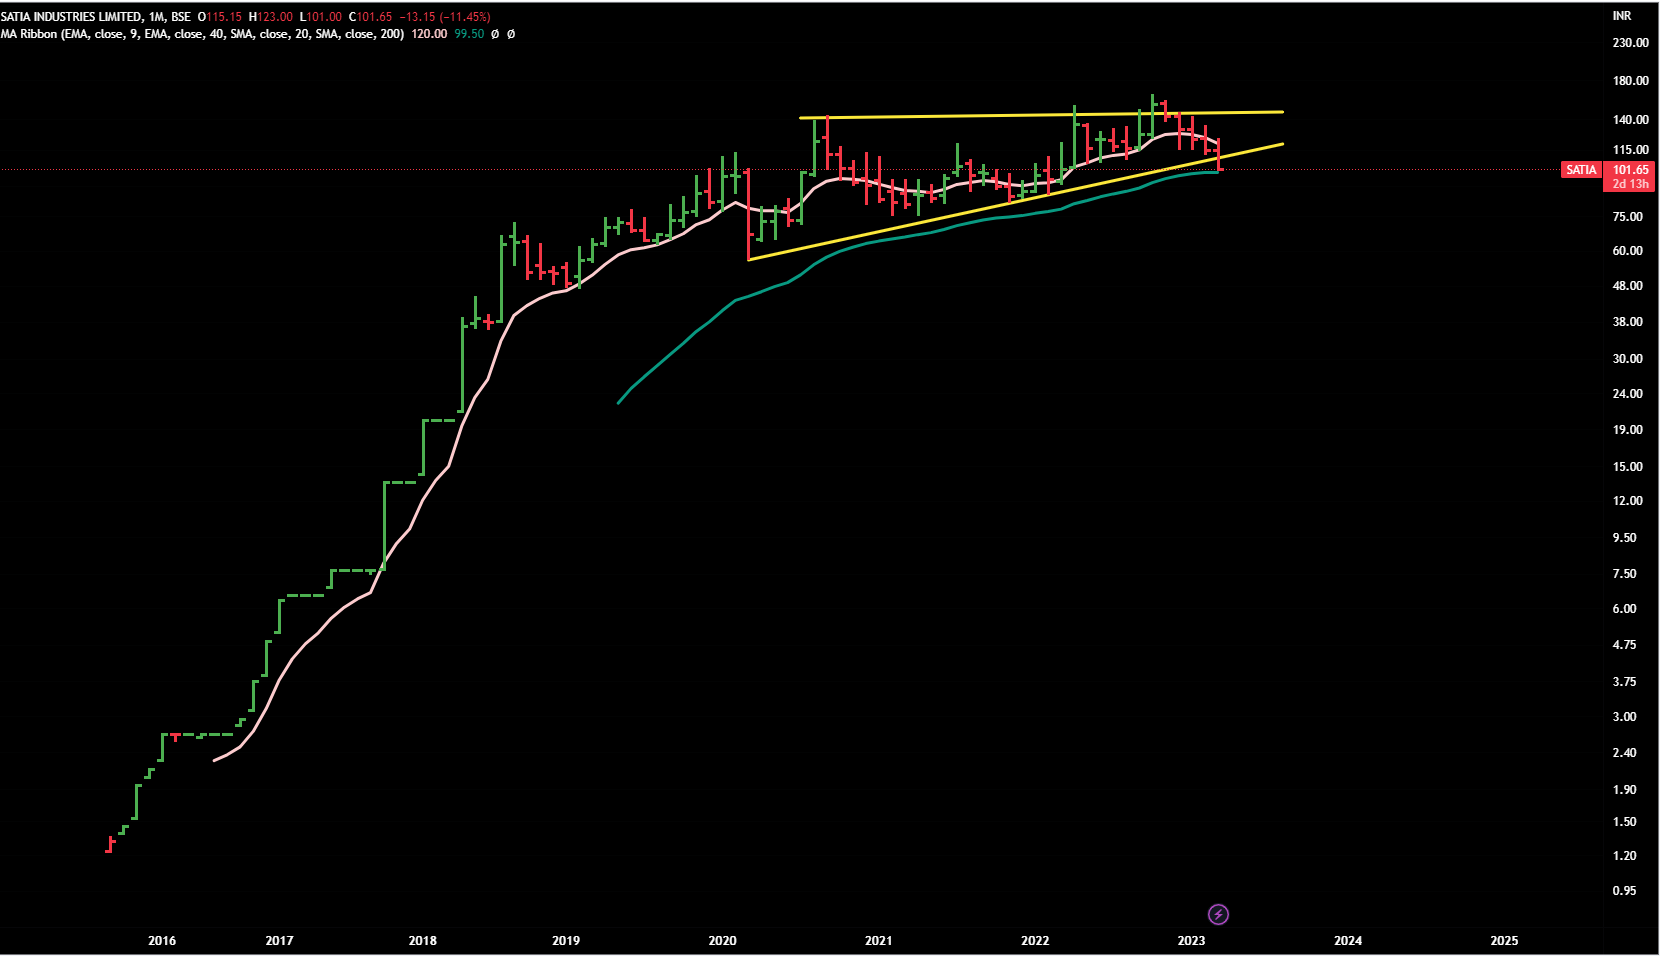
Satia
CMP 101
It shows a distribution pattern at the top and now it has given break-down .
Now 40 MEMA is the support zone (green line) …if it starts closing below it then next support-range is between 75-85.
Monthly Chart
Disclaimer : Invested and biased.This post is just a for learning few methods of price-patterns. Views are personal and are purely based on our limited knowledge of charts. No buy/sell recommendations. These are probability study methods and chances of success/failure depend upon various factors
2 Likes
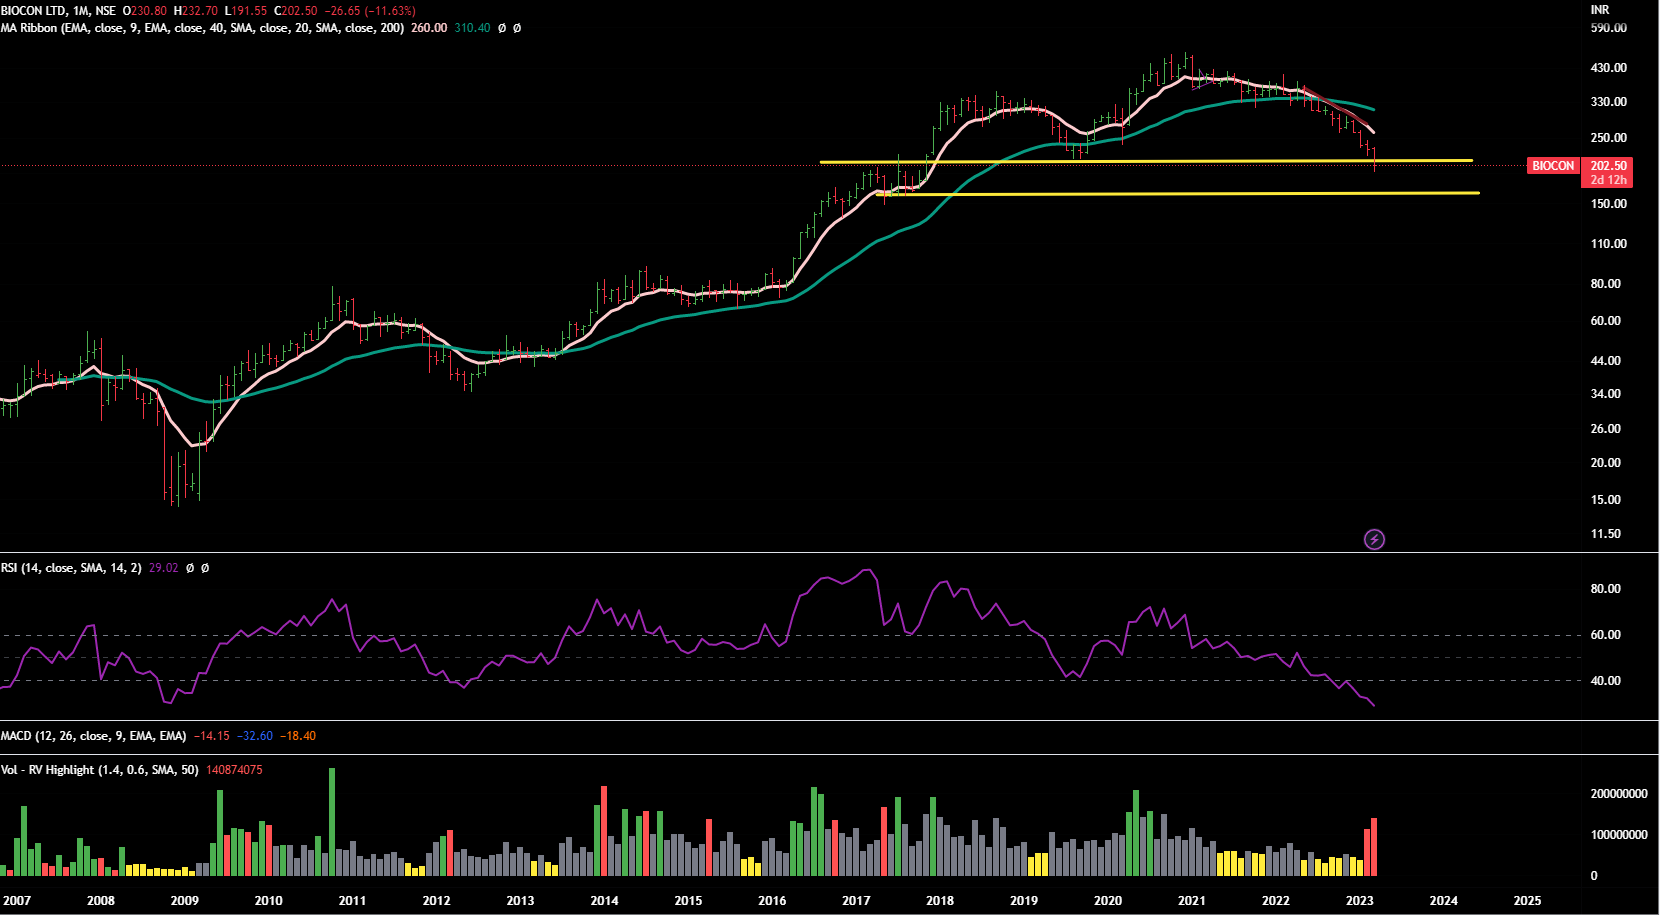
Biocon
CMP 202
It is at an important level.
RSI on monthly chart is near 29 …that is an oversold zone ( but stocks can remain in this zone for long period and can keep sliding.)
Also there has been hige selling by big hands in last 2 months- big red candles.
For any upside move, now 212 can act as a resistance…big hands need to move in and need to buy huge volume to take this stock up.
Otherwise , it can keep moving in a range of 150-215 for a long period.
Monthly Chart
Disclaimer : This post is just a for learning few methods of price-patterns. Views are personal and are purely based on our limited knowledge of charts. No buy/sell recommendations. These are probability study methods and chances of success/failure depend upon various factors
5 Likes
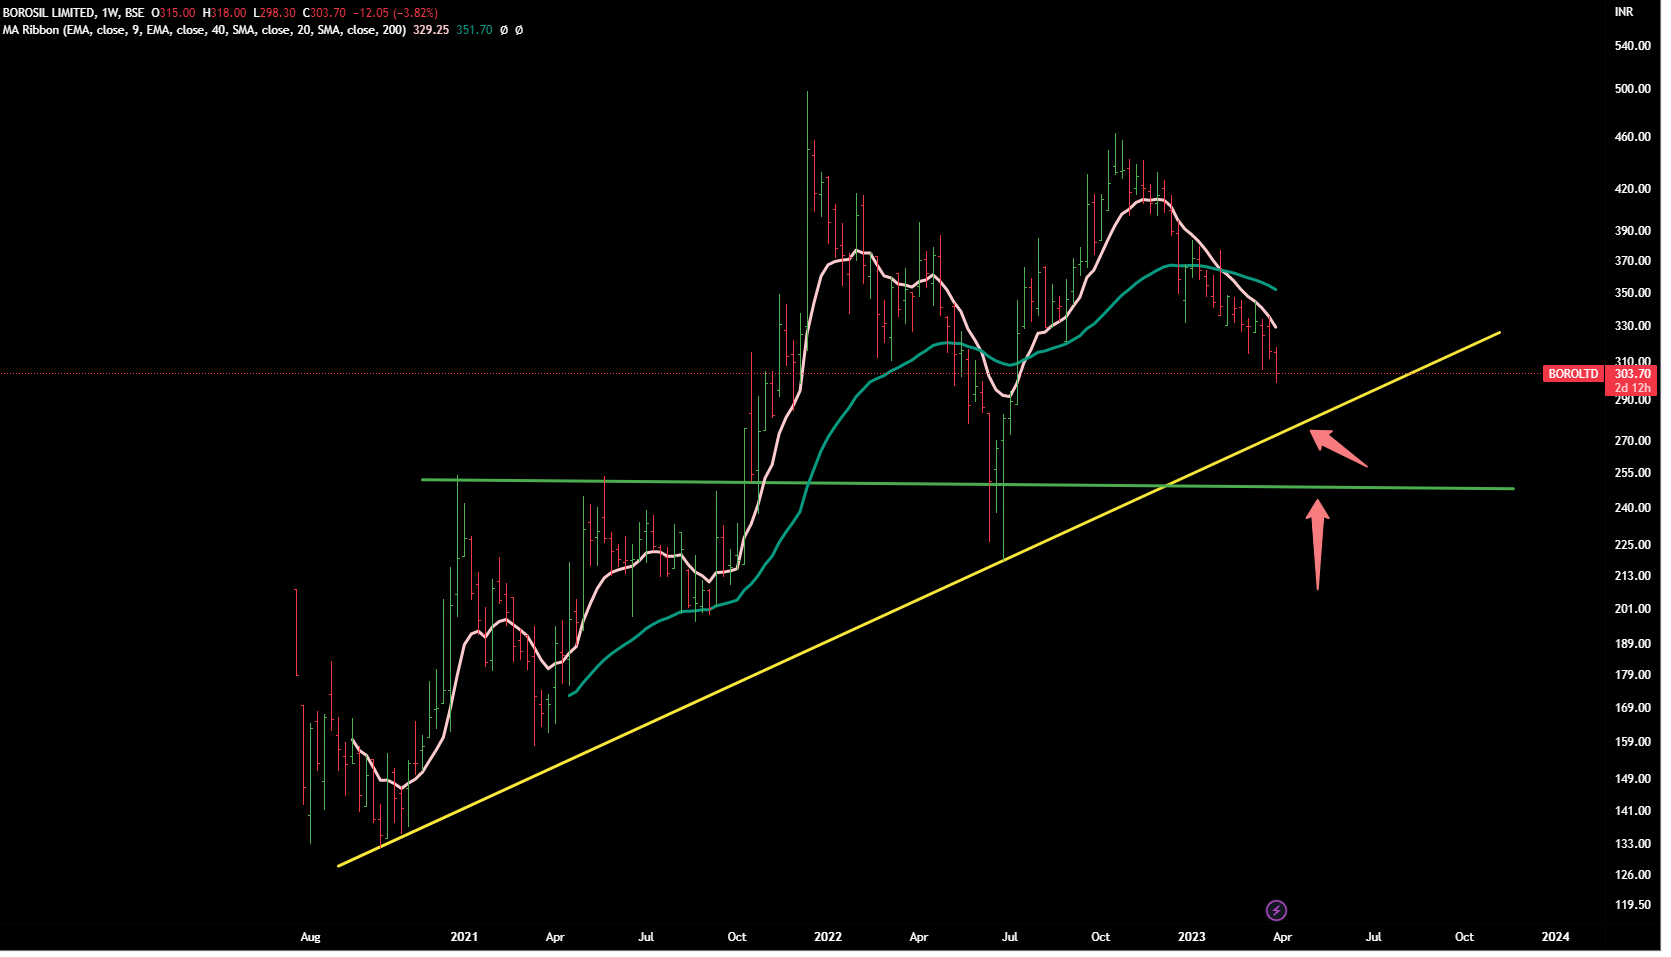
Borosil
CMP 303
It is a falling knofe as of now…clearly a stage 4 stock.
Yellow line is next support near 280-85.
Then green line can stop it near 250-55.
If it crosses these yellow/green lines , then we might head near 200-225.
Weekly Chart
Disclaimer : This post is just a for learning few methods of price-patterns. Views are personal and are purely based on our limited knowledge of charts. No buy/sell recommendations. These are probability study methods and chances of success/failure depend upon various factors
4 Likes
how does aavas financiers and chambal fertilisers looks sir?
If possible. please share your views.
Fundamentally, aavas looks good at these valuations as the current PE is around the same level as of Covid Low PE and median PE for 5 years is also around 60
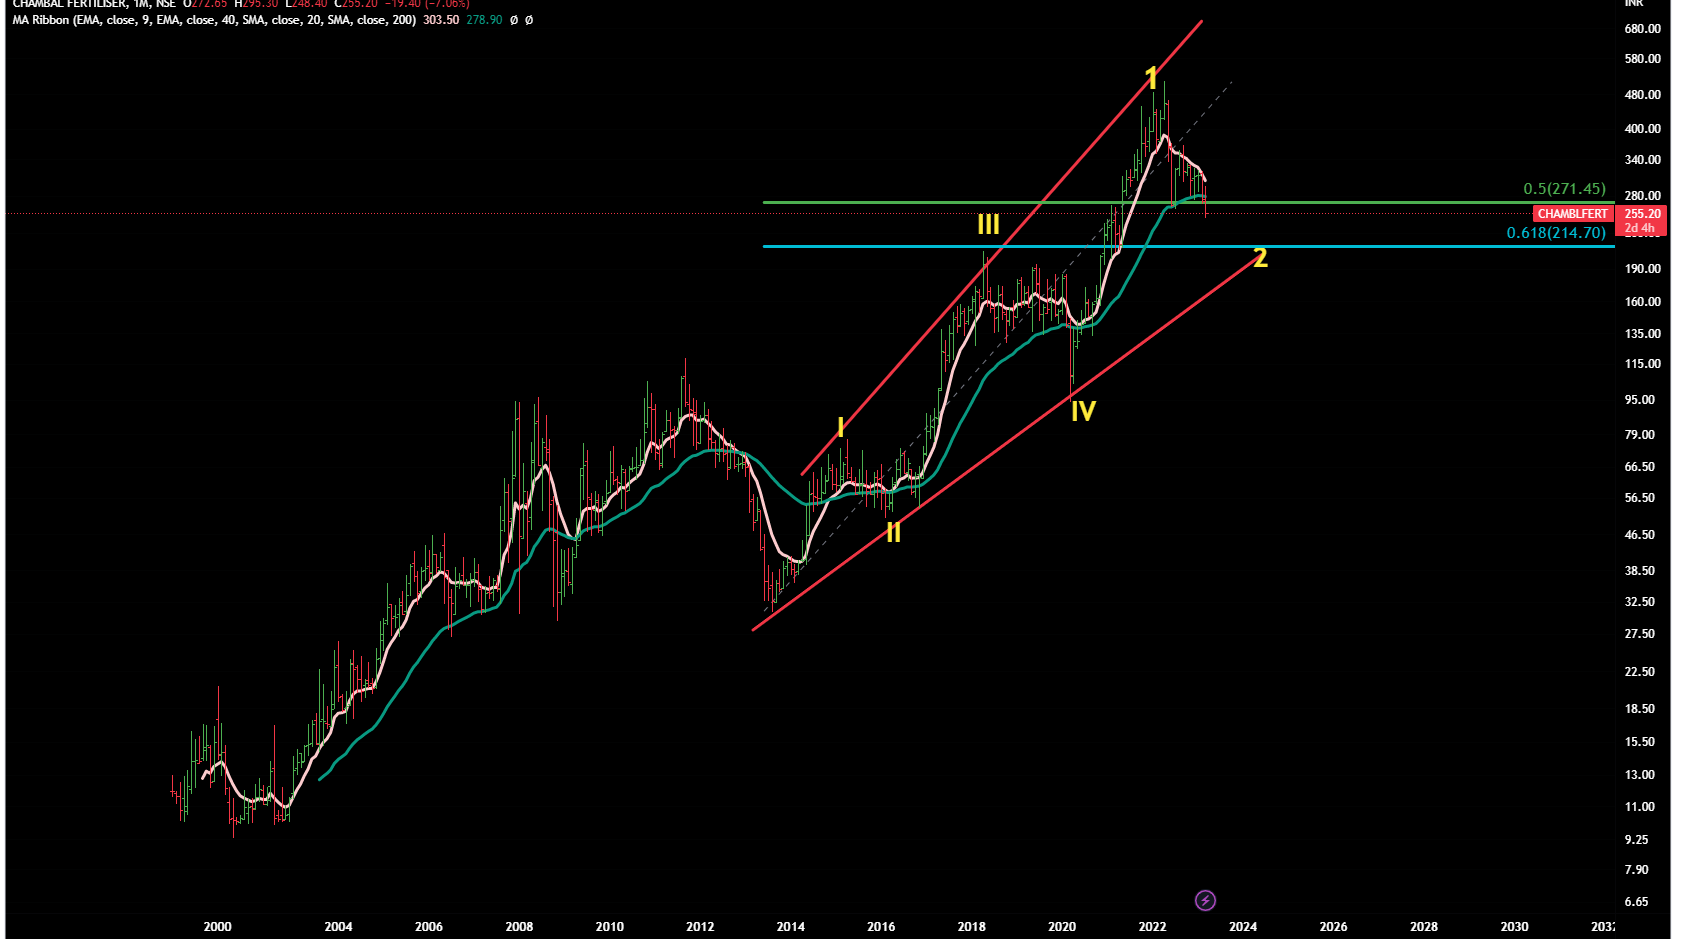
Chambal Fertilisers
CMP 255
It seems to have completed its long term bull run that started in 2014.
Should go down much lower with ups and downs in -between.
Monthly Chart
Disclaimer : This post is just a for learning few methods of price-patterns. Views are personal and are purely based on our limited knowledge of charts. No buy/sell recommendations. These are probability study methods and chances of success/failure depend upon various factors
1 Like
Aavas Financiers
CMP 1615
It is still in correction ( S4) .
If it does not stop at 1540/1550…then it can go down near 1340 at least.
As far as PE is concerned, we think PE can be misleading in many cases.They don’t tell the complete picture of the company and the industry.
Monthly Chart

Disclaimer : This post is just a for learning few methods of price-patterns. Views are personal and are purely based on our limited knowledge of charts. No buy/sell recommendations. These are probability study methods and chances of success/failure depend upon various factors
3 Likes
Stage Analysis of Mphasis and TCI Express? Thanks
TCI Express
CMP 1440
It is clearly in Stage 4 and it seems some more correction can happen although currently it is at a strong support level - 40 MEMA and at lower Bollinger Band on Monthly Chart .
Either it should stop here or it should go near 1260-80 range .
As per EW it is in wave 2 ( wave 1 calculated from Covid lows), at that level , it would be near 61.8% fib level retracement as well as at the wave 4 level of whole rise. Strong stocks tend to stop there.
But whether it can start a big uptred as of now ? Well, that seems difficult --if it does not fall further it might stabilize here in a narrow range for some more time .
Monthly Chart

Disclaimer : This post is just an effort for learning few methods of price-patterns. Views are personal and are purely based on our limited knowledge of charts. No buy/sell recommendations. These are probability study methods and chances of success/failure depend upon various factors
4 Likes
Mphasis
1718
As per stage analysis, it is clearly in Satge 4 as of now.
But if we want to check whether the correction is finally over, we need to resort to EW method.
As per daily chart , it seems to have made a bottom but whether that is a temporary bottom or long term bottom, that needs to be seen and needs few more confirmations.
On monthly chart, it moght close below 40 months moving average in this month + it is making a big red candle and that is not a good sign.
For any stock to really recover and to make a big move, it first needs to close in green on monthly chart and should reclaim the zone above 40 Months moving average.
Let’s keep a close watch on what it does in April.
( we tend to buy stocks at little higher prices but we want confirmations so that we can avoid the traps- bottom fishing can only be done by deep fundamental- analysts)
Monthly Chart

Disclaimer : This post is just an effort for learning few methods of price-patterns. Views are personal and are purely based on our limited knowledge of charts. No buy/sell recommendations. These are probability study methods and chances of success/failure depend upon various factors
2 Likes
We have been sharing long term wave-counts of certain stocks which we like. Just re-posting the recent ones ![]() .
.
Here is another one.
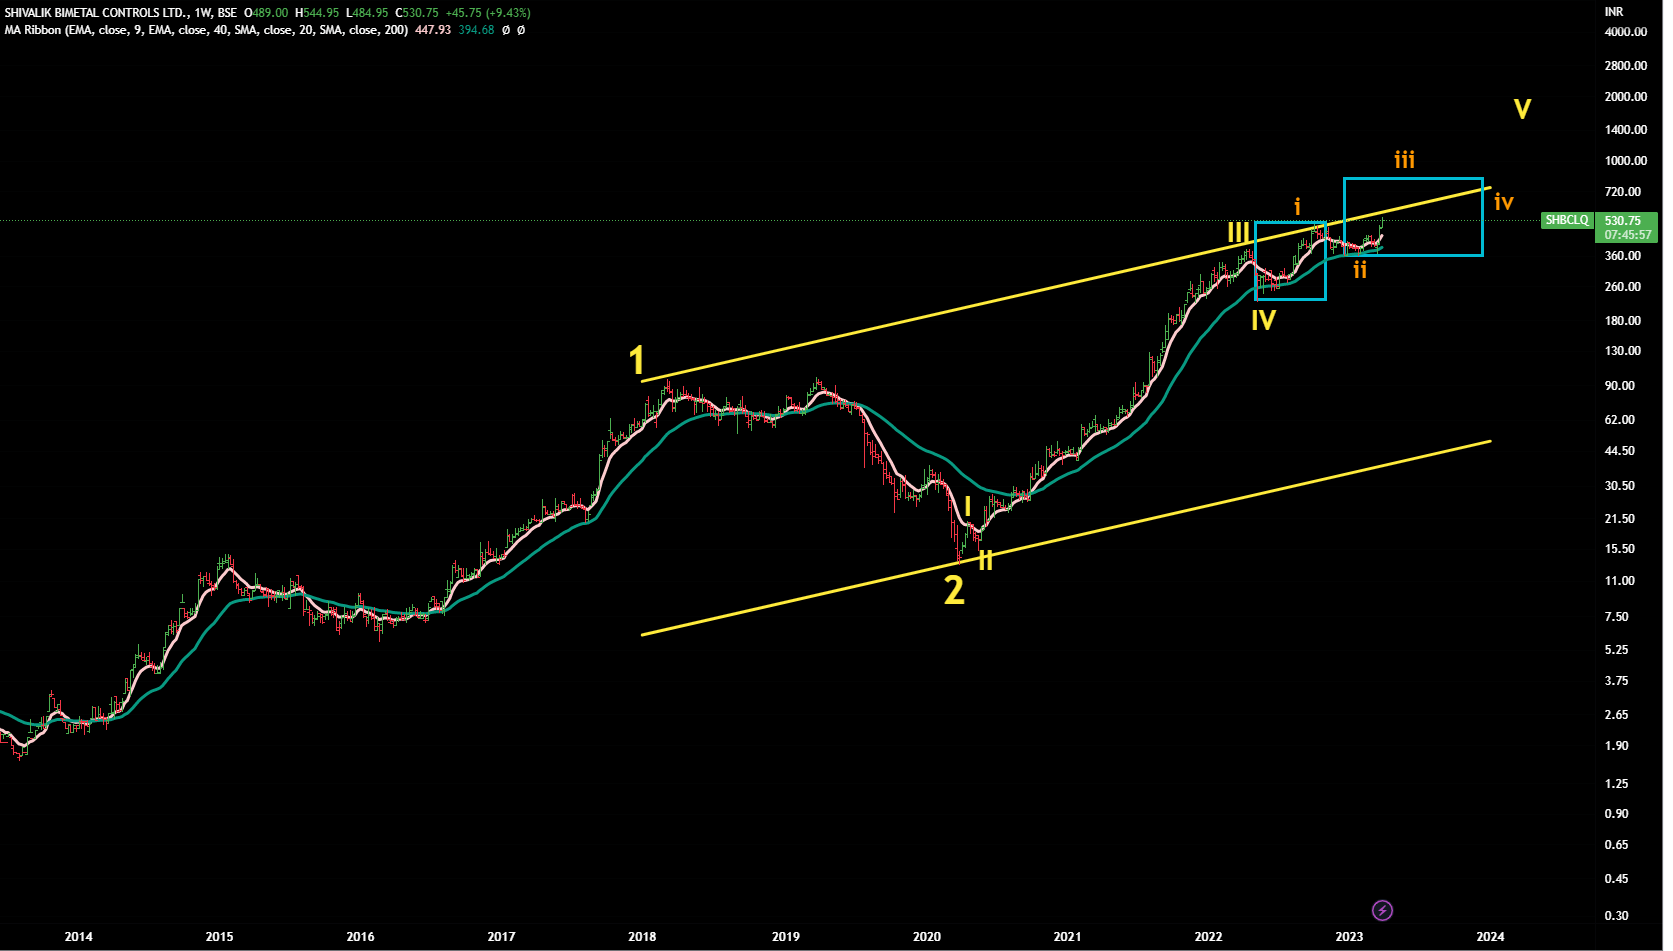
Shivalik Bimetal
CMP -530
Can it go beyond 1500 in coming months/years …well it seems that V th wave of bigger wave 3 is expending.
Let’s keep a watch.
Weekly Chart
Disclaimer : This post is just an effort for learning few methods of price-patterns. Views are personal and are purely based on our limited knowledge of charts. No buy/sell recommendations. These are probability study methods and chances of success/failure depend upon various factors
3 Likes
what is your exit strategy? Is it when it closes below 40 WEMA? In the case of Ge shipping, what would be your SL? Thanks
Our exit stratgey is based on EW counts.
But for common investor, it should depend upon their investment-time-horizon.
For medium term investors (1-2 years), it can be 40 WEMA and for long term investors it can be 40 MEMA. Also one can look at the trend-line breaks .The selection of trend-lines would be again based on time-horizon.
2 Likes
Hi Sir, can you share the chart for RBL Bank
Sorry we don’t analyse what we feel are kachra ( junk) stocks in the market. They may go up or down !
There are so many trustworthy and beautiful businesses (even among banks) , hence we tend to spend our energy in solid enterprises .
Really sorry.
2 Likes
I completely agree with you. Was trying to figure the reason why Zerodha and a few others would take position in such a stock.
Sir… we go with our own independent process. Don’t want to share anything here where our own conviction is absent.
पैसा कमाना है नींद थोड़े ही गवानी है ![]()
4 Likes
Hello,
Can you just check HG Infra and let me know whether its in stage 2?
HG Infra
CMP 782
Yes it is in stage 2 but at an important resistance level.
Once it breaks that resistance , it go up little more.
But we will keep the expectations low as it might malke the last leg of the upmove (though we won’t bet on it) .
Stock has become 6 -7 x from Covid lows , and they’re not in some cutting edge technology sector that it would make 15 or 20 X.
Weekly Chart

Disclaimer : This post is just an effort for learning few methods of price-patterns. Views are personal and are purely based on our limited knowledge of charts. No buy/sell recommendations. These are probability study methods and chances of success/failure depend upon various factors
5 Likes