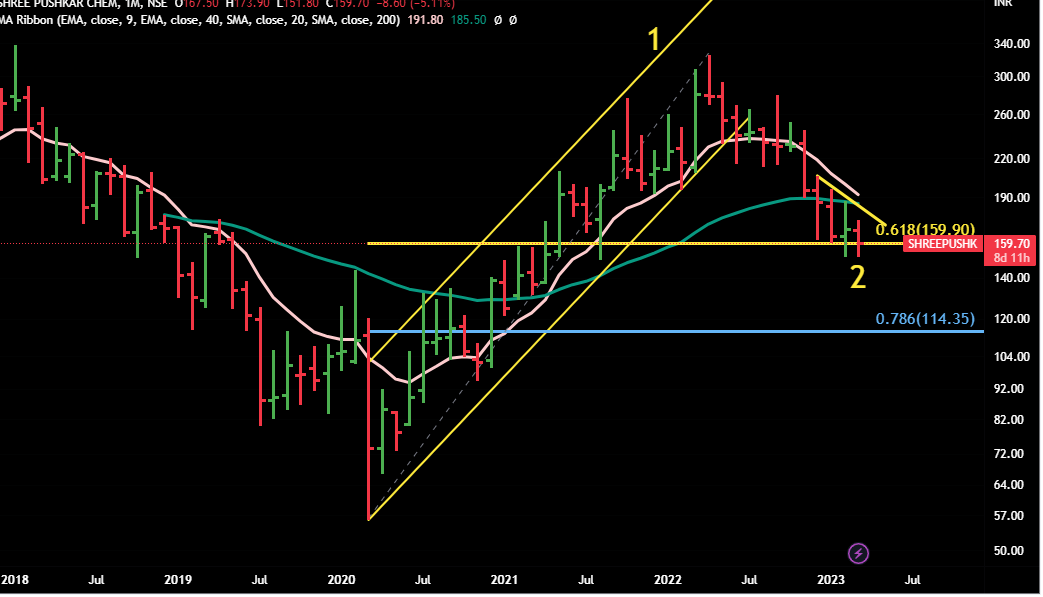
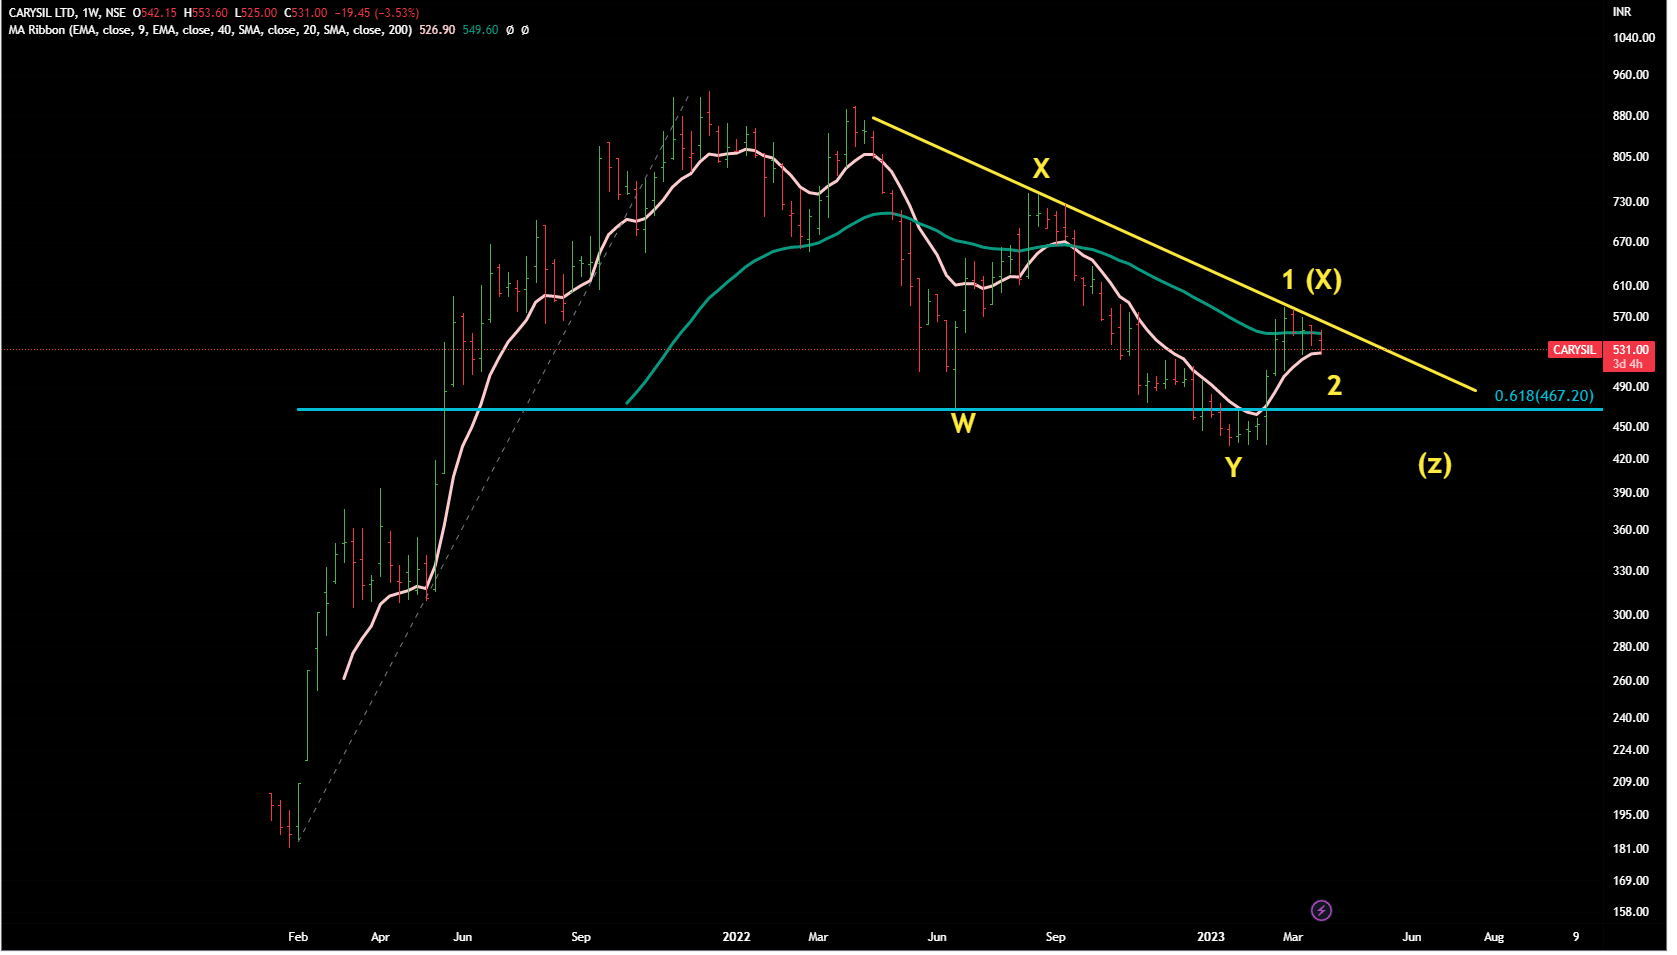
Hard to say whether the correction is over although it is at a crucial stage . It is taking support at 61.8% retracement level of the whole rise during wave 1.
It might consolidate more here . Upside momentum is yet to be seen.
But in case it starts falling down further , then it can go up to 78.6 5 retracement levels.
Disclaimer :This post is just a for learning few methods of price-patterns. Views are personal and are purely based on our limited knowledge of charts. No buy/sell recommendations. These are probability study methods and chances of success/failure depend upon various factors
Disclaimer :This post is just a for learning few methods of price-patterns. Views are personal. No buy/sell recommendations. These are probability study methods and chances of success/failure depend upon various factors
Disclaimer :This post is just a for learning few methods of price-patterns. Views are personal and are purely based on our limited knowledge of charts. No buy/sell recommendations. These are probability study methods and chances of success/failure depend upon various factors
But sorry to say that we don’t track compounder-type of stocks unless there are black-swan events ( Covid type of falls) and we can get them at very low prices for long term holding.
Hi sir,
The site shared for learning stage analysis seems down (Venus Alpha Capital) from the past week. Can you pls share some alternate link if atol??
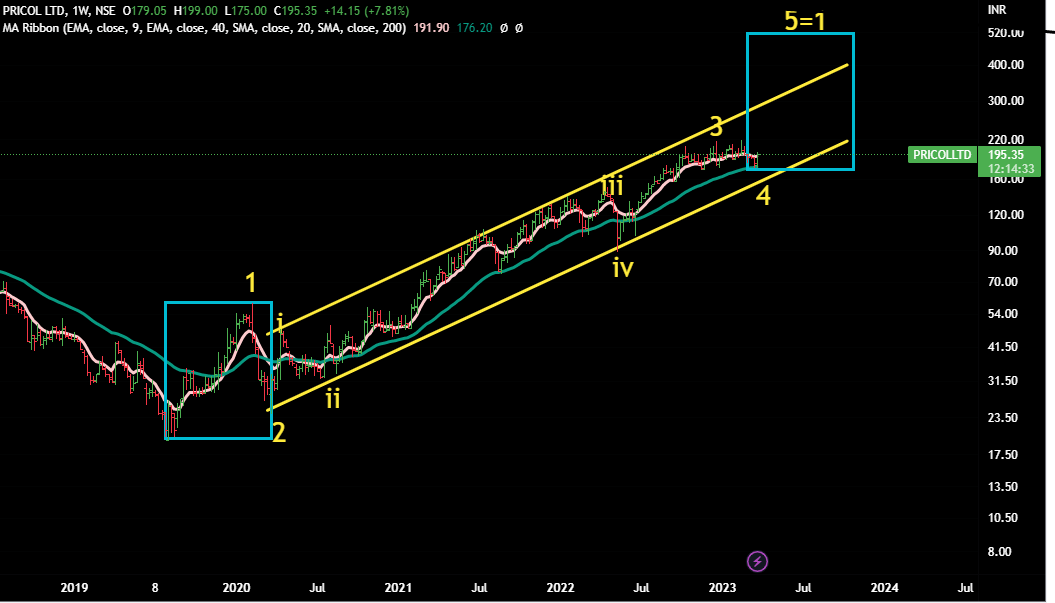
Well in this kind of price -movement , we resort to EW.
While it is giving all signals of upside, but EW makes us sceptical as recent rise seems to be corrective ( no impulse is visible)
Many a times stocks keep moving up even in corrective waves ( though we stay away from them) . In this case, keep a watch on yellow lines, these may act as resistance. Weekly Chart
Disclaimer :This post is just a for learning few methods of price-patterns. Views are personal and are purely based on our limited knowledge of charts. No buy/sell recommendations. These are probability study methods and chances of success/failure depend upon various factors
@StageInvesting This is a post of gratitude. I asked a question on this group about certain stocks where I trusted your analysis and went through the reading material that you suggested and fortunately, I saved a lot of value from eroding in my account. Thanks a lot for this unconditional help to this page!
We recall the above reply to you to your queries in Feb .
But even we did not think that our projection would become true with -in 40 days.
Samrat - went down from 612 to 370
Kopran - went from 124 to 100
Borosil Renewables - down from 503 to 411
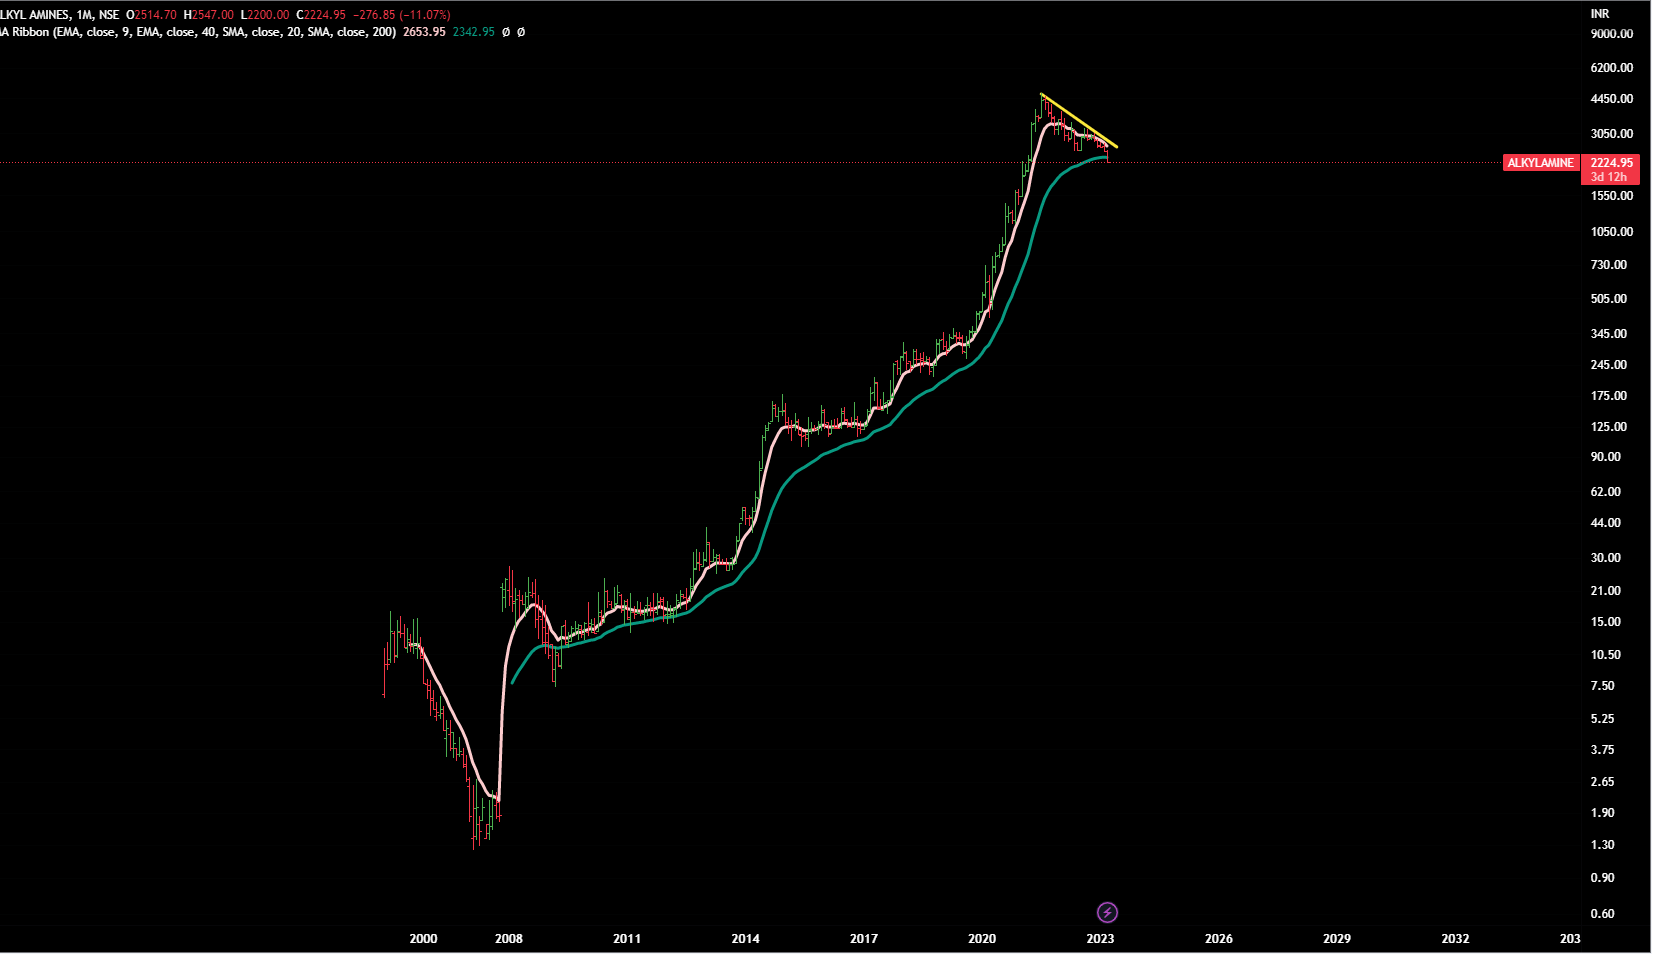
Can you please share your views on Alkyl Amines. It has been corrected from 3500 to present level in a painful grind. What stage it is now and up to what level it can decline.
Company was in bull run for several years and is correcting now.
It is likely to close below 40 MEMA this month , that makes it more vulnerable.
These type of corrections are either deep or take lot of time ( time correction ) or both.
If we were looking at this compnay, we would stay away from it for months.
And don’t look at the price from the top, check it from where it has risen ! That would chenge your prespective… three years back it was near 300 and it is at 2200 levels now …still >7X thus lot of scope to go down. Monthly Chart
Disclaimer :This post is just a for learning few methods of price-patterns. Views are personal and are purely based on our limited knowledge of charts. No buy/sell recommendations. These are probability study methods and chances of success/failure depend upon various factors
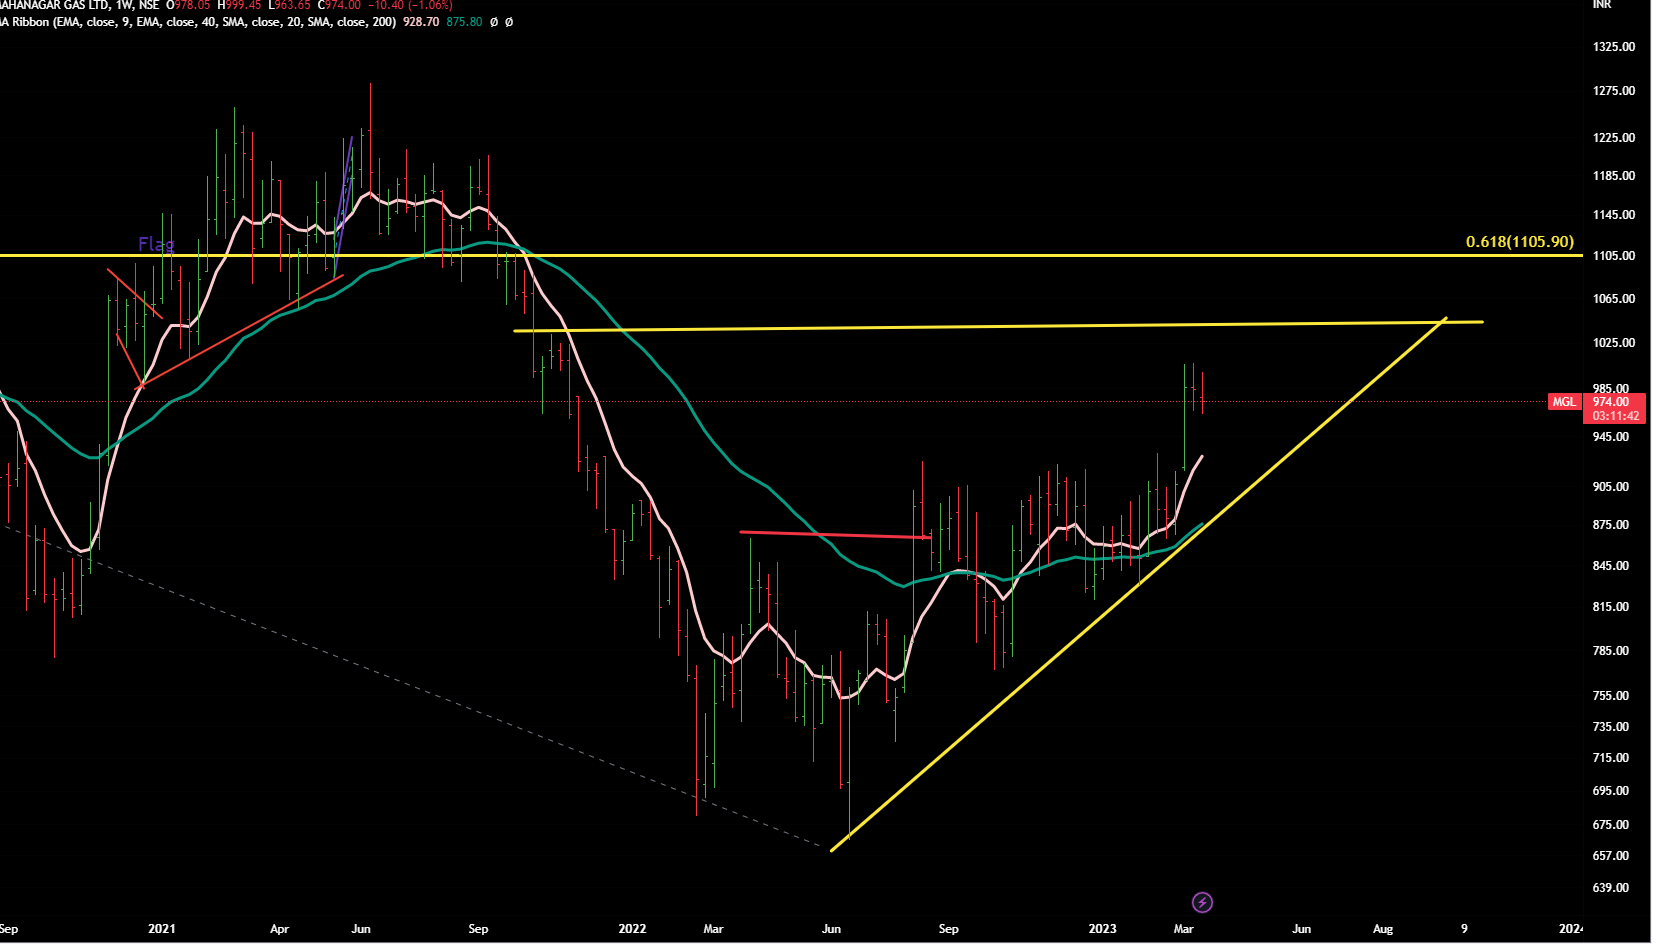
But if it is really next big wave…we need few confirmations as we move forward … ideal way to ride is to add small positions as one keeps getting confirmations but exit of it starts closing below 40 WEMA
a) Should cross and close above trading range (yellow line) on few weekends
b) Should cross and close above 61.85 retracement (pink line) on few weekends
c)Should cross and close above previous ATH on few weekends Weekly Chart
Disclaimer : Invested and biased.This post is just a for learning few methods of price-patterns. Views are personal and are purely based on our limited knowledge of charts. No buy/sell recommendations. These are probability study methods and chances of success/failure depend upon various factors
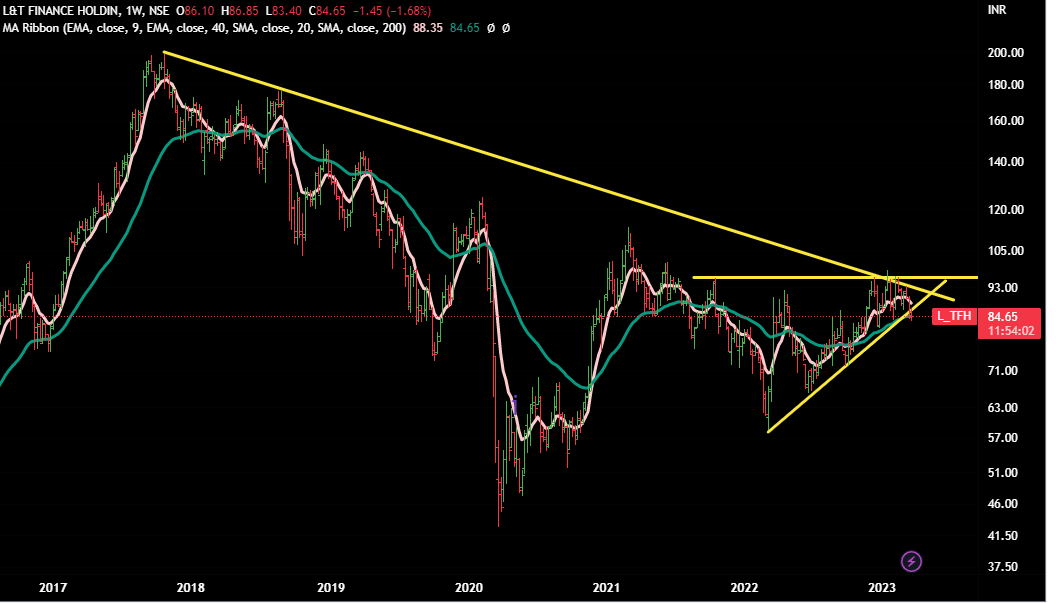
We had covered it when it was above 700 in June 22.
What Now ?
THIS IS REALLY TRICKY ONE.
Need more time to be sure of the likely path .
If it breaks and closes above the falling trend line (yellow-line) for few weeks, we might consider that the correction is over and it can re-start its upward journey.
But if it does not, then we’re going towards Z (at least)
Disclaimer : This post is just a for learning few methods of price-patterns. Views are personal and are purely based on our limited knowledge of charts. No buy/sell recommendations. These are probability study methods and chances of success/failure depend upon various factors