
Hello sir, What do you think about Reliance Industries chart, seems to on the decline but i see it has a lot of support points. I know you don’t comment on Nifty or any index but Reliance and Nifty share similar fate usually. Thanks
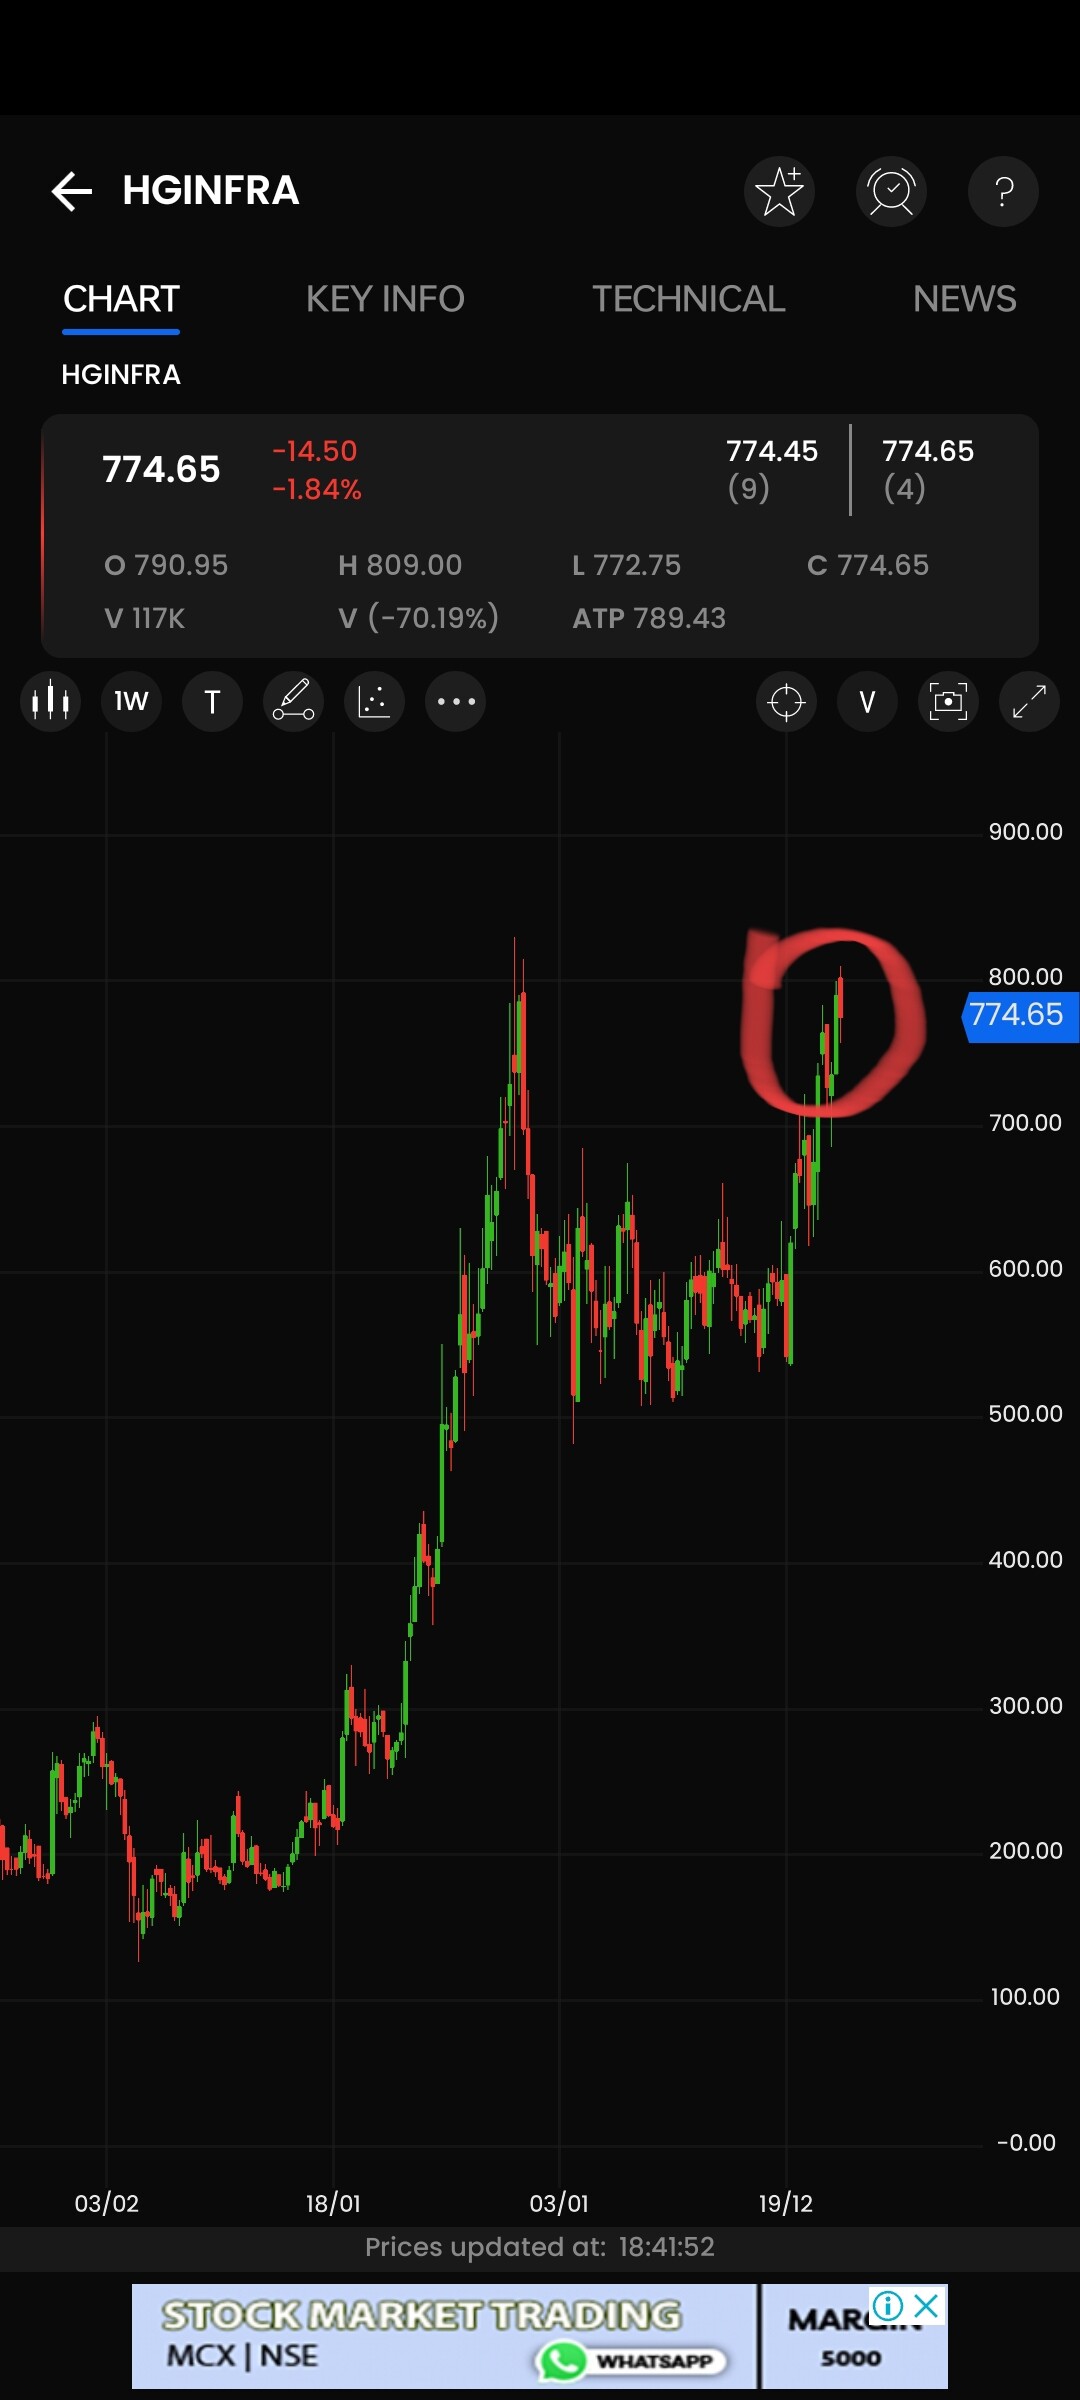

I told about chart patterns of mentioned stocks…it looks like HGinfra will follow the path KPIT already travelled. Ofcourse stocks are from different sectors…Happy to review after couple of months
Hi
We keep a watch on Nifty but we just don’t share our views as we don’t trade in Nifty as we don’t want encourage the same .
Our approach is to focus on indvidual stocks - keep studying the findamantals and jump in whenever the right set-up and right valuations are there.
On Reliance, we have mixed views - either we’re near to the end of the correction
Wheneve the Z ends and it should happen soon as we’re getting near oversold zone.
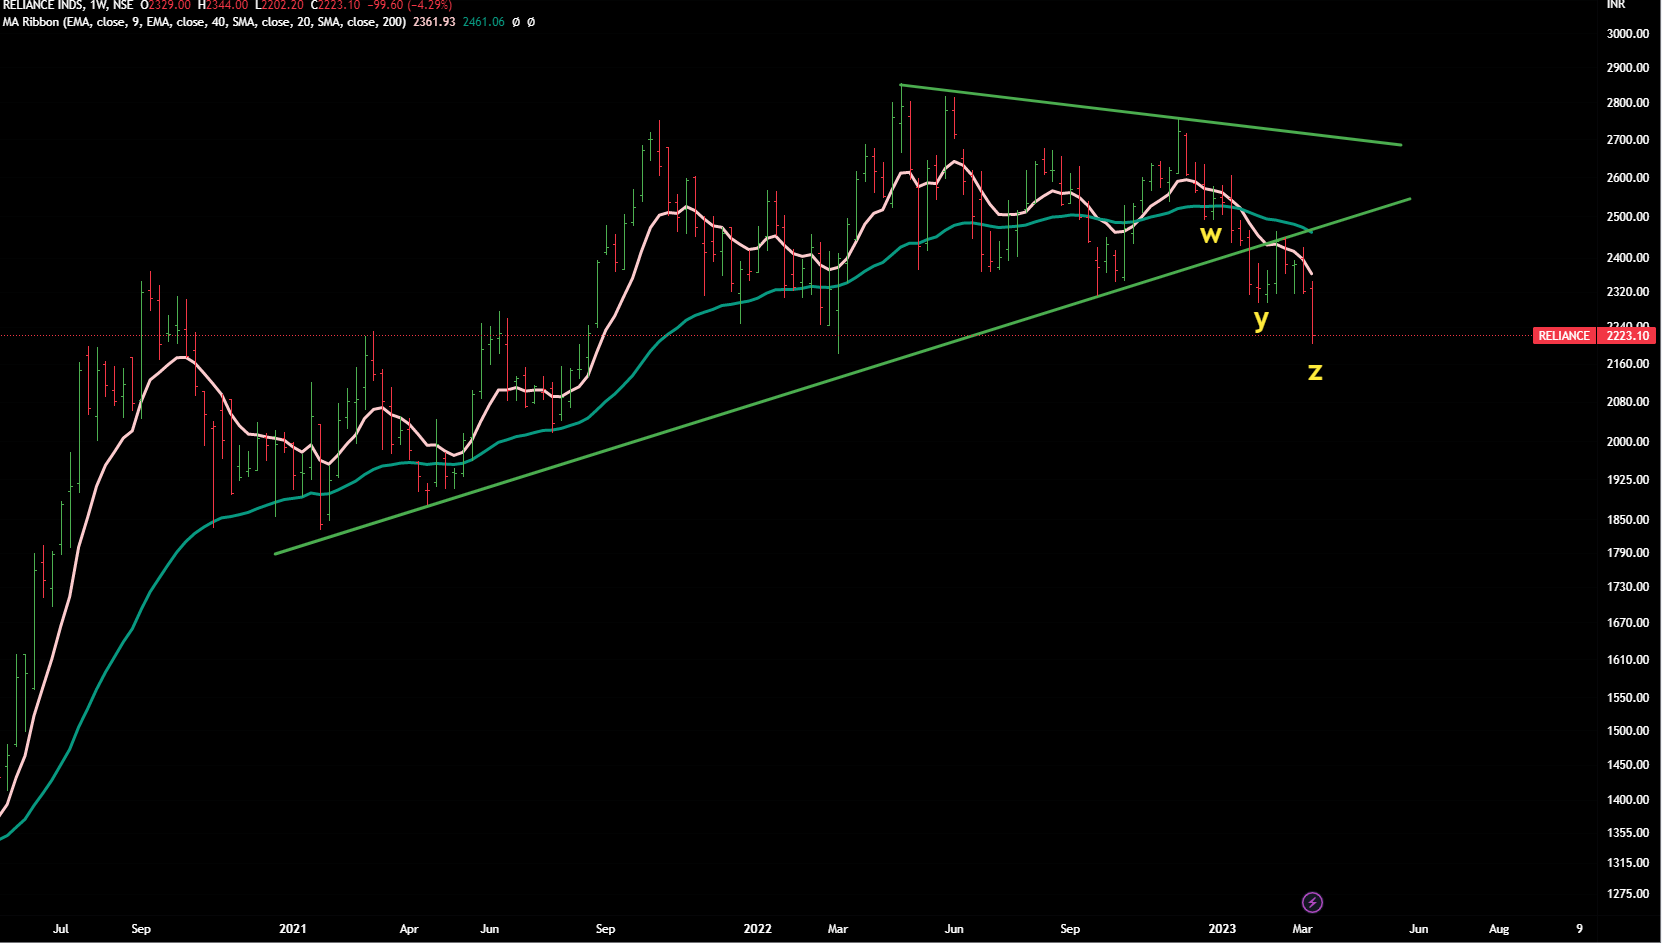
On the other hand if we keep extending this fall, next stop can be near 2150 .
Disclaimer :This post is just a for learning few methods of price-patterns. Views are personal and are purely based on our limited knowledge of charts. No buy/sell recommendations. These are probability study methods and chances of success/failure depend upon various factors
3 Likes
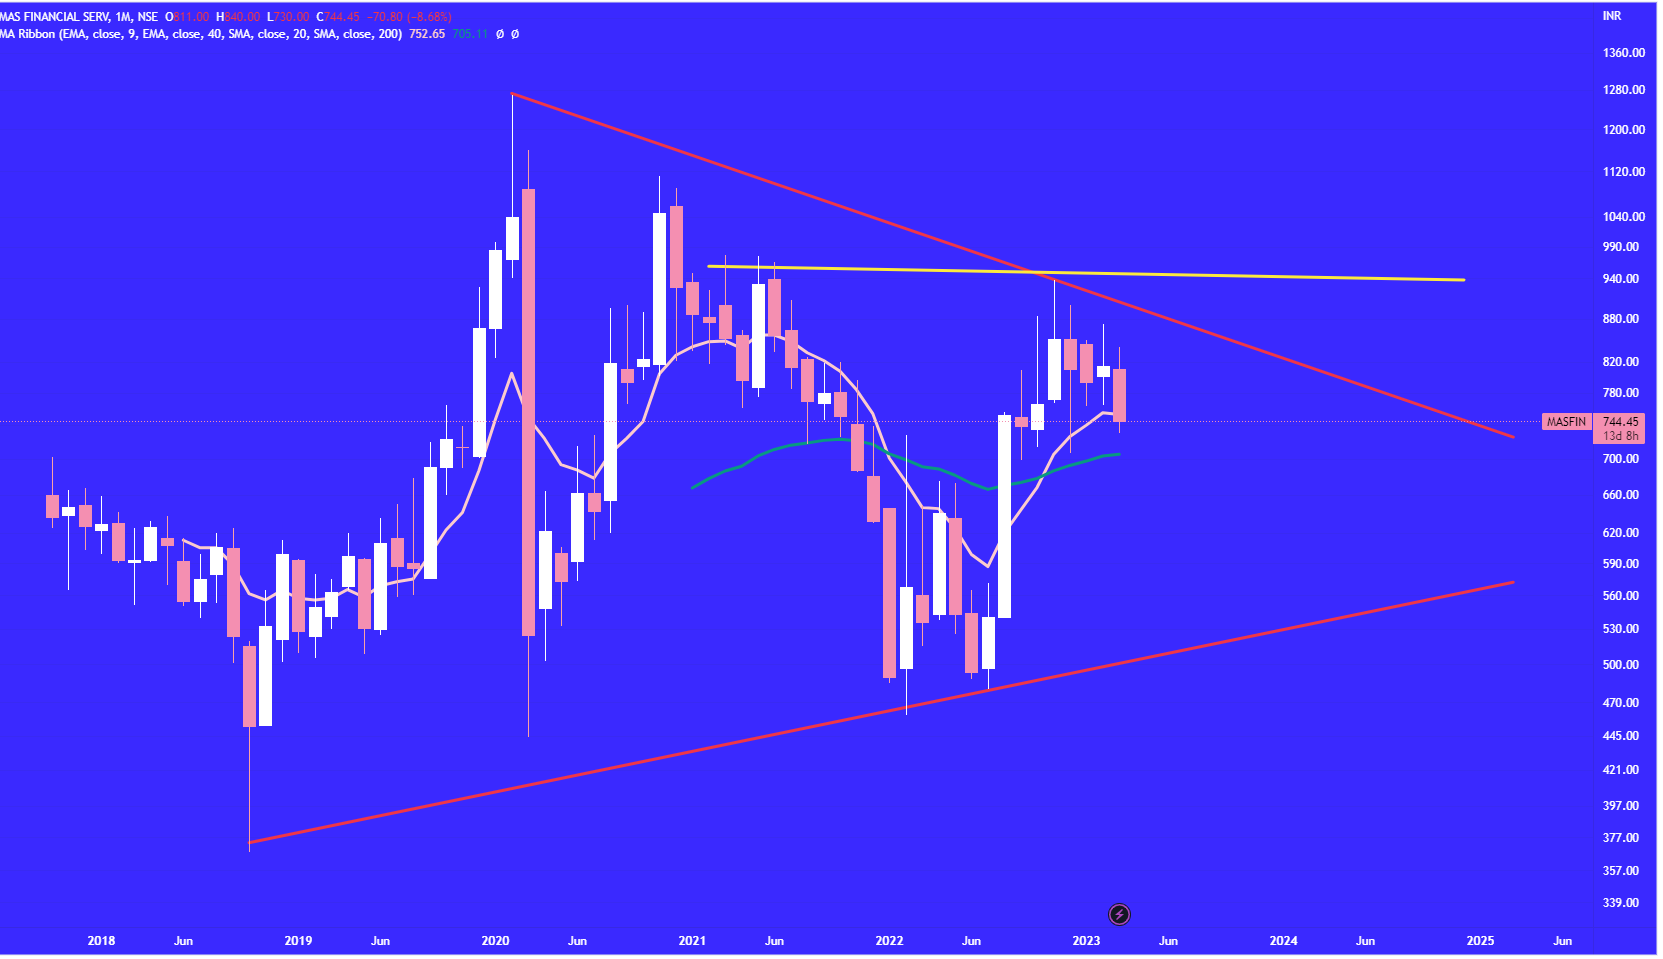
MAS Financials
CMP 745
As of now we don;t see any ray of hope for upside in this one rather it can correct further.
One can only expect any big upside once it starts crossing and closing baove 940-950 range .
Monthly Chart
Disclaimer :This post is just a for learning few methods of price-patterns. Views are personal and are purely based on our limited knowledge of charts. No buy/sell recommendations. These are probability study methods and chances of success/failure depend upon various factors
2 Likes
Gold -Follow-up
CMP 59783
As we shared several times that we’re bullish on gold and we think that current full wave (i,ii,iii,iv,v) can take it near or beyond 70000 in coming months .
Currently it seems to be in iii rd wave . And as a start we are assuming that this iii wave would be equal to wave i.
Final destination of this full wave can only be determined once the wave iii rd and wave iv end.
Gold went up near 3.68 % overnight.
Generally movement in this asset is not vert fast but iiird waves are considered to be faster than i and v.
Daily Chart

Disclaimer :This post is just a for learning few methods of price-patterns. Views are personal and are purely based on our limited knowledge of charts. No buy/sell recommendations. These are probability study methods and chances of success/failure depend upon various factors
6 Likes
Hello,
Is technical analysis more important for large caps or small caps? In which case can it be applied better.
Thanks
@StageInvesting NIFTY PSE is trading near highs and has shown resilience in the last 2 falls. In addition, it seems to be in Stage 2. Can we have a continuation buy in this segment right? What are your thoughts?

2 Likes
@StageInvesting , Sir your view on Stylam Industries - This is in time correction mode for long time.
Gold/usd rises when interest rates fall and falls when interest rates rises
Isn’t it better to do an elliot wave on 10y yield instead ?
I understand your elliot wave count is on gold/inr and your position in gold is likely protected by a sort of insurance that if usd rises, it will rise against both gold and inr so there is some protection there however the rise of gold has been against both usd and rupee so is that protection likely to hold in case gold falls.
Just trying to understand
Hi- would like to say that please go through the aricle again and apply all parmeters.There are no short-cuts in life (or investing) that would take you far.
Technical anaysis involves price as well as volume. Hence trading volume is a critical parameter to judge any stock in context of technical -analysis.
Especially EW is based on mass behaiour wrt to fear/greed/eupohiria - hence if masses are not participating in certain trade then EW method does not work .
2 Likes
You’re partially right.
There are several angles that one should check for Gold movement . The following are critical :
a) DXY chart
b) USD/INR chart
c) Gold chart in USD
d) Precious Metals chart
e) Interest rates and yields.
Currently all charts support the wave -count of Gold chart in INR. ( will update if the pattern changes)
For this week, we might see a small dip (smaller wave ii in minor wave III ) before the next leg of upward journey starts.
Did not want to put everything here as that may complicate the whole thesis for those people who’re new to technical analysis.
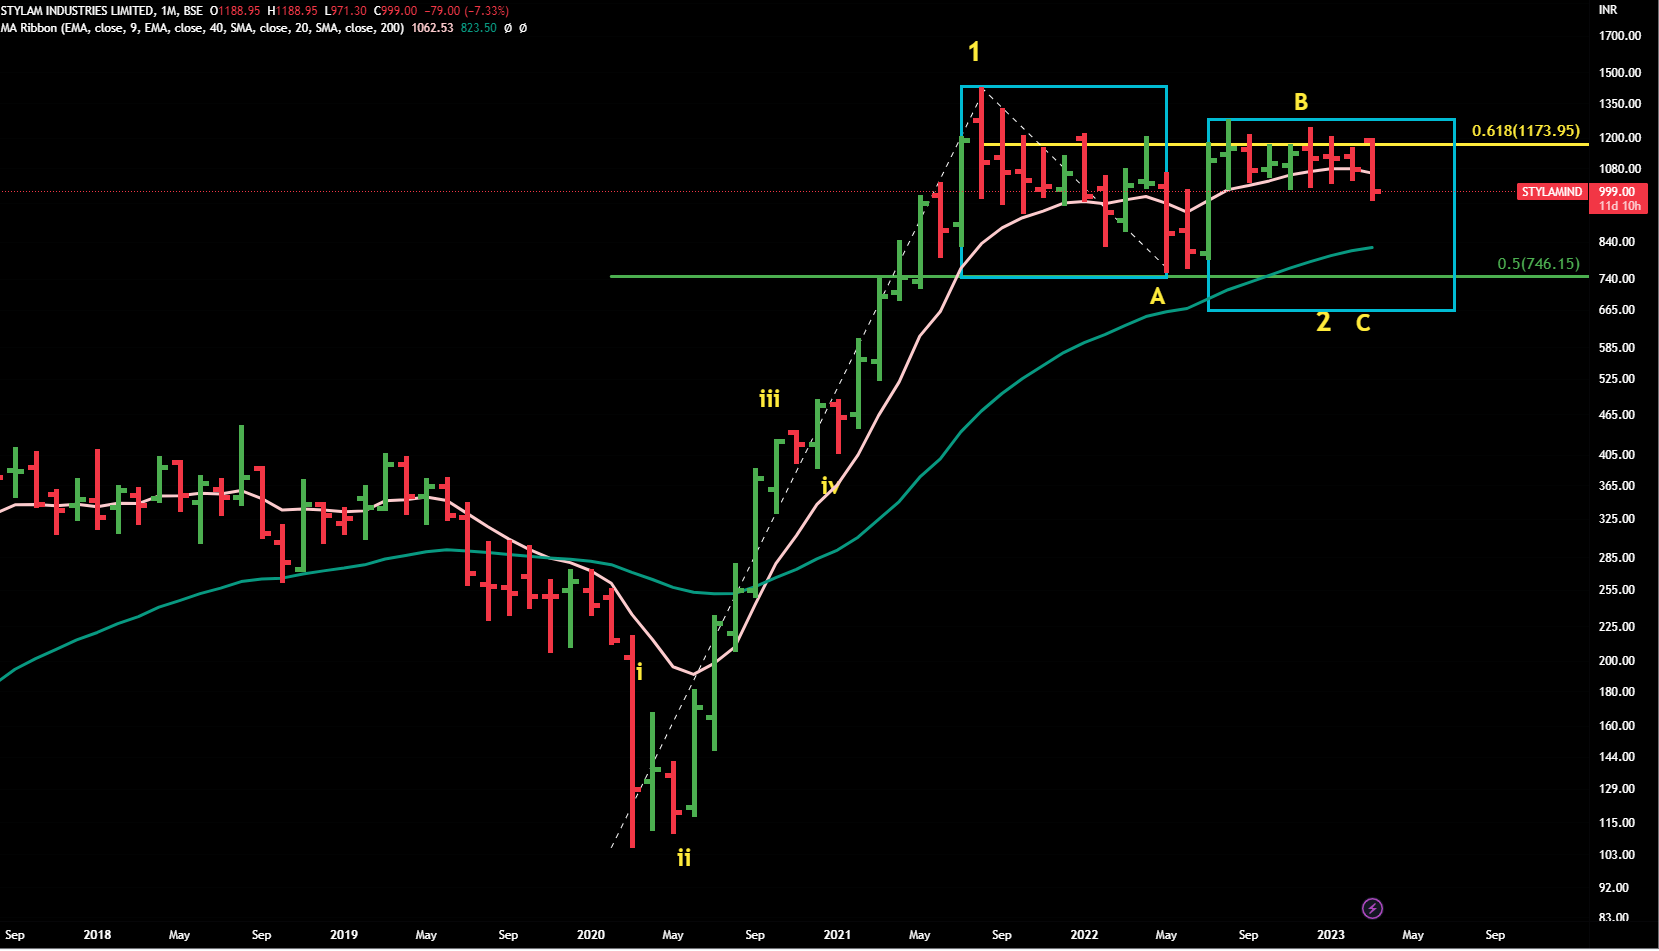
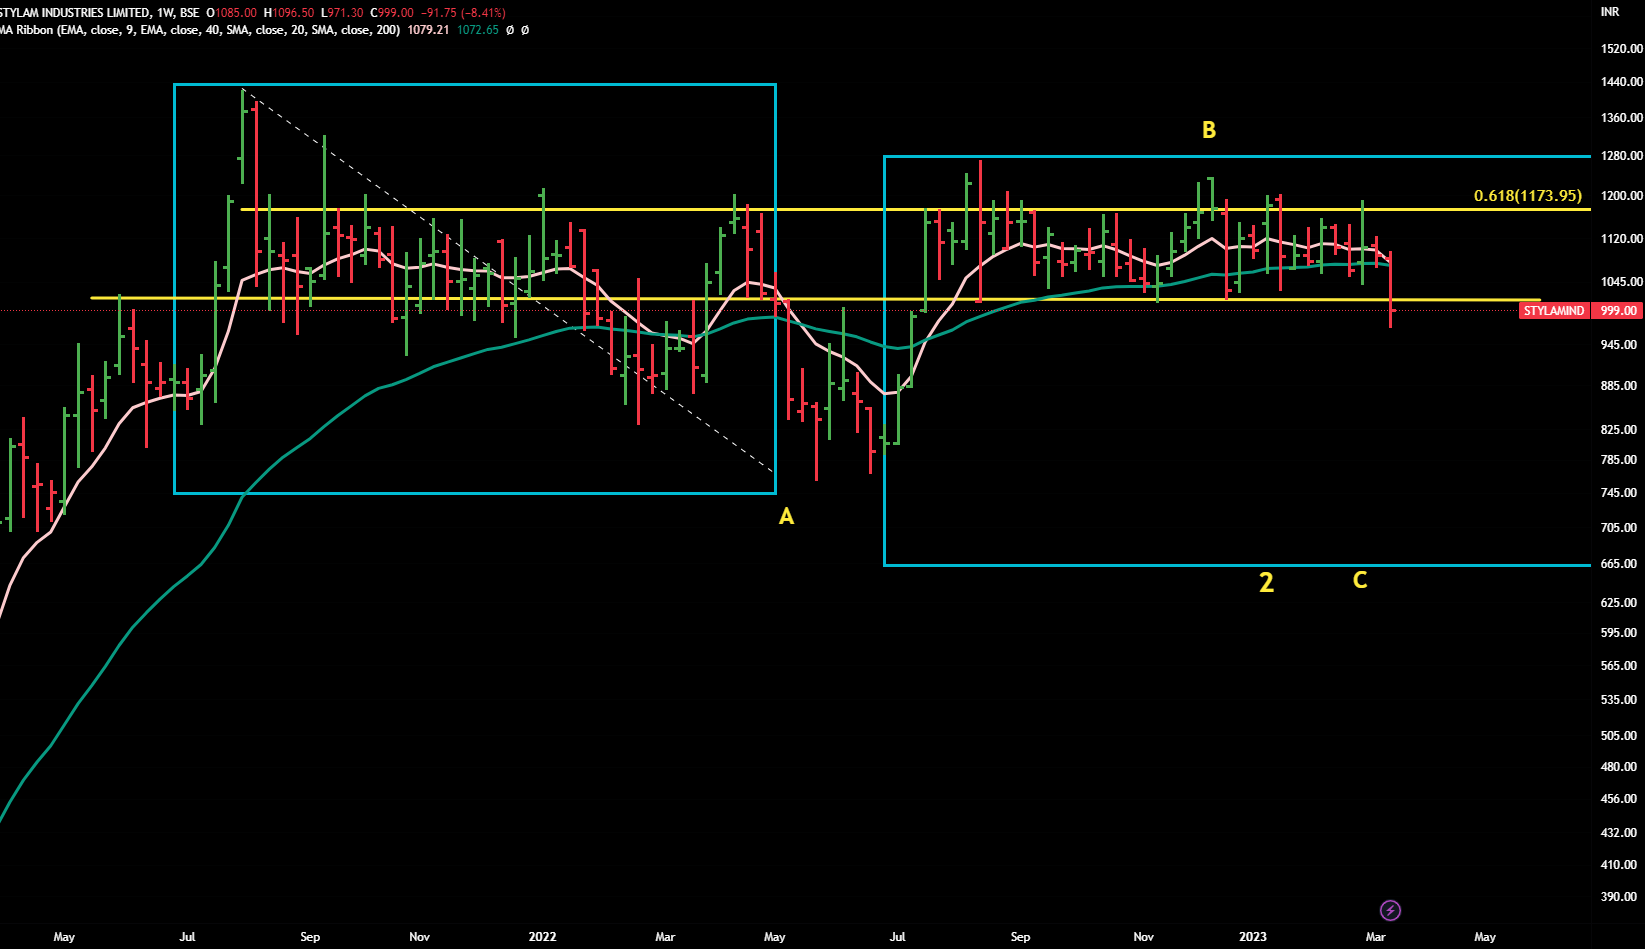
Stylam Industry
CMP 999
It seems that we’re still in bigger wave 2 ( stage 4 ) .
The stock corrected in wave A and bounced back but could not close above 61.8% Fib retracement of whole fall (upper yellow line). Hence we can assume that it was a wave B bounce and wave C is going on.
Monthly Chart
On weekly chart, it broke down the trading range of last few months (area beteen the yellow-lines) .Also 9 WEMA is crossing below the 40 WEMA. Hence as per stage analysis , we can assume that further correction is due in coming weeks/months.
For any sustainable upward move in short period , it should cross and close above the upper yellow-line in current set-up.
Weekly Chart
Disclaimer :This post is just a for learning few methods of price-patterns. Views are personal and are purely based on our limited knowledge of charts. No buy/sell recommendations. These are probability study methods and chances of success/failure depend upon various factors
1 Like
Analysis of mold-tek packaging
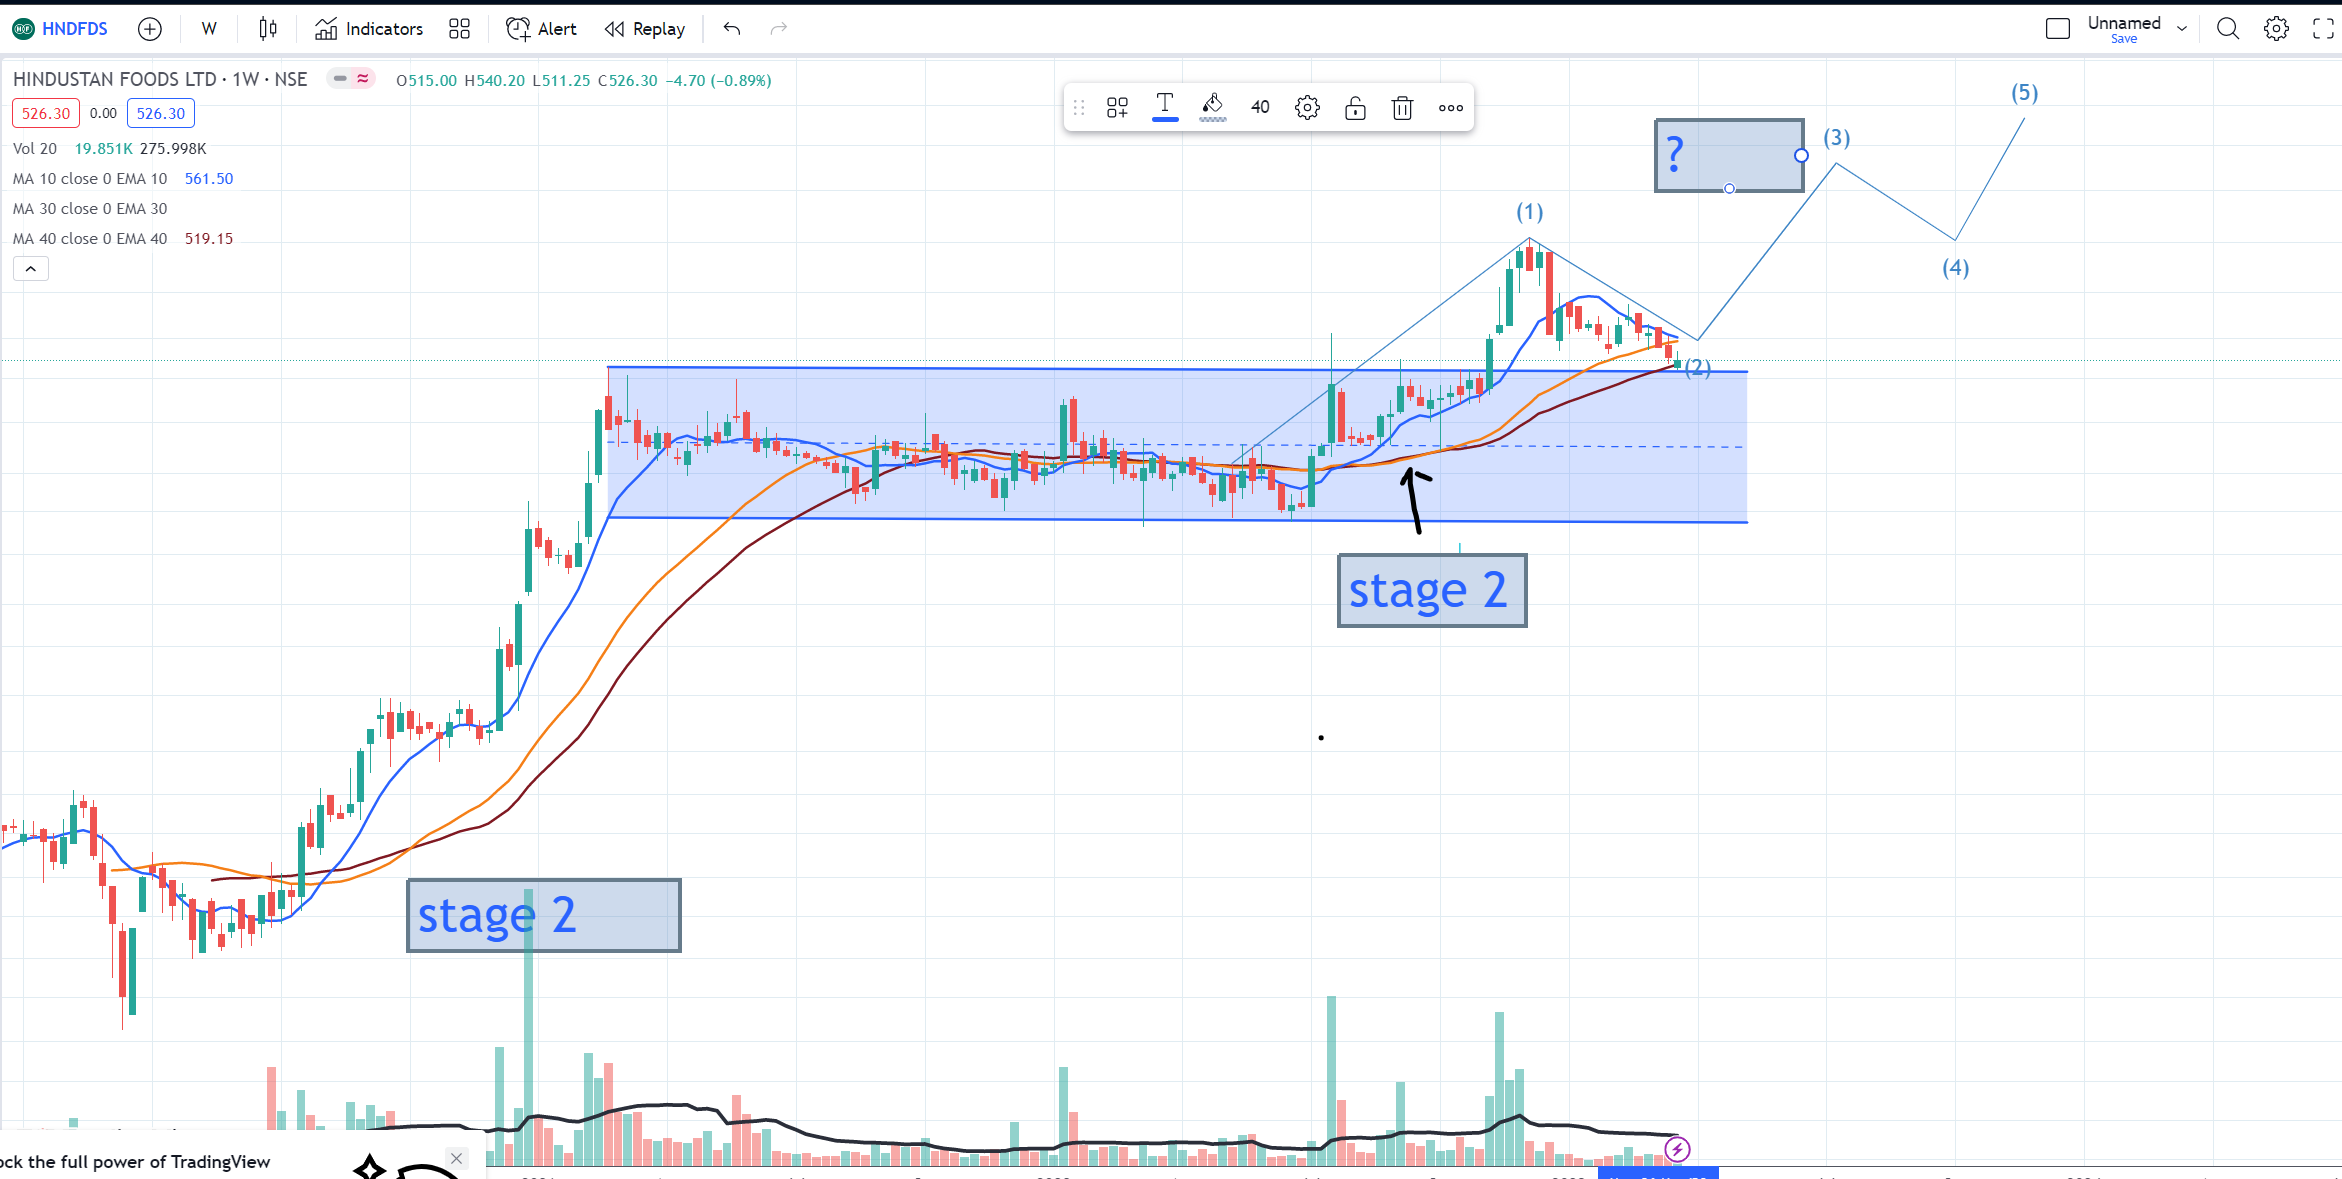
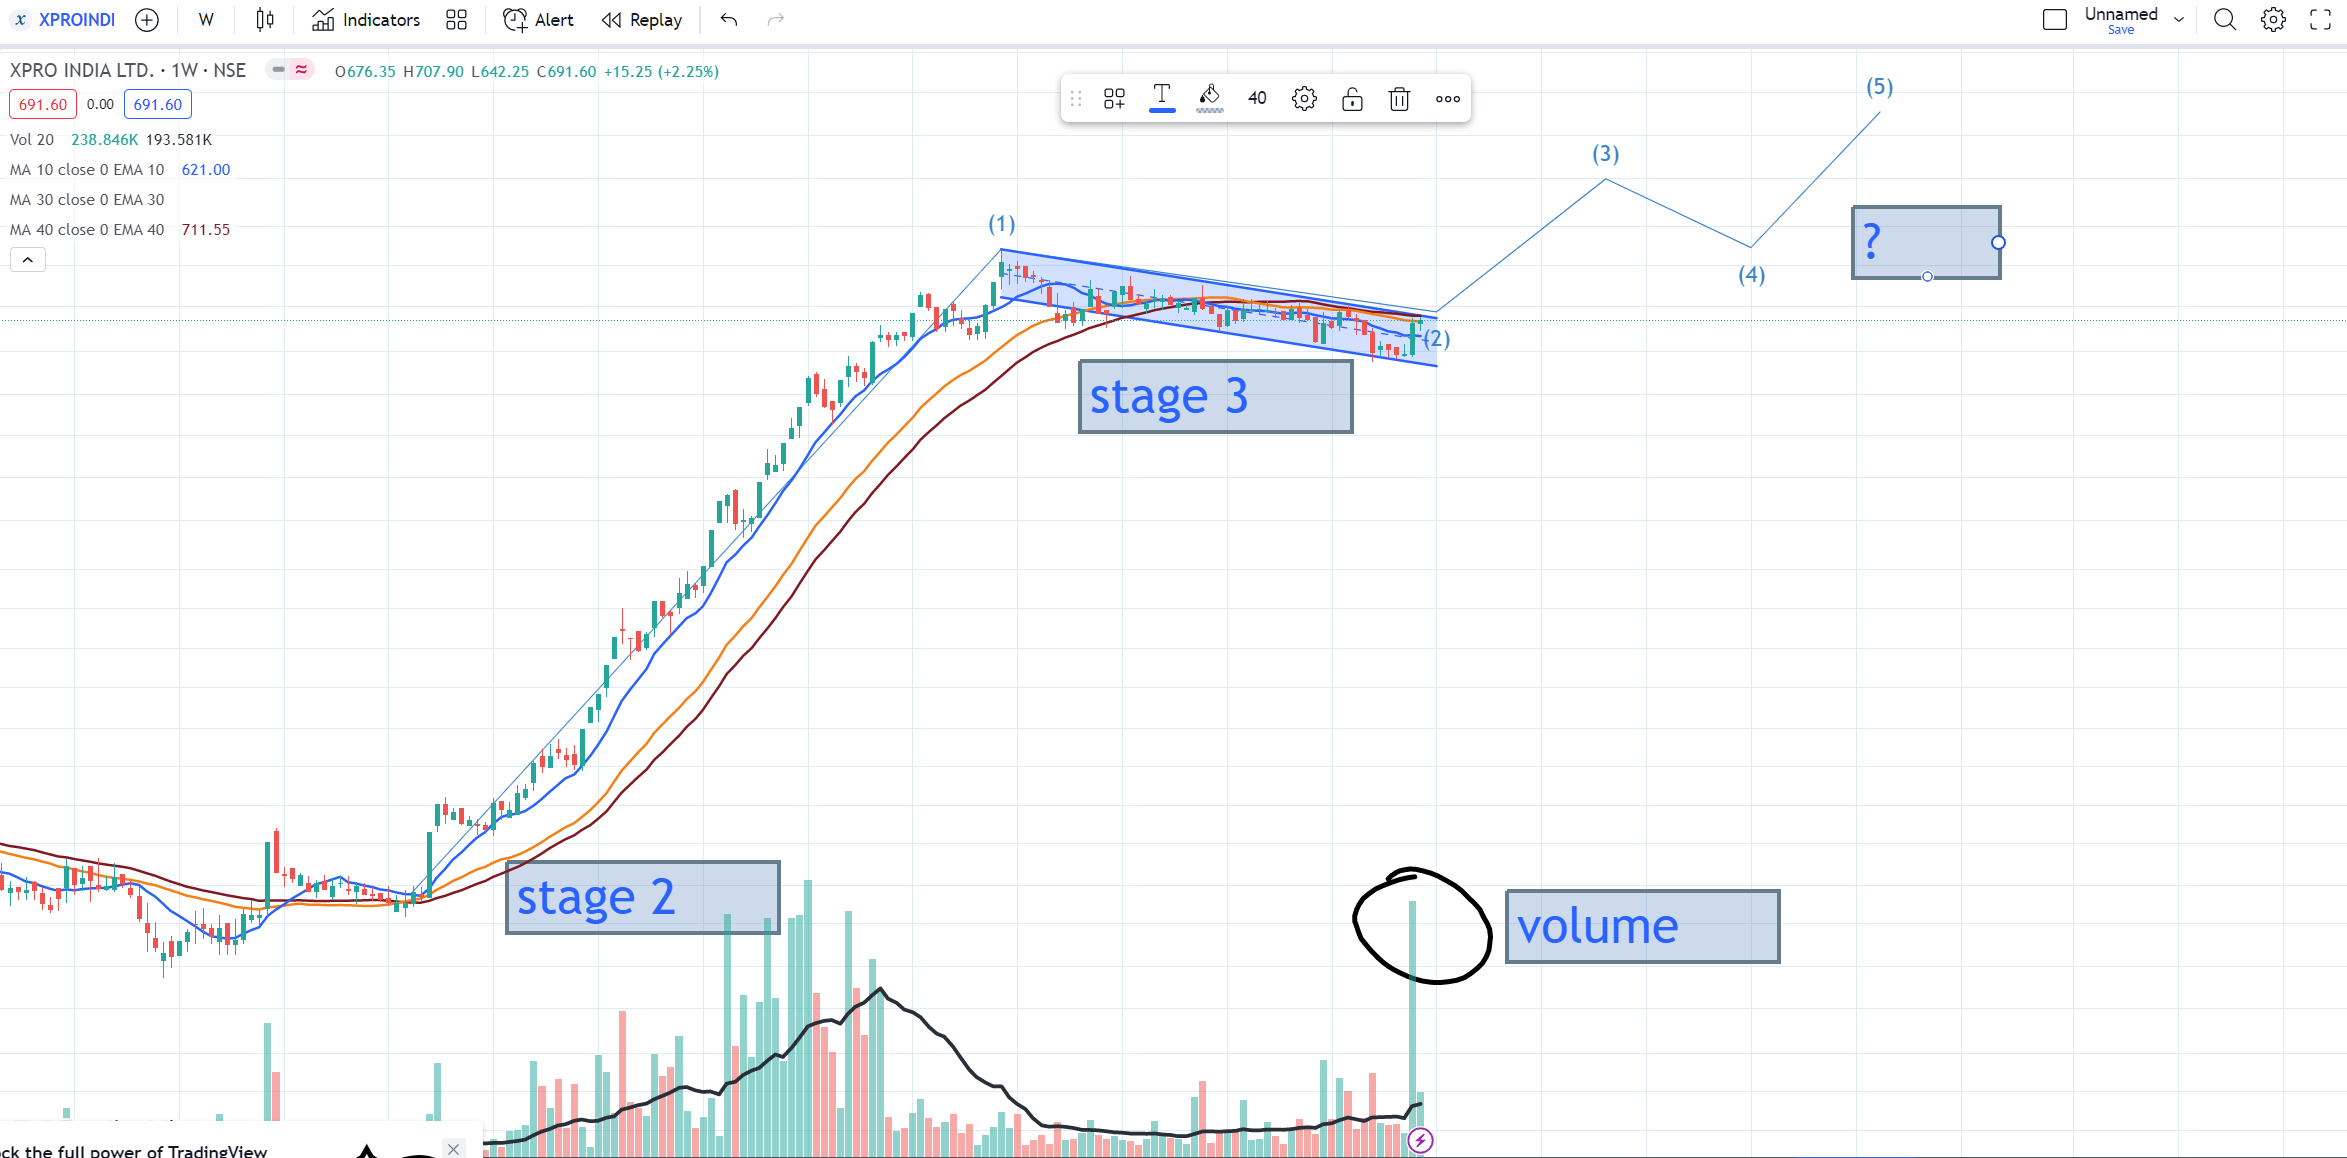
First of all, let’s say that your attempt is appreciable but at the same time would like to point out
a) EW count is very much wrong on both the charts …so please try to stay away from it. Better is to master stage analysis first , you can learn EW later.
b) Your understanding of Stage Analysis is also at a very beginner level.
Hence need to learn more .
b) HNDFDS is near 40 WEMA , let it close above it on the weekend and then let it break the trading range . That would decide its next move. Currently it shows lot of weakness as 9WEMA is trending down
c)Xpro was in stage 4 that is why it corrected about 40 %. In stage 3 , stocks move in a narrow range.
Go through the stage analysis lesson again and again…long way to go for you.
2 Likes
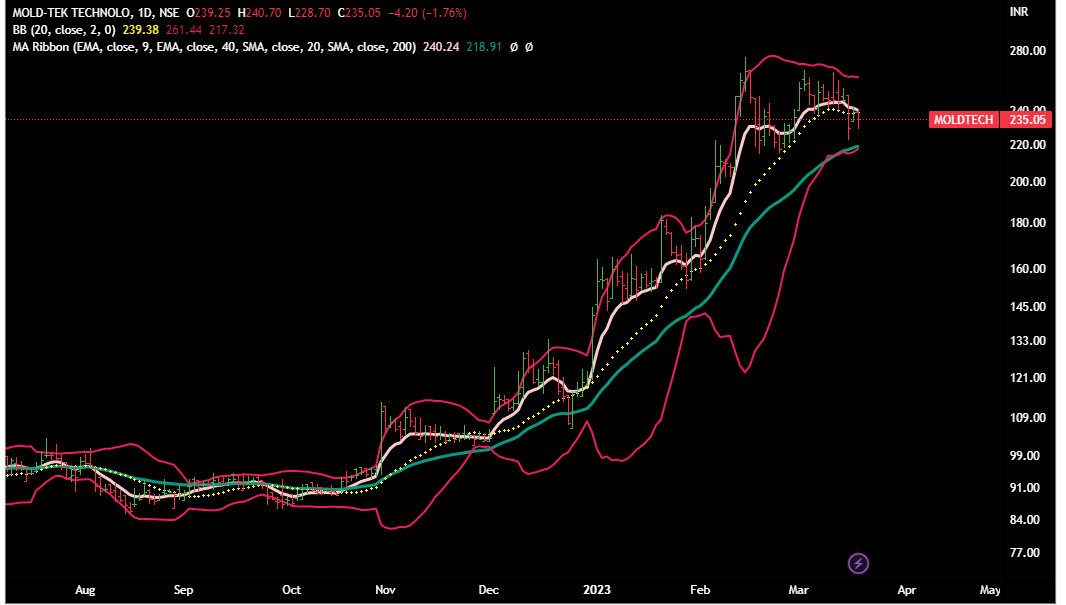
MoldTech
CMP 235
Very shrot term view from daily chart.
Till the time it is trading above 215 ( a strong support at thos level), there are chances that it can again start an uptrend .
But if it starts trading and closing below this level , then we can see it at much lower levels.
Daily Chart
Disclaimer :This post is just a for learning few methods of price-patterns. Views are personal and are purely based on our limited knowledge of charts. No buy/sell recommendations. These are probability study methods and chances of success/failure depend upon various factors
1 Like
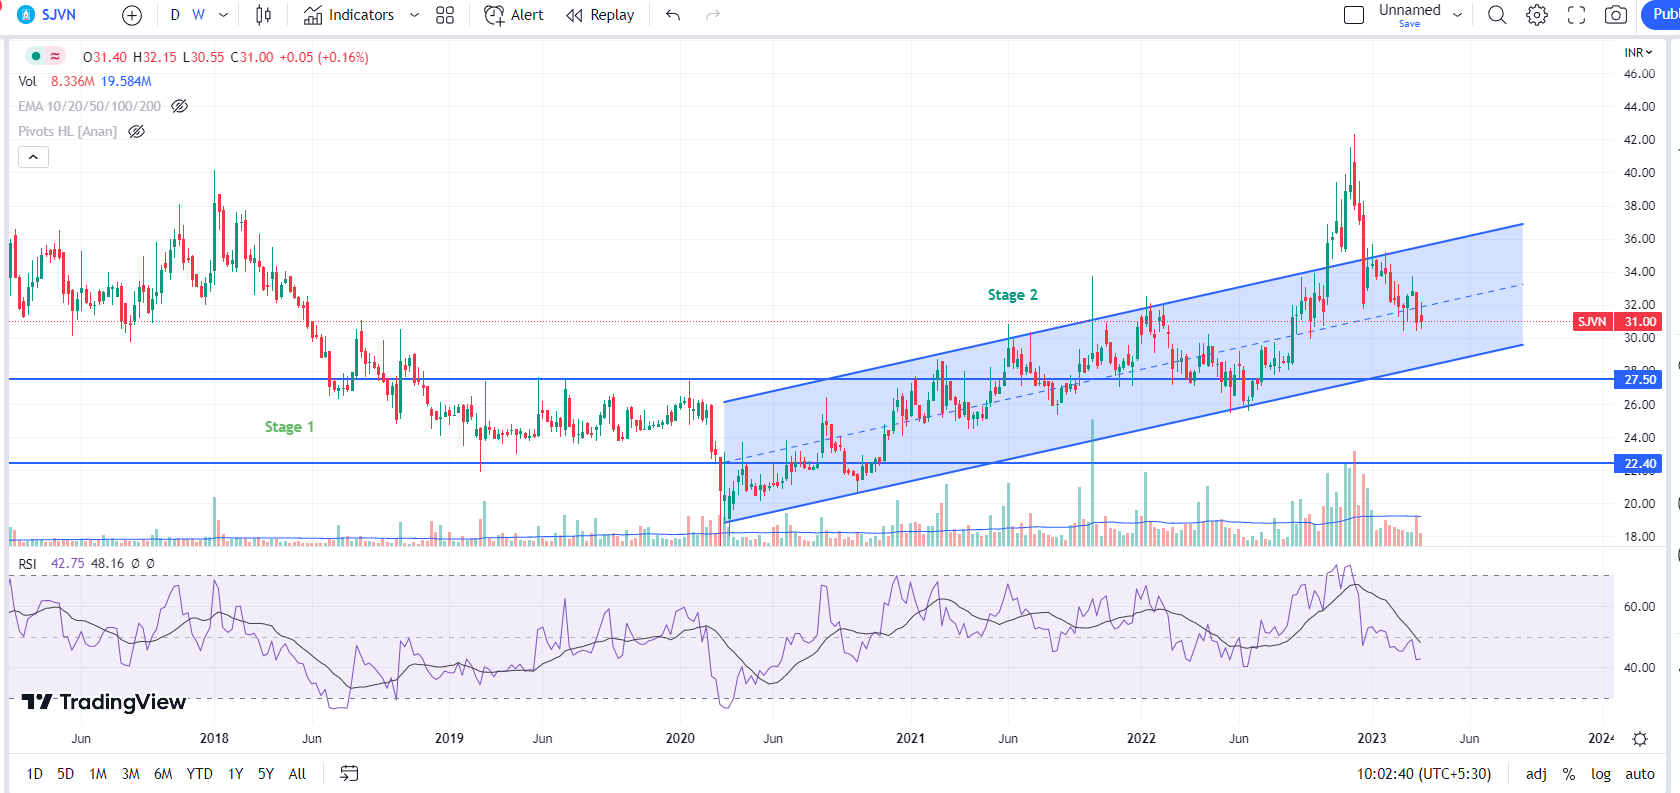
your views on SJVN please. They announced huge installed capacity expansion targets (5000 MW FY2023 & 25000 MW by 2030). current installed capacity ~ 2100 MW
1 Like
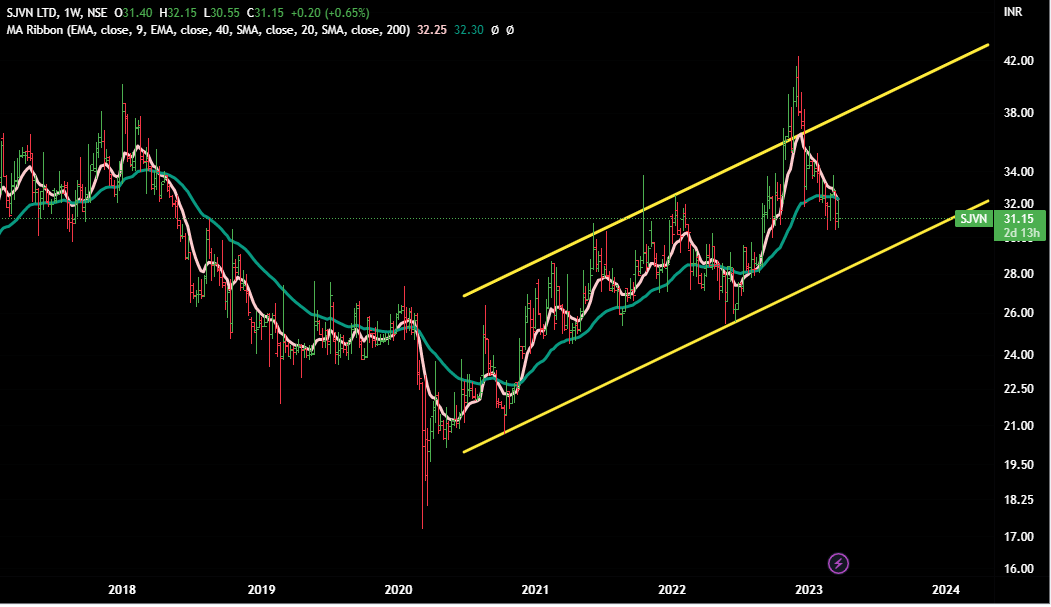
SJVN
CMP 31.15
We somehow don’t like these kind of volatile stocks where there is so much up and down. No clear wave count and so much gyration in different stages.
We prefer the charts where clear trend is visible.
As far as future Capex is concenrned, we feel that it may be good for the company but it might prove counter-produtive for its investors as medium term cash-flow would be impacted.
(Your chart has no moving averages as well as no visibility of trading ranges break-outs - deciding stages without these is not prudent)
As per our reading of its chart, we see more pain as well as anxiety for its investors.
Weekly Chart
Disclaimer :This post is just a for learning few methods of price-patterns. Views are personal and are purely based on our limited knowledge of charts. No buy/sell recommendations. These are probability study methods and chances of success/failure depend upon various factors
2 Likes
Sir,
Could you Please share your views on Shree Pushkar. Stock has significantly corrected a lot recently. Please let us know the stage it’s in currently.