StageInvesting +Elliot Waves

Titagarh Wagons
CMP 240

Well it is the only stock in your list that is still showing some strength.

It had given a breakout after 15 years and is still maintaining the uptrend.

A long term investor can keep riding by keep 40 weeks EMA as stop-loss .

Till the time it remains above 190 , it can keep giving upsides.
Monthly Chart


Disclaimer :This post is just for learning few methods of price-patterns. Views are personal. No buy/sell recommendations. These are probability study methods and chances of success/failure depend upon various factors.

5 Likes

Not very sure . Hence skipping it.

But keep a close track if it breaks and closes below 420 then correction can go much deeper.

1 Like

Yesterday’s Action

Added
Technocraft Industry
Sterling Tools

Exited
Intellect

2 Likes

Sonata
CMP 850

One of our recent investment that is doing really well.

Very very long term chart ( as given in the above post) also looks exciting.

1 Like

HDFC Life
CMP 466

Tracking on this thread from 600 levels.

Seems that may achive its worst-case scenario as shared in the July post :point_up_2:
Disclaimer :This post is just for learning few methods of price-patterns. Views are personal. No buy/sell recommendations. These are probability study methods and chances of success/failure depend upon various factors.

2 Likes

Still holding KPIT? It looks like heading towards 1300+

Market View

Yesterday’s fall across the globe was due to Credit Suisse going under ! So scare of the fall of big banks continued since last Thursday.

Market wanted a news to fall and 25% decline in CS stock in a day came handy.

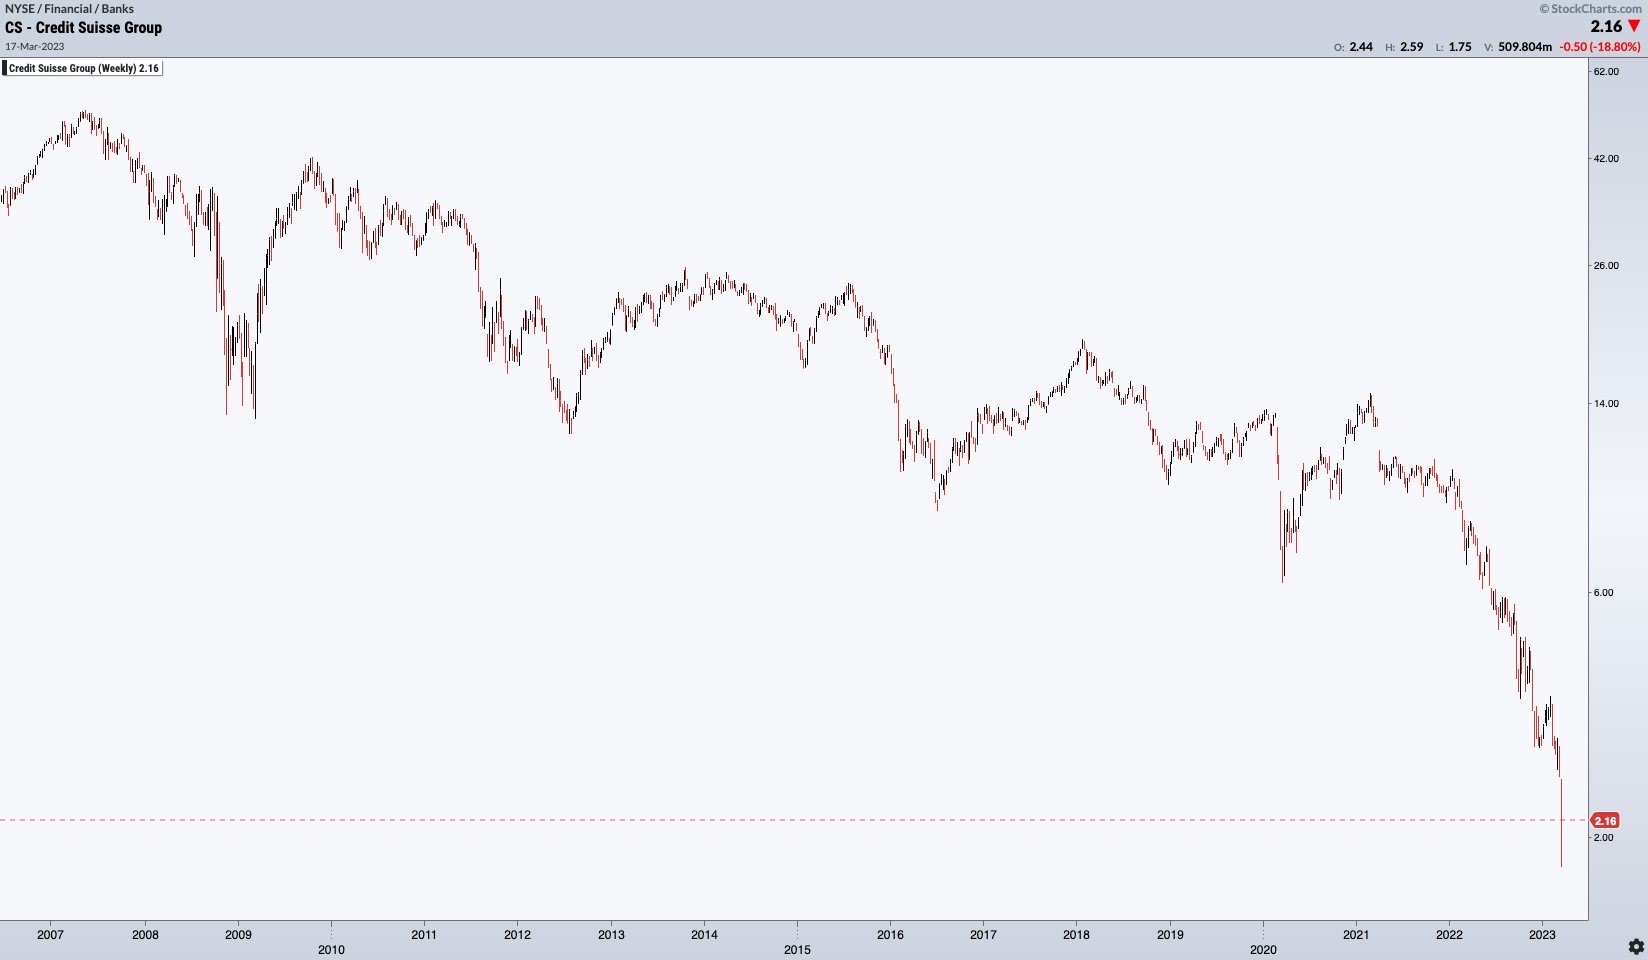
But fall in CS stock price was nothing surprising…it is falling for the years.

So where we go from here !

And we had 2008 kind of scare in last 4-5 days with the news of few American and European banks going under .

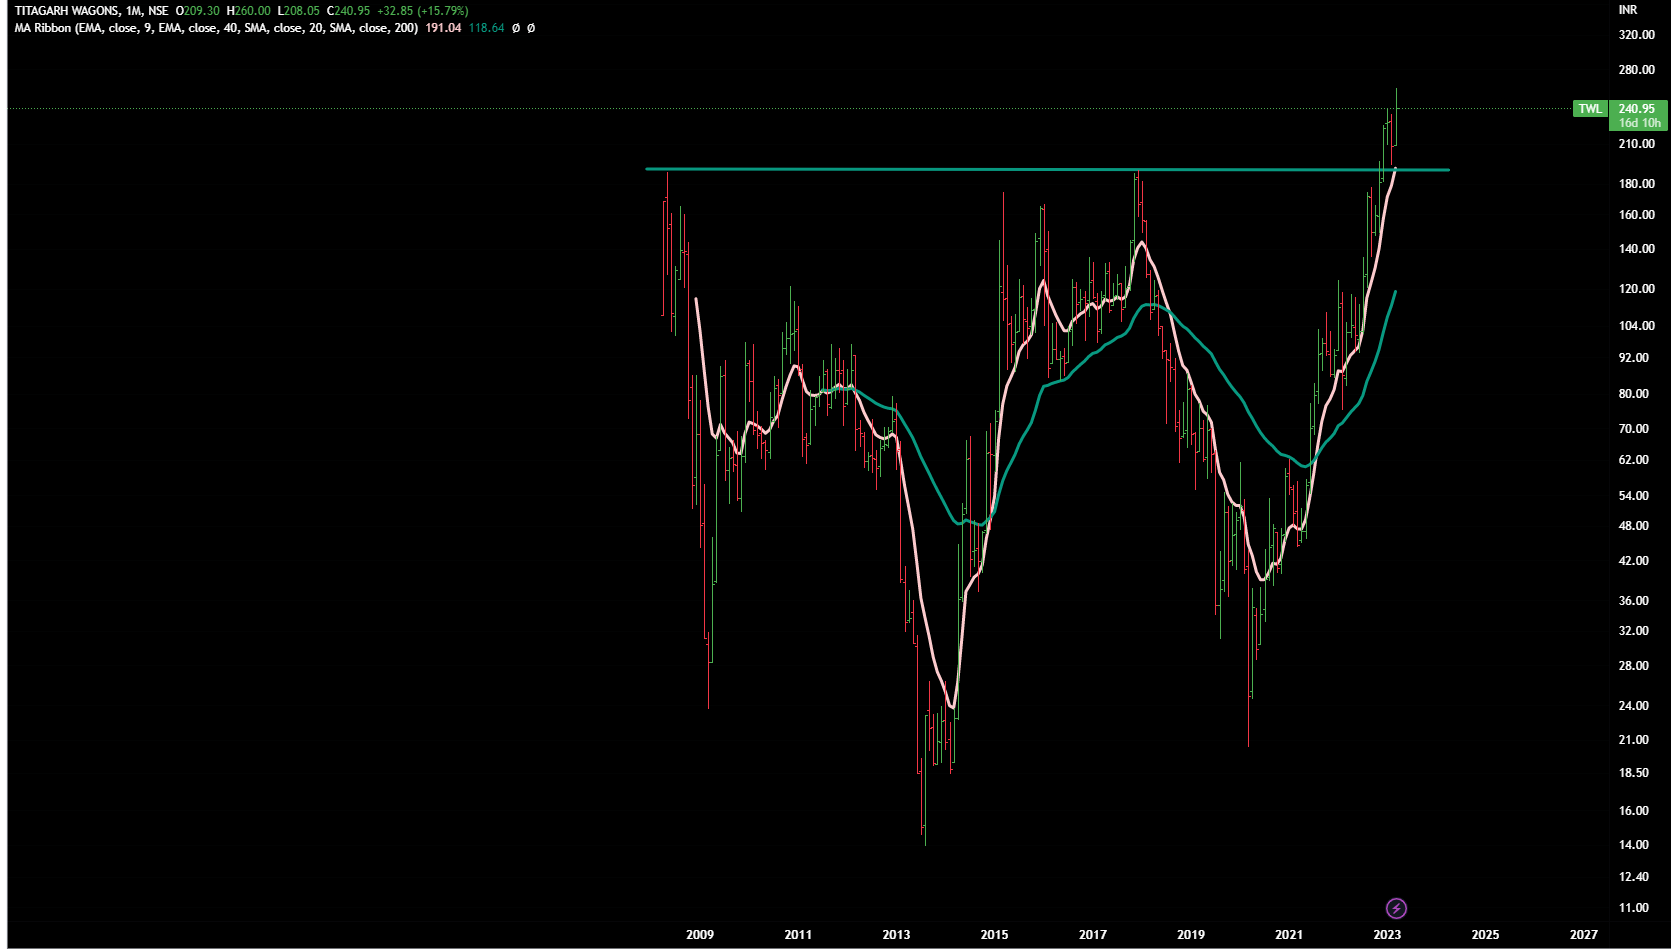
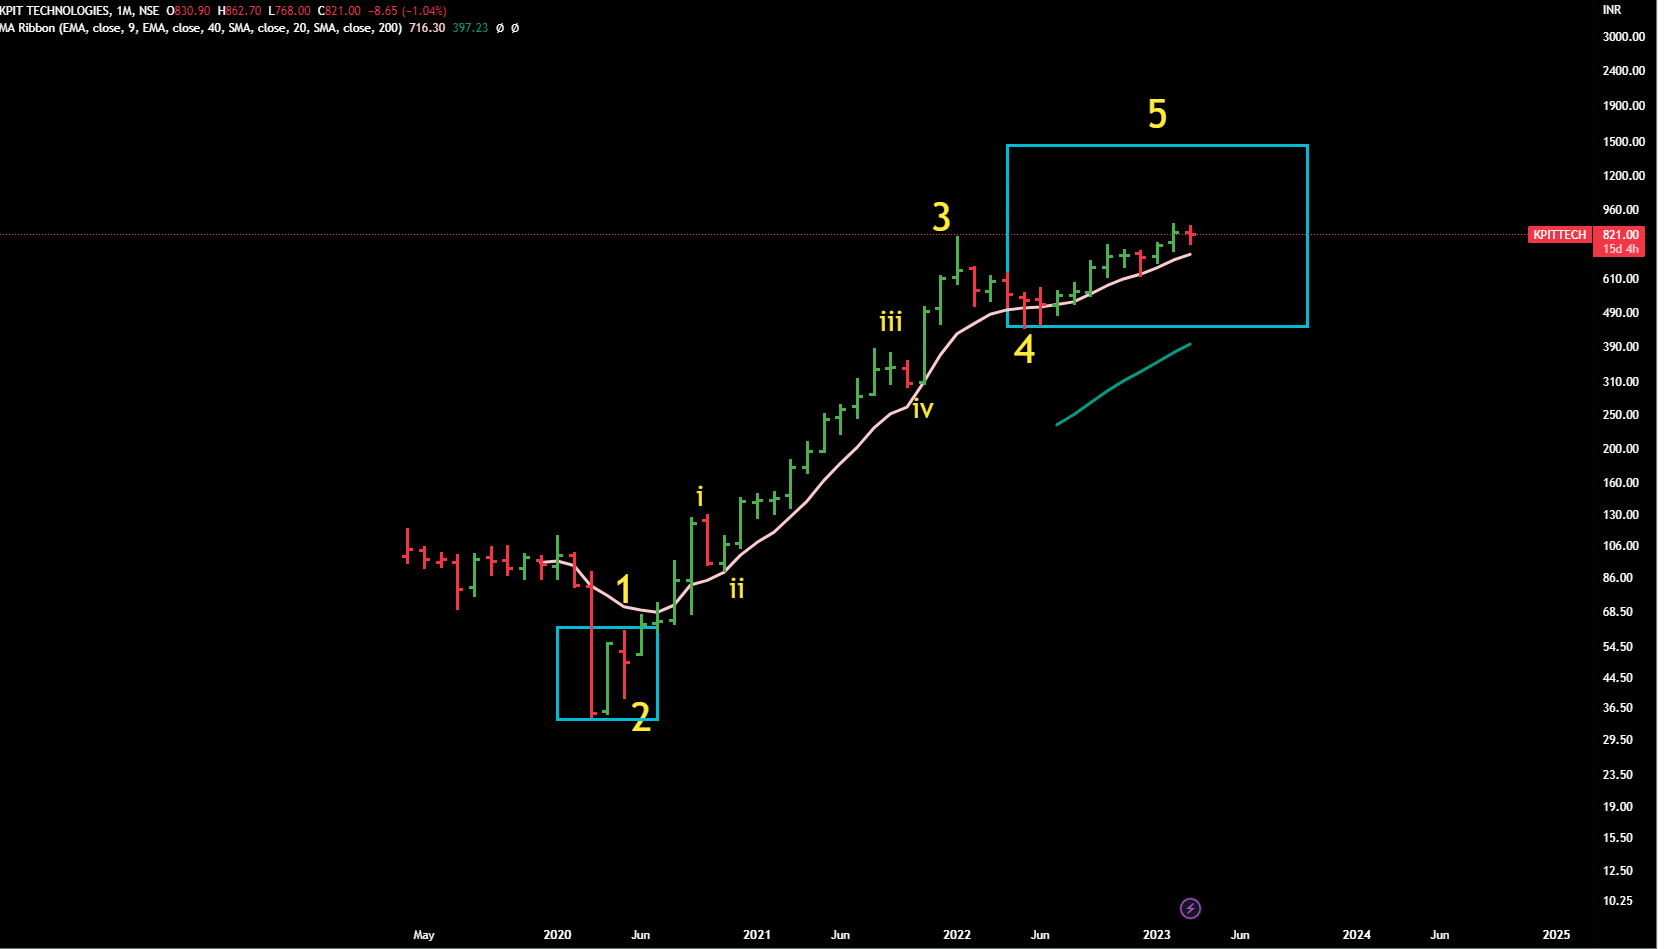
Well , as mentioned earlier , we are in last leg of this 18 months of bear -market ( from March 2020 COVId lows , we had 18 months of bull run and 18 months of bear market ) . Bear market generally end in 18-24 months period .

Last night , US stocks partially recovered after giving a scare of waterfall- type of fall - the fall was because of the panic over Germany banks .

And that worry also seems to be the last straw in ongoing 18 months old saga - yesterday it was over Credit Suise stoack that fell 25% in a day .

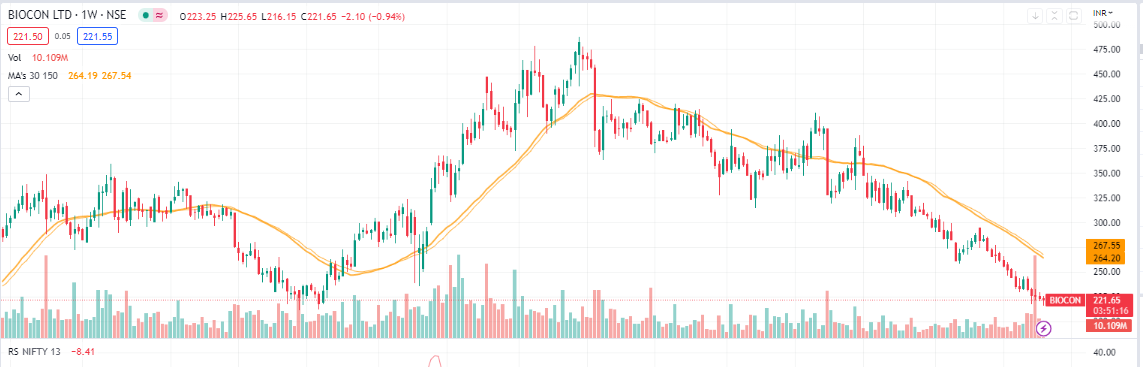
But if we look at Credit Suise stock - it was already down 90% in last few years as is obvious in the above chart - when a stock is already down to 10 from the levels of 100 that means all major worries have been discounted and this last fall of 25% in a day for a stock valued 10 ( that already came down from 100 ) was nothing much but a newspaper headline and a panic -creator .

US local banks currently seems to have been saved - US does not want 2008 type of mayhem , hence their playbook was ready for similar situation .

That’s why they provided safety to their banks within 48 hours and that too over a weekend .

US won’t let its major institutions to fall and would keep providing the liquidity wherever required .( same was done by Bank of England as well as many other countries)

Now if we keep the big institutional- downfalls’ concerns aside , the only worry is about recession.

Well , that is going to unravel in slow and grinding manner and most of the people are aware about it .

The actual depth of recession would be felt in coming quarters results - market would keep making guesses and would keep discounting it gradually .

And as usual , the market is a forward discounting machine - as soon as it starts smelling some green- shoots - it would start a recovery .

That might take another 3-6 months but few of the stocks are already available at great valuations and at a good risk - reward levels .

Global Markets, in general , can fall other 5-7% from here before forming a base to start next leg of rally .We might see a quick recovery from here in April and then final leg of decline can be slow and grinding.

In India, the companies exposed to Europe and US may face some challenges in coming months ( but few may benefit due to China+1 story ) . On the other hand , the companies focused on domestic consumption may not do badly… we only need a good Monsoon - hope the gods would be kind enough .

15 Likes

Petronet
CMP 236

Revisiting due to few changes in the chart because of few changes over last few weeks ::
a) It has broken and close above the first trading range
( but let’s wait for the weekend for the final close over 1st trading range)
b) Monthly RSI level has crossed the horizontal line after many months
c) Volume is decent
d) We see a buy signal on monthly MACD after many years (4 years)

Monthly Chart

But there are still several hurdles ,hence position sizing should be gradual as it keep crossing the overhad -resistances …had pointed out several overhead resistances in the previous post.

Weekly Chart


Disclaimer :This post is just a for learning few methods of price-patterns. Views are personal. No buy/sell recommendations. These are probability study methods and chances of success/failure depend upon various factors

1 Like

KPIT Tech
CMP 821

We covered it first in April 22.

Current Situation

It seems to be extending its 5th wave.

Now 5th waves are tricky , anything can happen.

With best of our ability , here is our projection - if the uptrend continues as per EW theory.

Monthly Chart


Disclaimer :This post is just a for learning few methods of price-patterns. Views are personal. No buy/sell recommendations. These are probability study methods and chances of success/failure depend upon various factors

Caplin Point
CMP -613

A highly tracked stocks among many.

Alert- it is trading below 40 months moving average (MEMA) and it has also broken an import support ( red line).

If on month-end , it closes below 40 MEMA …then only God can help it !

Monthly Chart


Disclaimer :This post is just a for learning few methods of price-patterns. Views are personal. No buy/sell recommendations. These are probability study methods and chances of success/failure depend upon various factors

2 Likes

In that case is it correct to interpret that we are in sub wave 3 uptrend of larger 5?
Is my understanding correct? Or still in sub wave 1 only?

Please let me know your technical views regards icici lombard general insurance.

Tentaively yes -sub wave 3!

1 Like

ICICI Lomabrad
CMP 1061

Currently in a hopeless situation like many other stocks of the same sector.

Although the support is near 1010 — but the chart does not give any confidence as of now.

Monthly Chart


Disclaimer :This post is just a for learning few methods of price-patterns. Views are personal. No buy/sell recommendations. These are probability study methods and chances of success/failure depend upon various factors

2 Likes

Could you please share stage analysis view on Indraprastha Gas? Thanks.

IGL
CMP 427

Although it seems that the stock completed its correction (S4) at 321 in March 22 and is now trying to form a base (S1) in last few months but it seems to have lot of supplies near 450.

For any significant upmove it should start trading and closing above 450-55 levels.Next resistance it should cross with volumes is near 515 levels.

As per the charts,in very short-term , it should struggle or consolidate a bit. On downside, be carfeul if it starts going below 415-390 range.

Keep in consideration that we never project a chart for 5-10% up or down-side movements. We look for long -term trend changes on either side where the upside or downside can be really significant.
Weekly Chart


Disclaimer :This post is just a for learning few methods of price-patterns. Views are personal and are purely based on our limited knowledge of charts. No buy/sell recommendations. These are probability study methods and chances of success/failure depend upon various factors

2 Likes

Pls share your inputs on HGinfra… It has similarities in chart structure with KPIT, ofcourse with some lag in price action and wave set ups…

We don’t see any similarities. The wole rise is overlapping waves - a corrective one.

Biocon is below 40 MMA and seems like in Stage 4 decline. When it has gone below 40 MMA, does it mean something has structurally changed in the company/industry? @StageInvesting

Ideally, in this case, we want to wait for the stage 1 base to form right?

Yes it is Stage 4 decline - You are right.

(just a small correction - it is 40 Week Moving Average ie 40 WMA)

And for entry, one should wait for a base formation and and cross/close above the trading -ranges.If you have read the article on Stage Analysis, everything is clearly mentioned and explained there.