@StageInvesting , Could you please share your view on HBL power, Huhtamaki.
Thanks
@StageInvesting , Could you please share your view on HBL power, Huhtamaki.
Thanks
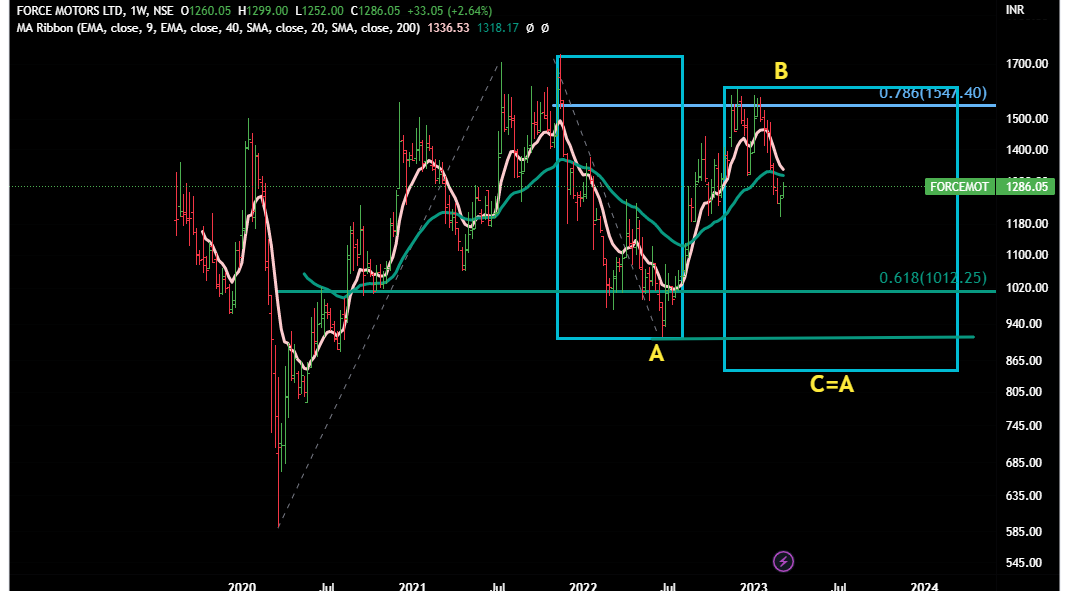
Force Moters
CMP 1286
Our guess as per EW is that we’re in C wave ( and as per stage analysis , we are in S-4)
Green lines are support levels but if keep breaching them, we expect it to to achieve C=A.
Weekly Chart
Hi,
I wanted to know if you have used vStop to identify selling triggers. How good it is an indicator of sell signal as per you ?
Nope sir. We have never heard about it.
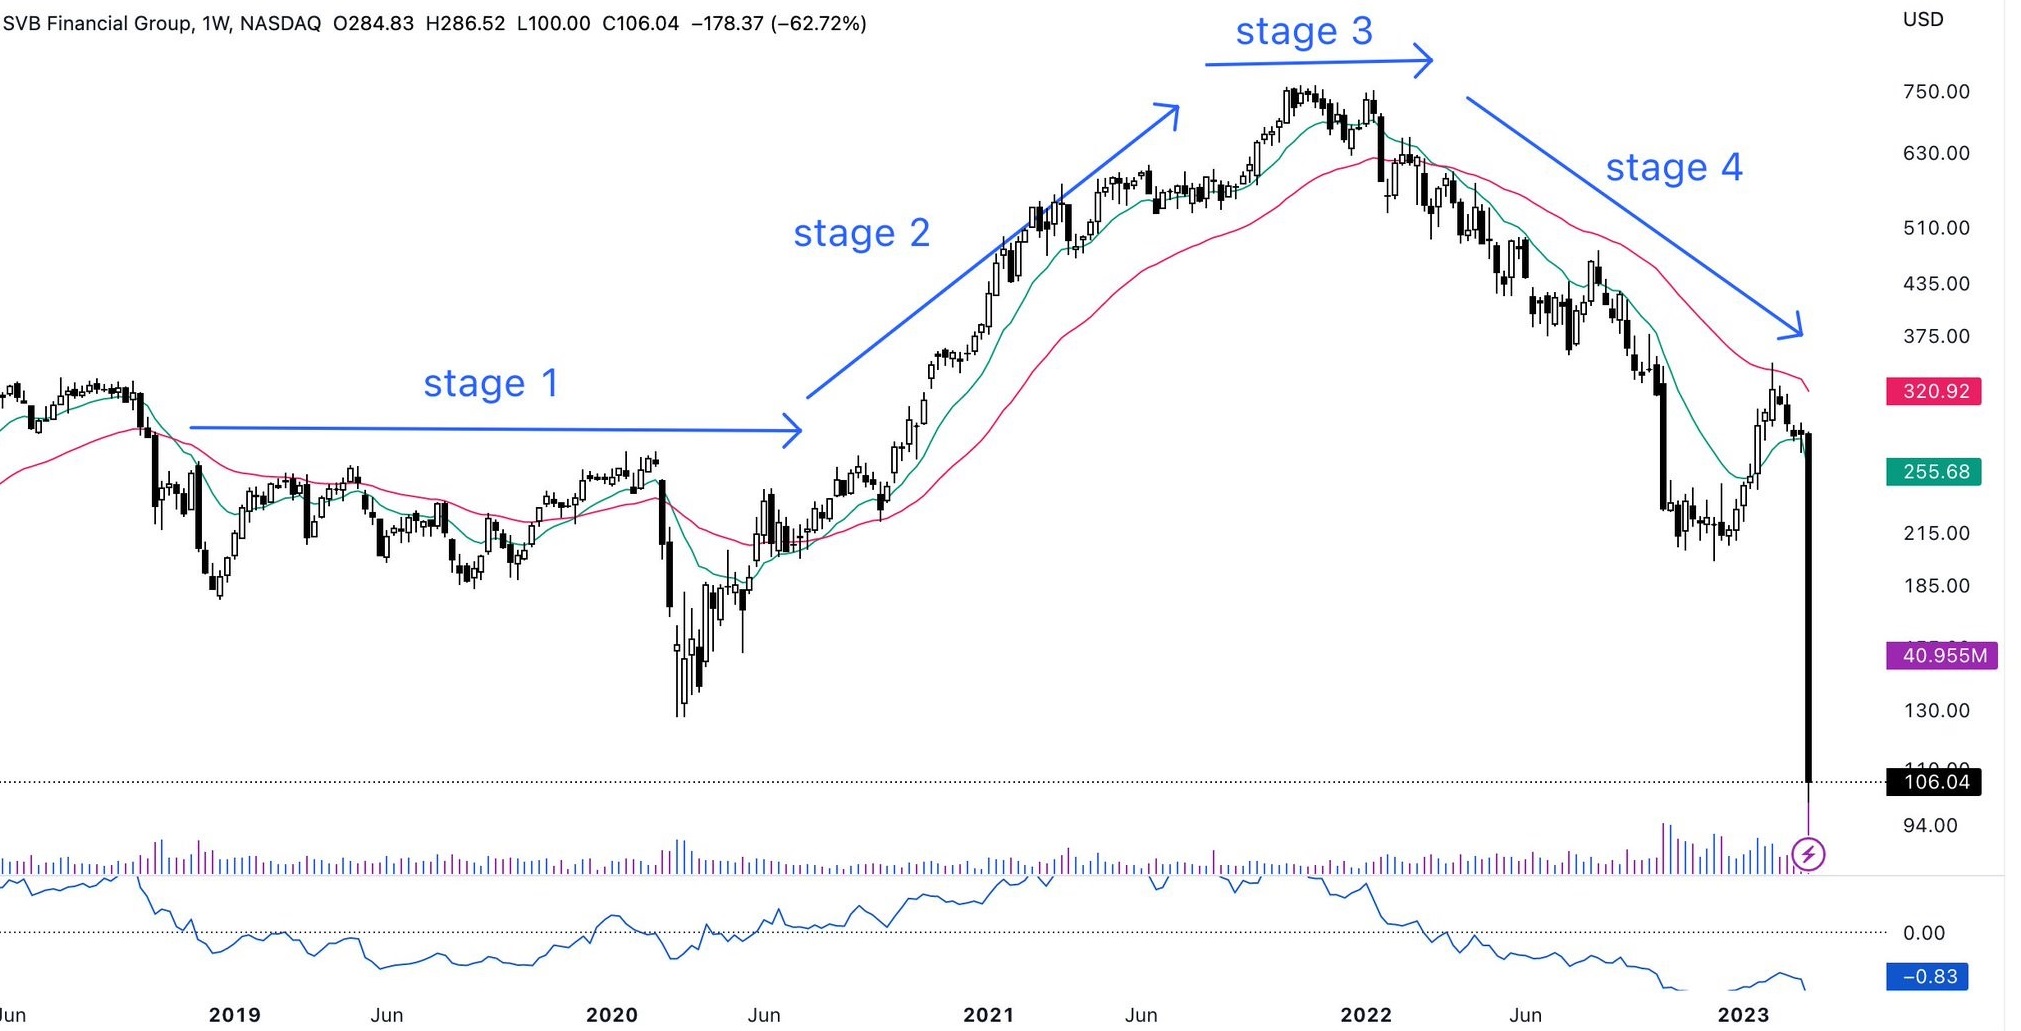
SVB Bank
One of the biggest US bank’s stock crashed last week.
Stage -analysis could have saved many investors…that’s why the say that try to avoid stocks trading below 40 WEMA for long…anything can happen.
Weekly Chart
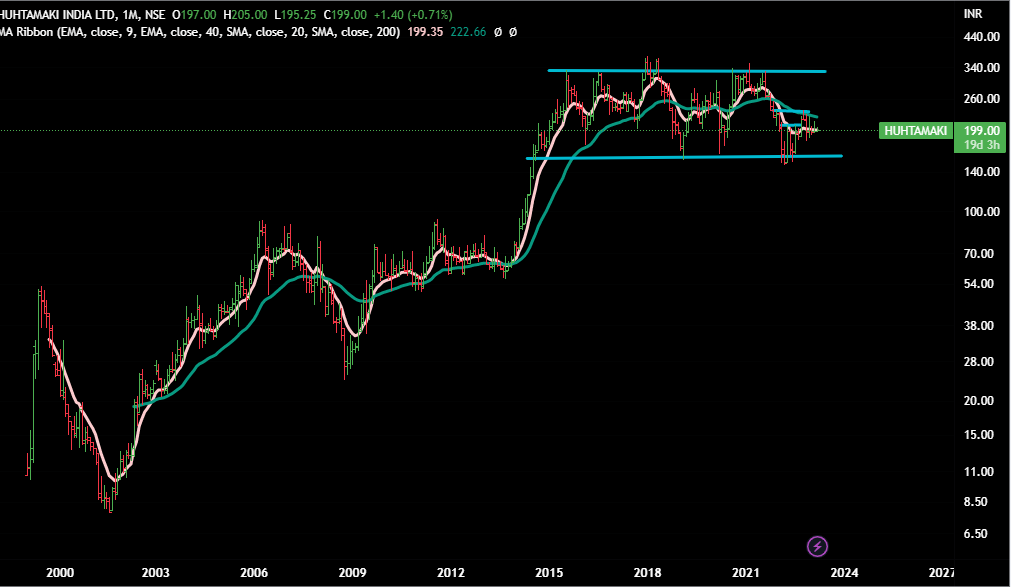
Huthamaki
CMP -195
We’ve used monthly chart here.
From long investement prespective , we don’t see any movement here.
The stock keeps moving in a range of 150-300 for last 8 years.
Till the time this range is not broken with significant volumes, we don;t foresee much hope beyond this range-level.
Monthly Chart
Sir would like your input on Bodal Chemicals and EPL Ltd in Weekly and Monthly chart?
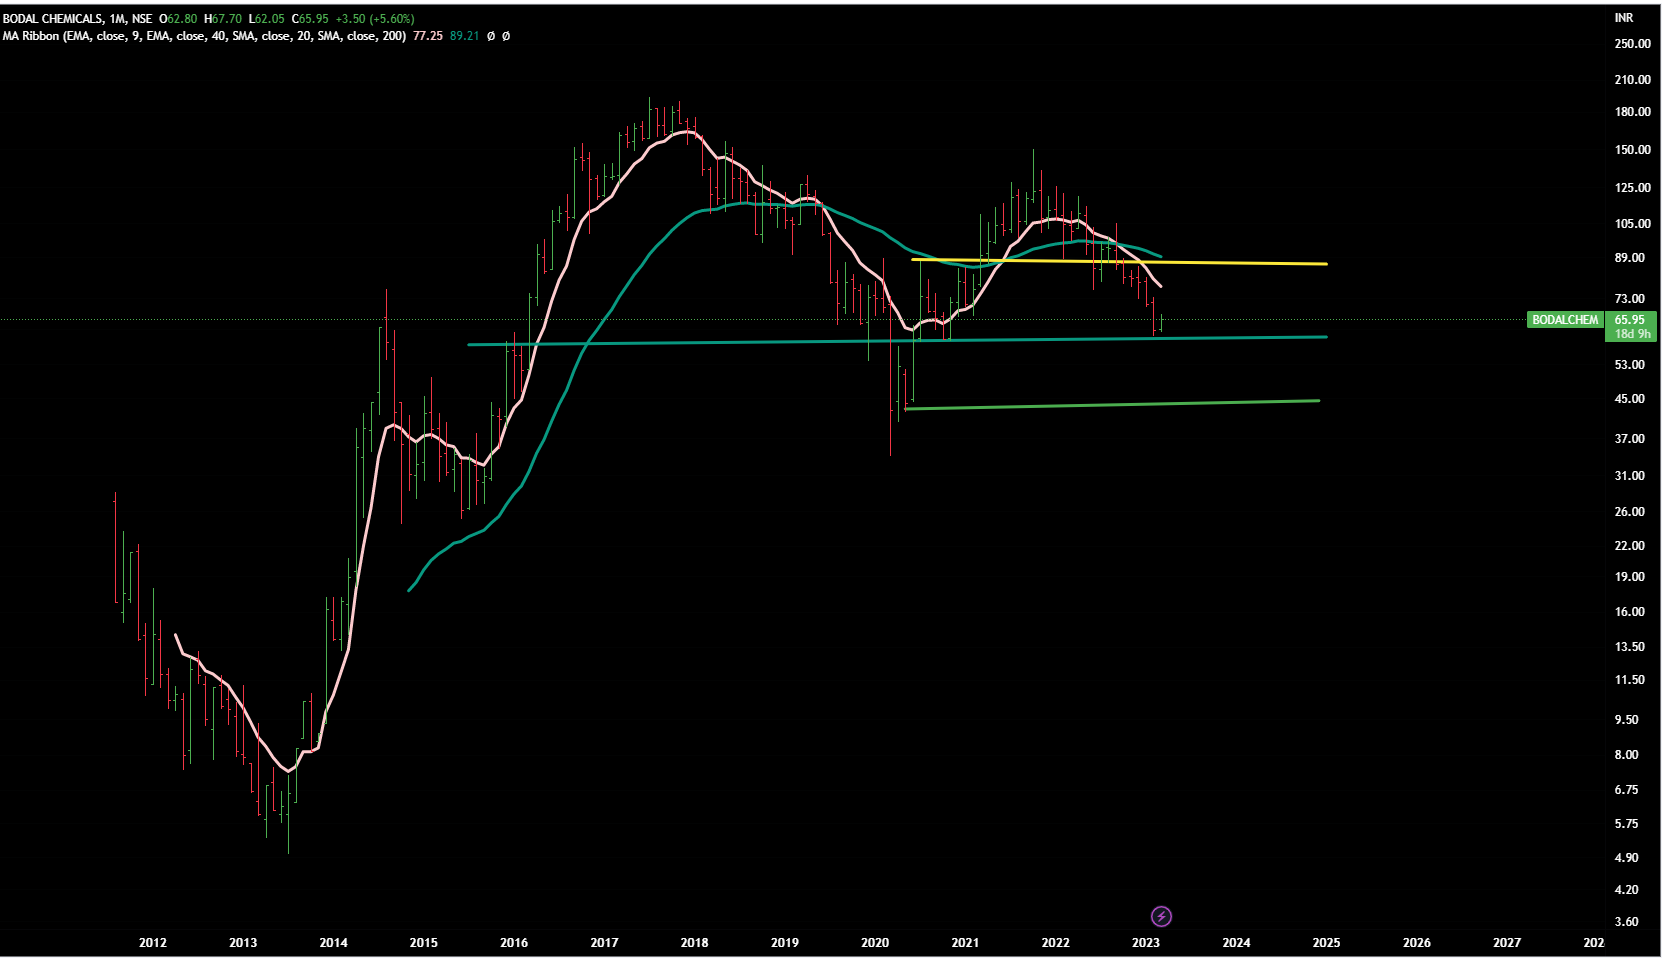
Bodal Chemicals
CMP 66
Stock is at a critical support level…if it remains above 60 then either it should consolidate between 60 -80 range.
Any significant upmove can be seen only if it crosses and closes above80-85 range with significant volume.
But if it breaks 60 and starts closing below it, next support is near 42.
Monthly Chart
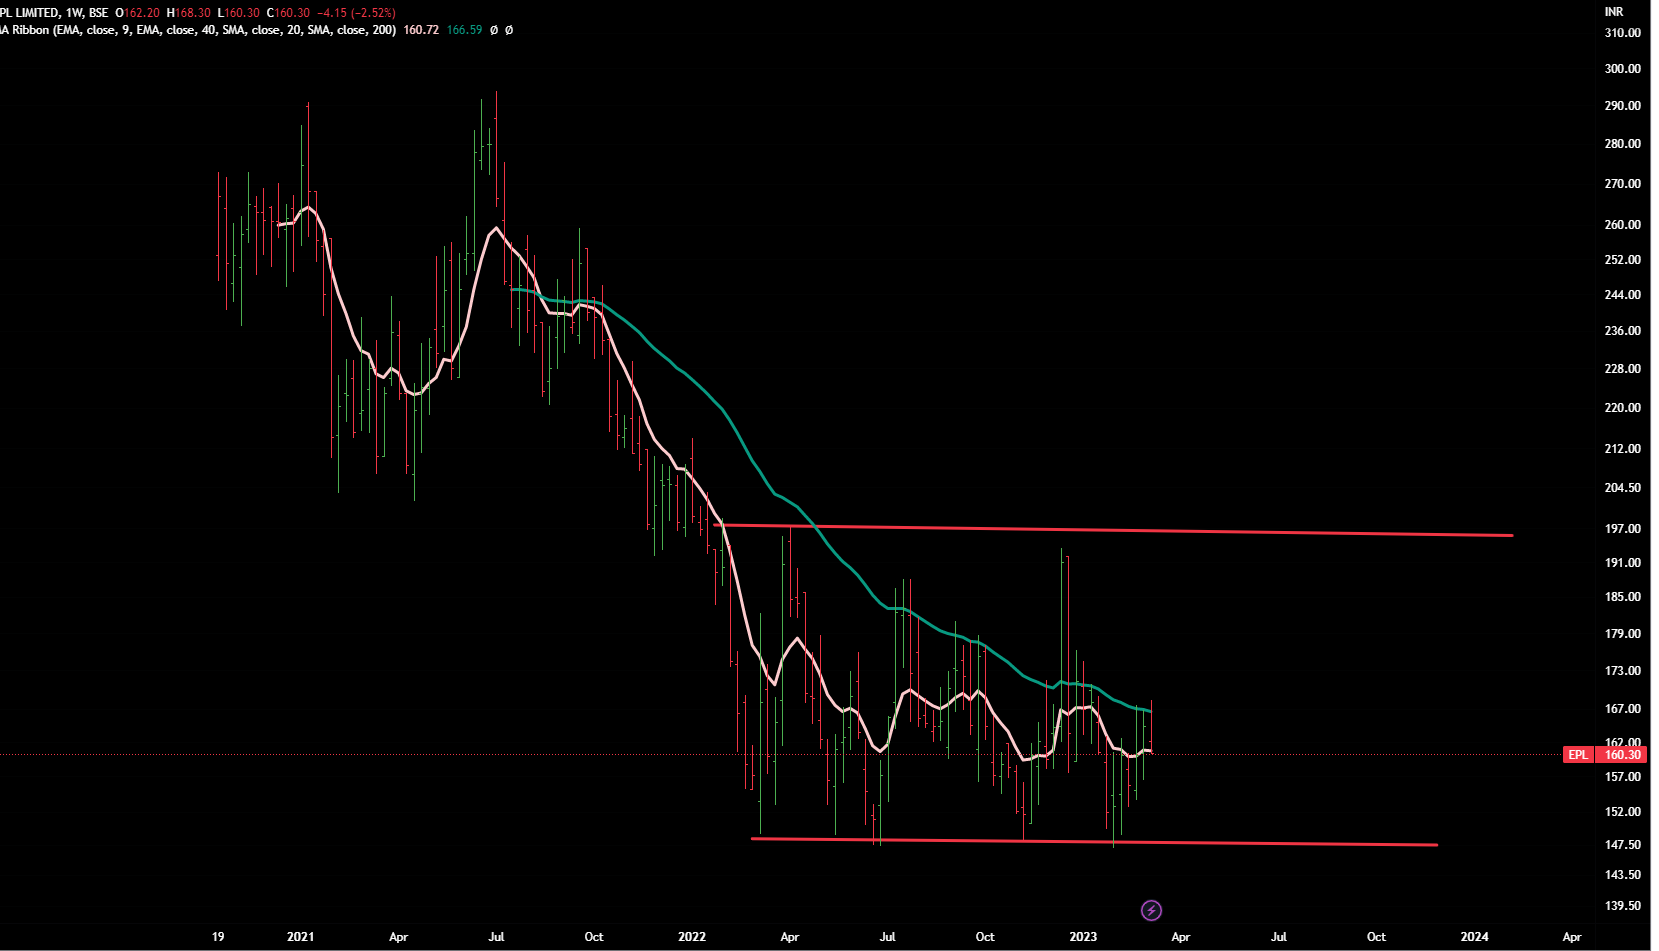
EPL Ltd
CMP 160
This has very little history and since beginning, it is in correction zone.
As of now, it seems to be consolidating.
Don’t foresee any significant move on either side till it breaks and starts closing beyond this range (red lines)
Weekly Chart
Disclaimer :This post is just for learning few methods of price-patterns. Views are personal. No buy/sell recommendations. These are probability study methods and chances of success/failure depend upon various factors.
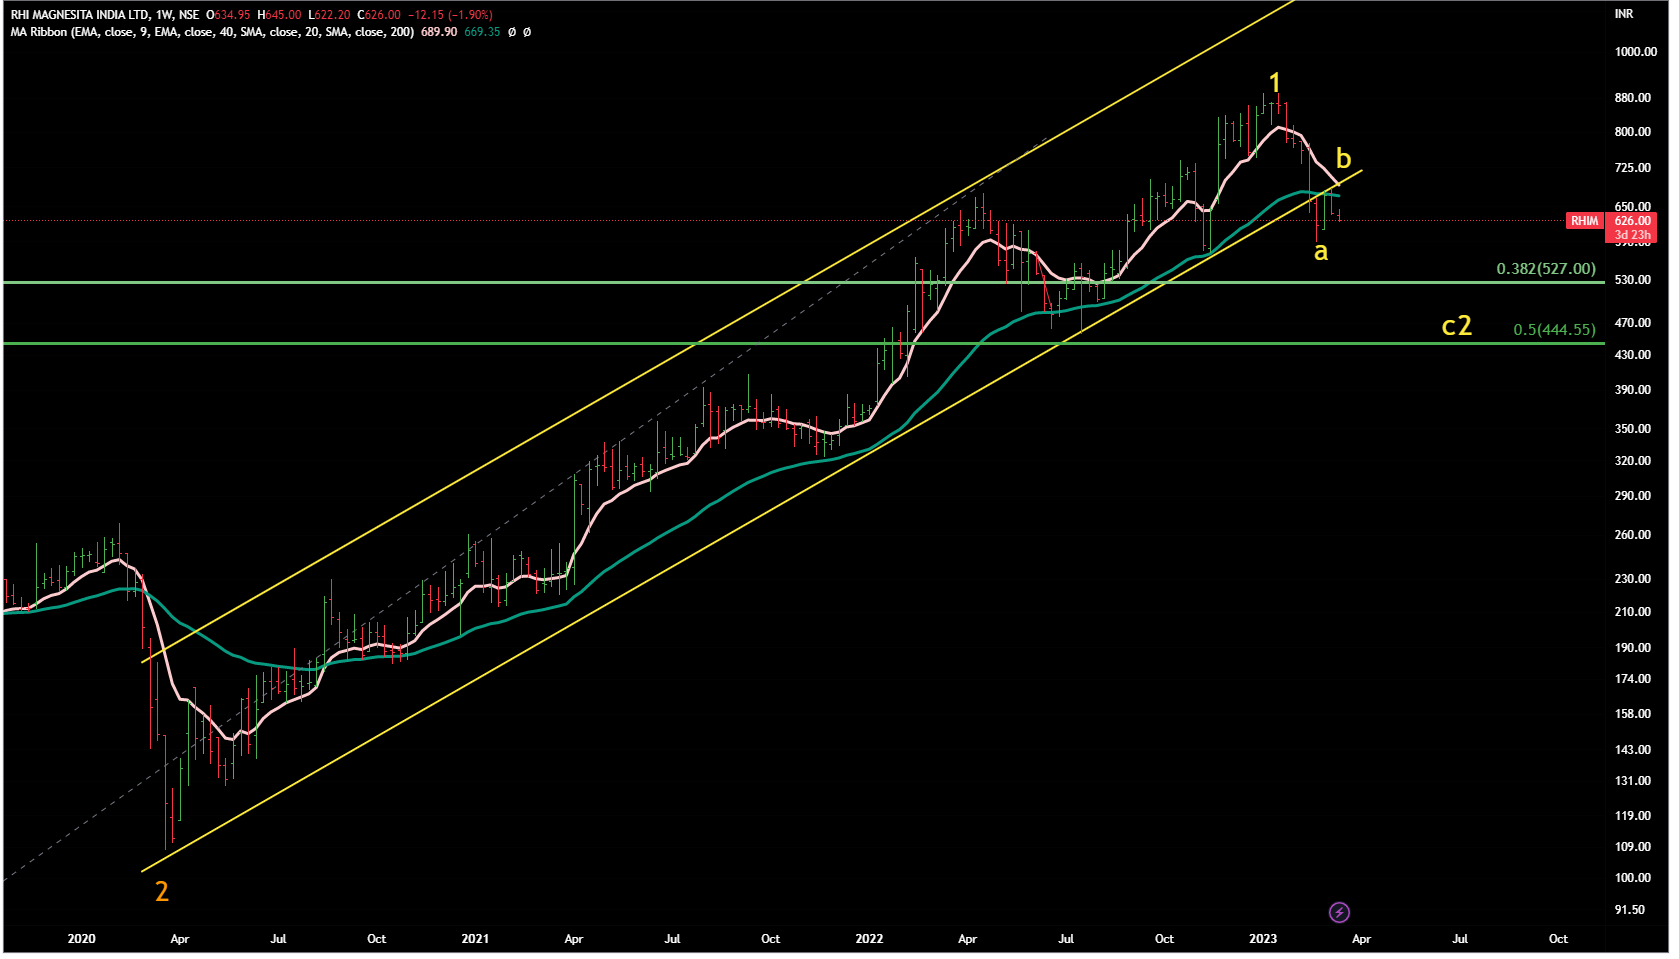
RHI Magnesita
CMP 626
However good a stock may be, however good future potential may be,howsoever good the story may be…the price would always move in cycles.
Well, it seems to be in correction zone. Writing was on the wall when it broke its rising channel that it was following since the lows of 2020.
Currently it was bouncing back in “b” …not sure whether the ‘b’ is over.
Level of C would depend upon the level where ‘b’ ends.
Let’s waith and watch.
Weekly Chart.
Hi @StageInvesting !
Do you see any breakage in any of your listed pf stocks? Keen to know if any of the EW setups have failed in the latest pf?
Regards,
Rahul
If you’re refering to this , yes we keep on holding.
Our current PF is as following (with only 30% cash exposure):
PB Fintech
PayTm
Apar
ZenTech
Sonata Software
Sandur
Bosch
Ujjivan
Intellect
Equitas
Kalptaru
Dynemic Products.
4 reasons - that no-one shoud follow or invest in our PF stocks just because we’re invested in them:
1.Please keep in mind that we can exit any stock ,any day , without informing on this forum .
2.And many of these stocks are not selected becuse of technical structures, but our belief in the stories - hence even we can’t predict the downside.
3. We can go very very wrong, we have own baises and market tries to humble even the best of the players.
4. We’re not SEBI registered analyst , hence one should be doing due diligence on his /her own end. We’re not going to be responsible for your profit or loss.
Hence please please don’t follow-us on stock-selection . We’re trying to build this thread as a learning thread.
Hi, please provide your views on Best Agrolife chart. What are the support levels etc given that the stock is making continuous lows.
Thanks much
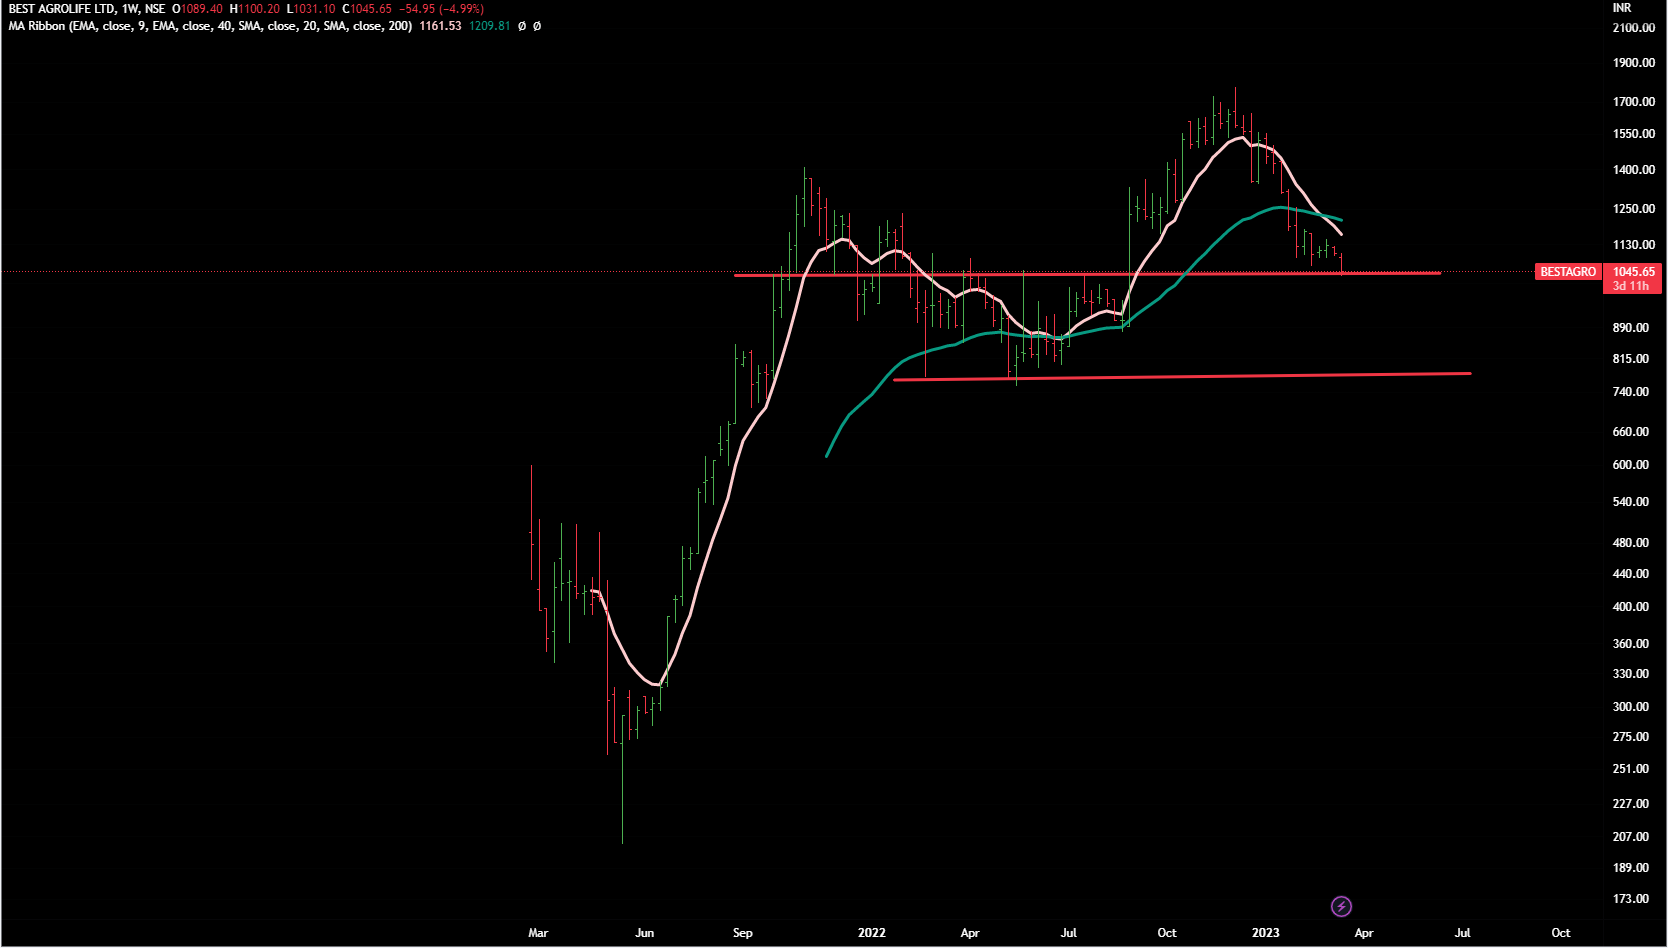
Best Agro
CMP 1045
Well, we won’t be making any upside projection here as we are negatively biased against domestic generic marketing agro-chemicals companies.( we are least bothered about any upside movement in domestic agro-chemicals companies unless and untill they’re involved in exports of some niche AIs).
These domestic generic marketing agro-chemicals companies can only increase their business by either extending longer credit to channel partners or by giving higher margins as it is a very competitive space ( there are > 500 domestic genric marketing companies in agro-chemicals space.)
Some companies come with latest combinations ( 2 or 3 AIs combined together ) but again that is not a moat as farmers are already using these combinations by buying these moleclues separately and retailers are always pushing these combinations by pushing certain high-margin products with key AI brands. Sit a retialer shop for 5 minutes and you can get all these insights.
In short, we don;t like these kind domestic focused companies who don;t have any unique R & D ( and no one has) . We don;t think that these should be valued at > 5-6 PE in a bear market and 10-12 PE in bull market.
This company chart does not have much history do can’t say much but be careful of these red lines- if these are broken, the fall can be deeper.
Weekly Chart
Is this PF based on technical strength or fundamental strength ?
Dynamic seem to be a play on cycle turning and capex yielding result
Like mentioned before - we first see the fundamentals and only then get into understanding the technical structure.
But in case of newly listed companies (less than 3 years as it is difficult to study technicals with very less history in listed space), we just go by our understanding of fundamentals and future business potential.In the above case , PB Fintech, PayTM are not at all based on any technical structure.
Thanks much for detailed analysis. Your analysis are very detailed. I agree that with difficult monsoon outlook, next one year may be challenging for the company (not sure how much of it is already factored in the price).
Please do analysis on Titagarh Wagons (Railway Capex), Greaves Cotton (EV play), Likhitha Infra (O&G Capex), and Avantel (defence) when you have time ![]()
![]()
![]()
Here we go :
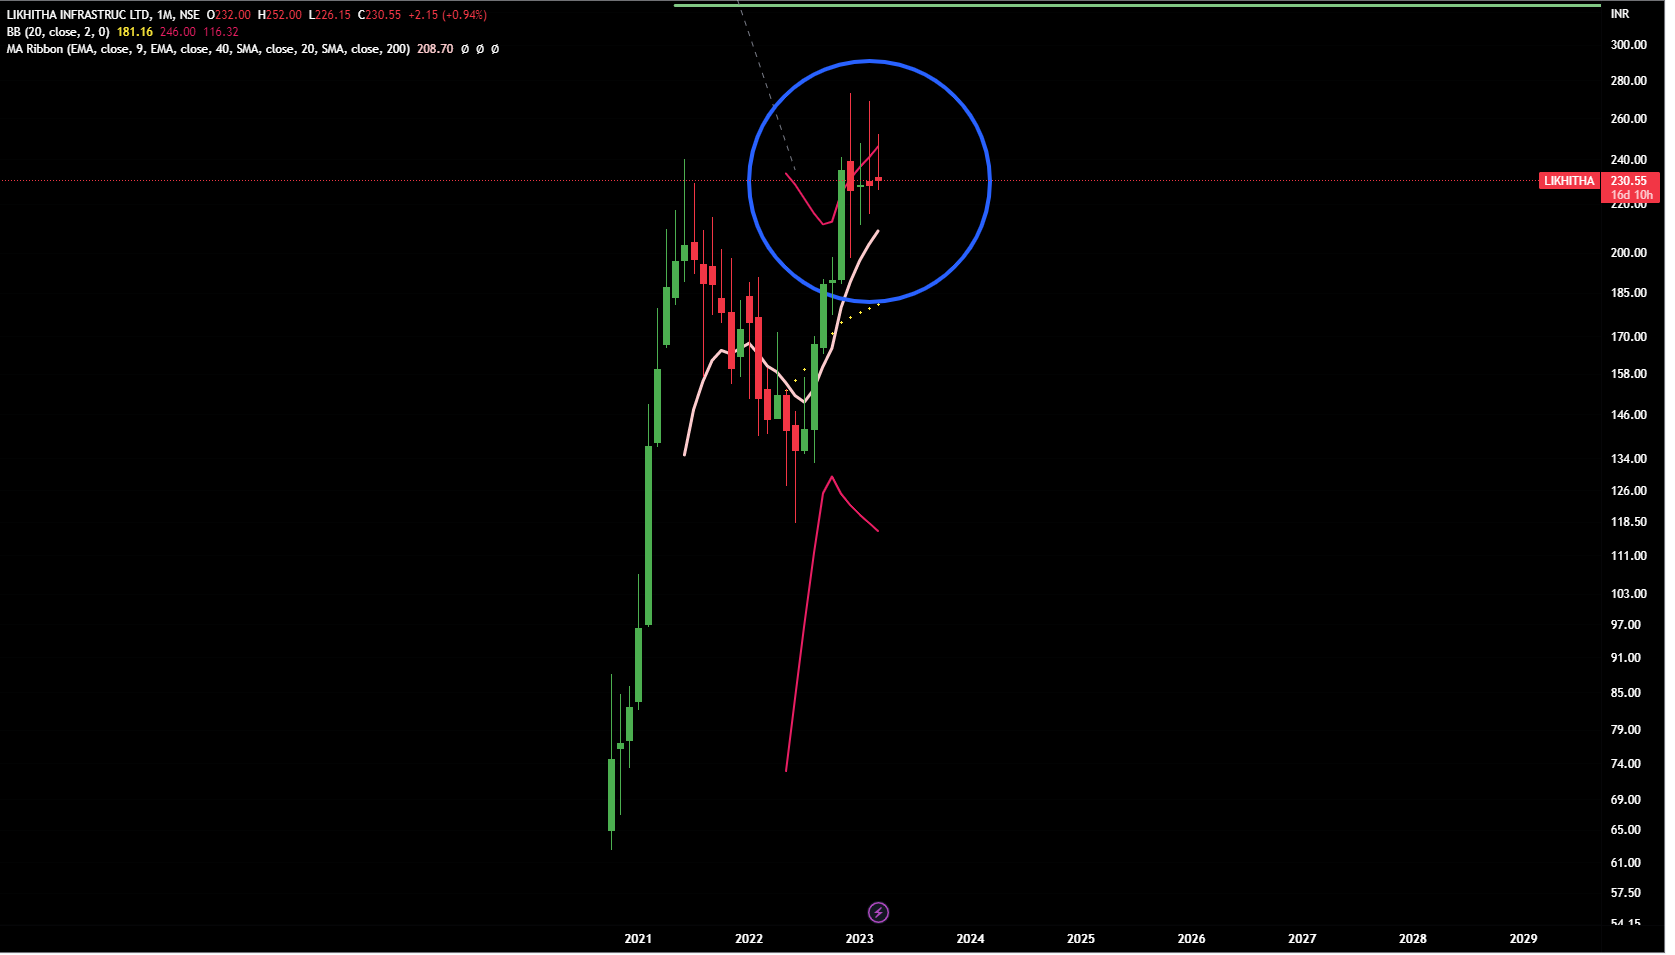
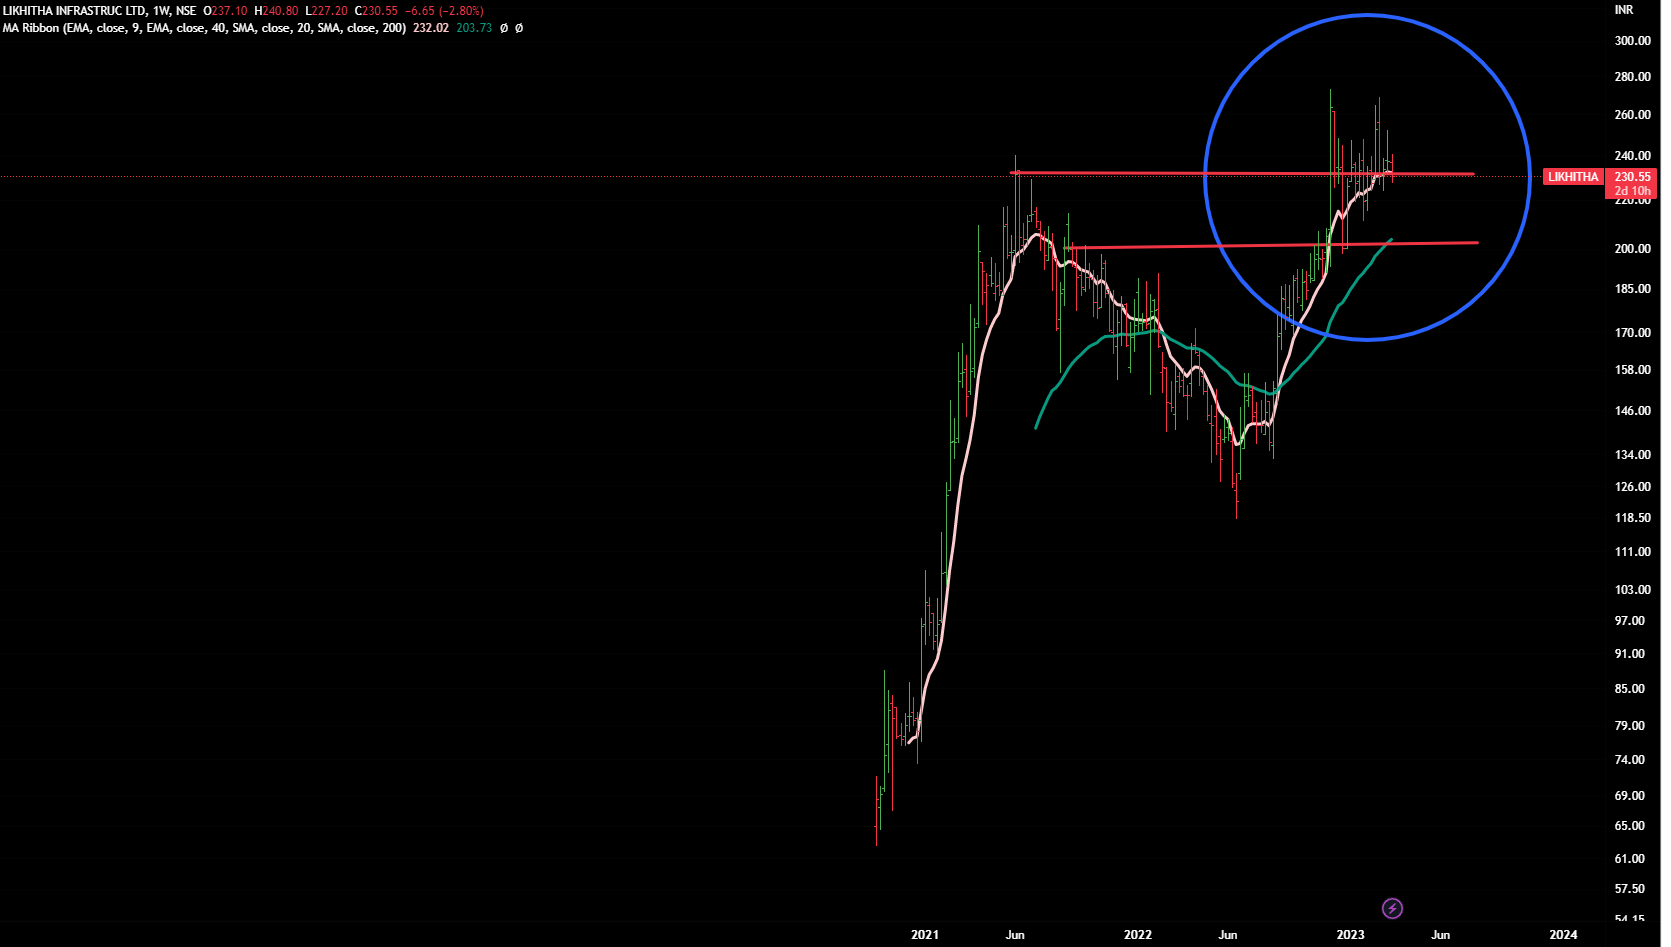
Likhita Infra
CMP -230
On monthly chart, we can see lot of candels with long upper wicks. That tells that there is lot of supply in upper zone. It should cross these levels with volumes if it has to go up.
Monthly Chart
On weekly chart , it is showing weakness at a crucial level. Any weekend close below the upper red-line will take it near to 200- lower red-line .
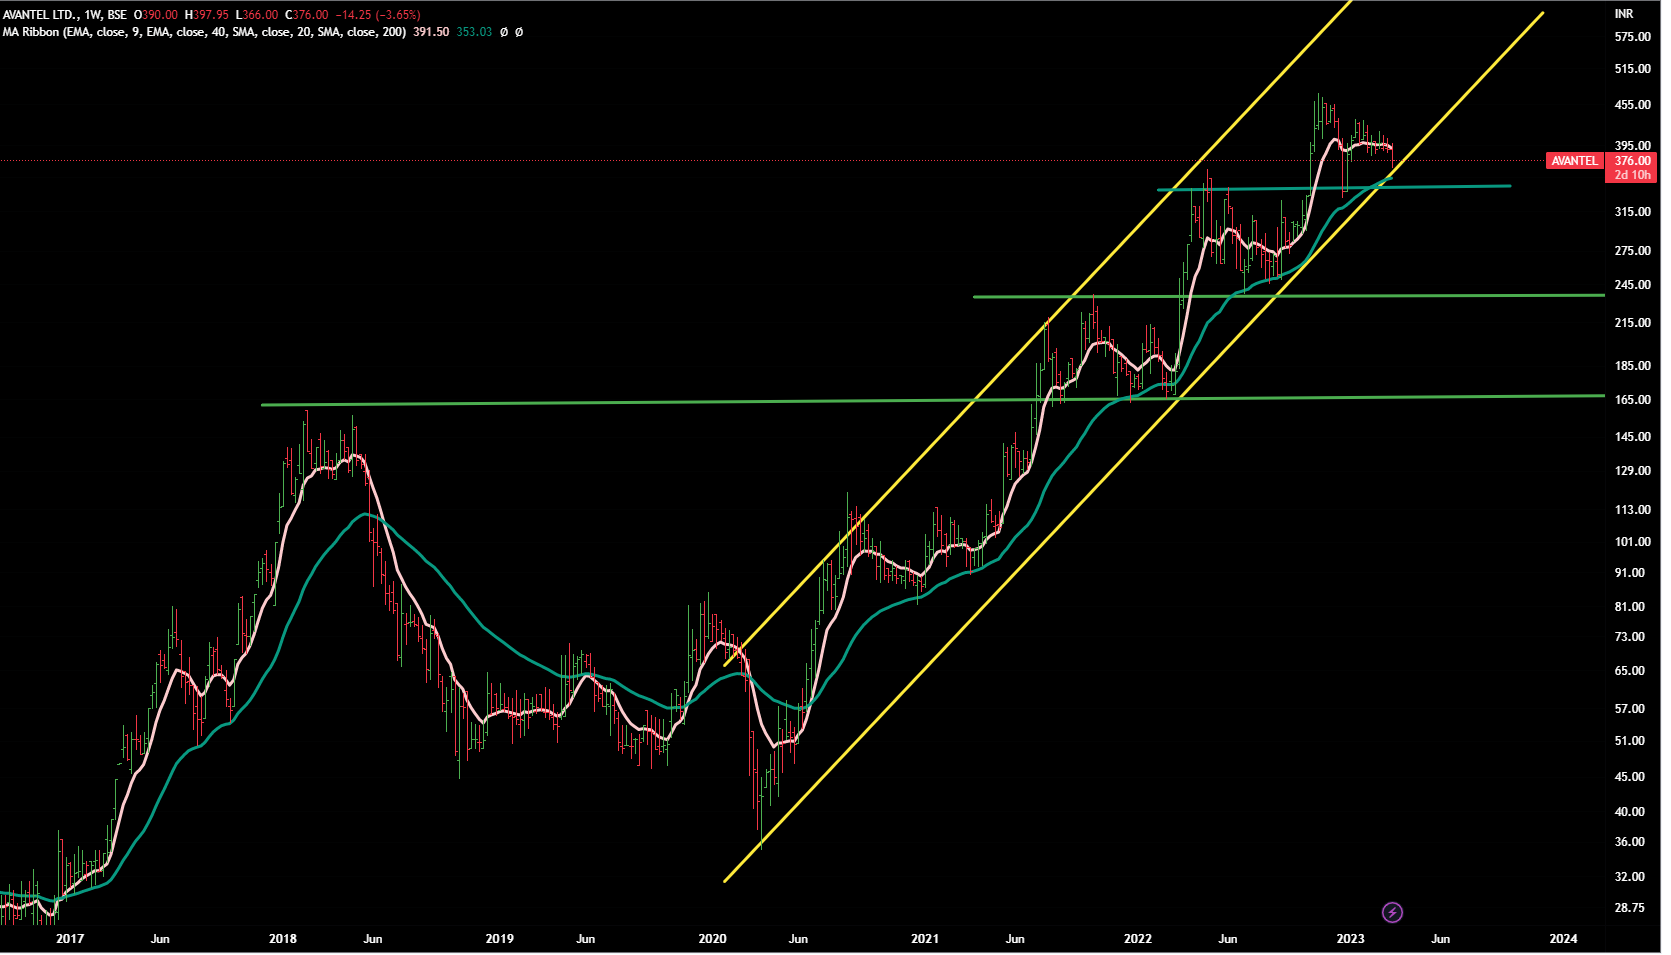
Avantel
CMP 376
To us, it seems that game is over. It can consolidate a bit , can rise a bit but it is very hard to see any big upside.
Keep a watch on the the yellow channel, any break of this channel and closing below 340 can take it to below 300 and then we need to keep to other support levels ( green lines)
Weekly Chart
Greaves Cotton
CMP 122
Well it is still in Stage 4 and correcting.
Nearby support is near 107 and if breached then we can see it going in the range of 100-90.
Monthly Chart