
That does not make difference on wave-count.
2 Likes
Hi, can you share the chart of Kalyan Jewellers
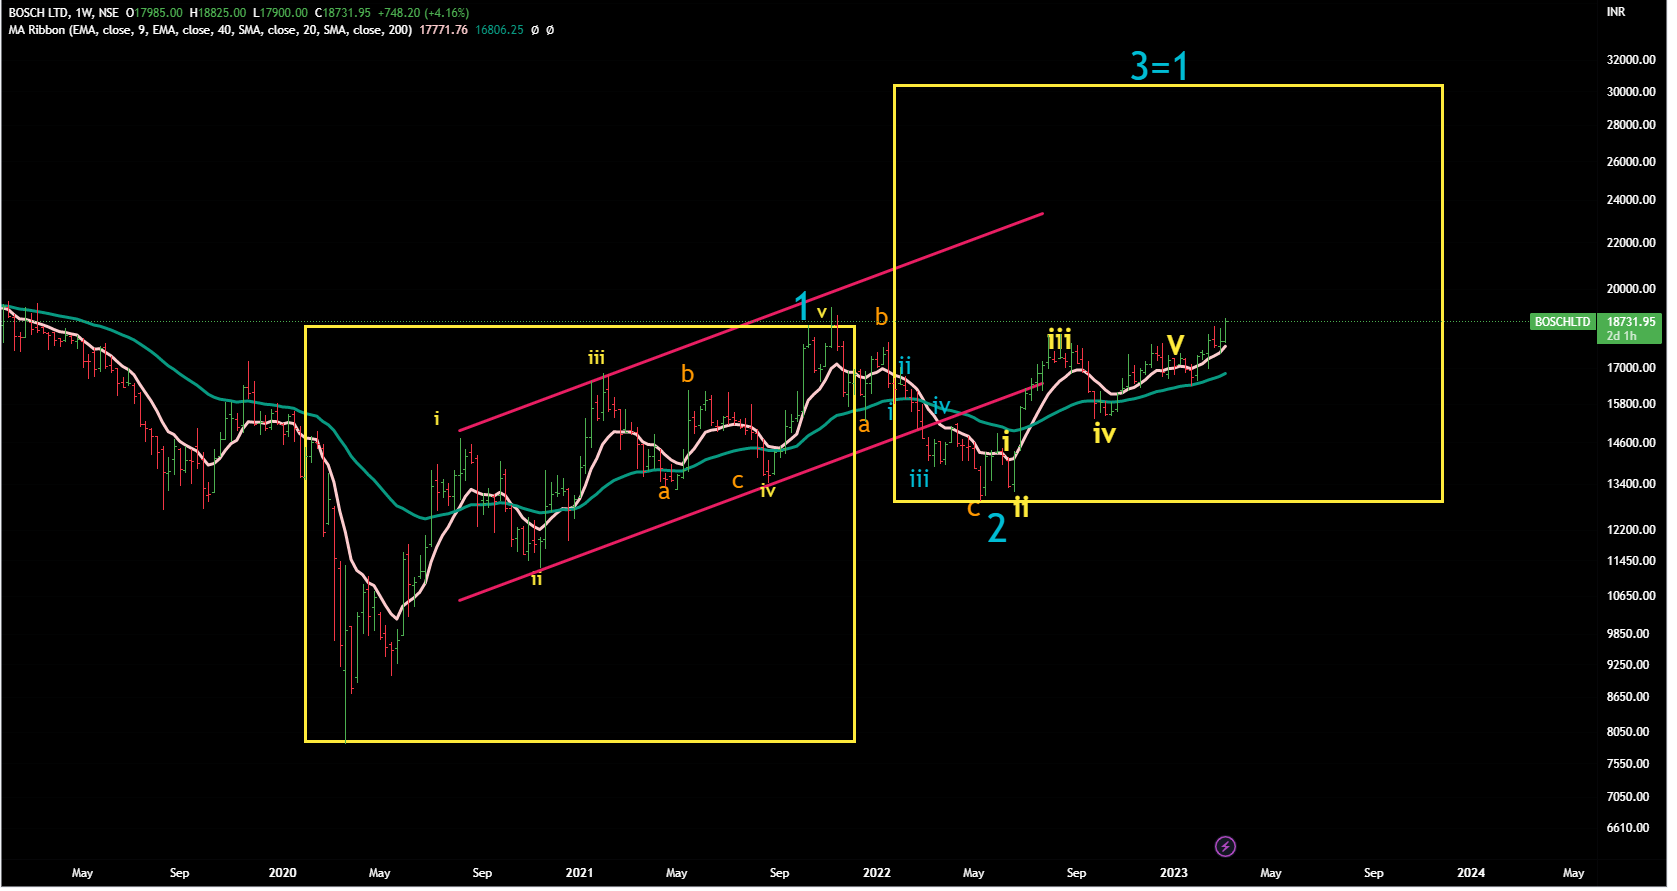
Bosch
CMP -18727
Can it rise 50% from here ?
As per EW counts, it is one of the probabilities outcome .
Next hurdle from today price is 19250 — if it starts trading and closing above that level, then we would have anoter confirmation.
Let’s keep a track.
Weekly Chart
Disclaimer :This post is just for learning few methods of price-patterns. Views are personal. No buy/sell recommendations. These are probability study methods and chances of success/failure depend upon various factors.
2 Likes
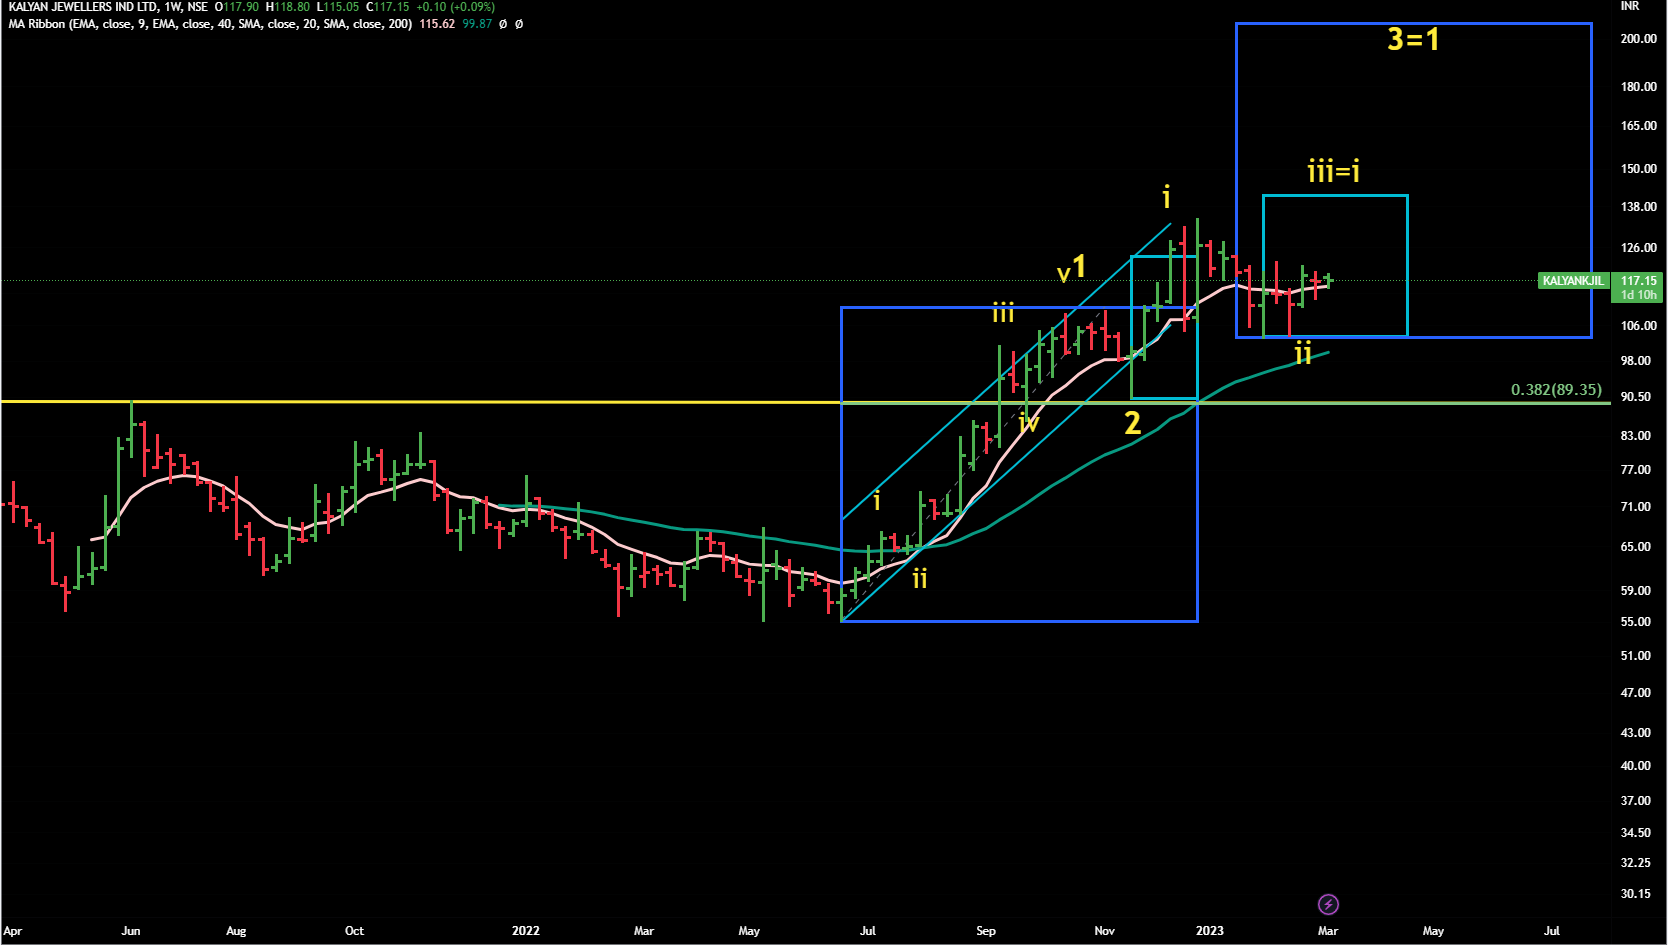
Kalyan Jewellers
CMP 117
As of now, it seems to be consolidating in wave ii of III.
Depending upon the overall market situation, it may consoildate bit more.
But of the market remains bullish, we might see it moving upwards towards completing its wave iii targets.
In overall , the stock seems to be in uptrend.Bigger wave 3 targets can take it beyond 200 in coming months.
But if it breaks 103, then need to very cautious. This whole set-up will fail and would turn more bearish below 90.
Weekly Chart
Disclaimer :This post is just for learning few methods of price-patterns. Views are personal. No buy/sell recommendations. These are probability study methods and chances of success/failure depend upon various factors.
1 Like
KRBL
CMP 369
Yesteday it gave 5% jump with double than average volumes and daily MACD turned to buy.
We re-assesed the stock based on EW prespective.
It made a pin -bar last week and that too after 50% retracement of wave 1. Many stocks tend to complete their corrections at these levels too.
If it maintains its momentum , then we can assume that wave 3 has started.
Immediate resistance is 371 - 40 DEMA .
Medium term resistances and further confirmations can be the red-lines -levels - 410-415 and 445 levels. Once it crosses and starts closing above these levels, then we can assume that , it is in wave 3rd. And it can corss 700 levels in that case.
Weekly Chart

Disclaimer :This post is just for learning few methods of price-patterns. Views are personal. No buy/sell recommendations. These are probability study methods and chances of success/failure depend upon various factors.
6 Likes
Sir , Request your Views on Tata Communications please
1 Like
Tata Communication
CMP 1215
Not very encouraging chart.
Green lines are likely support-levels.
Watchout for 1100-1110 levels …if that breaks then we’re heading down in C.
Weekly Chart

Disclaimer :This post is just for learning few methods of price-patterns. Views are personal. No buy/sell recommendations. These are probability study methods and chances of success/failure depend upon various factors.
1 Like
Could you please share views on Asahi India Glass, Quess Corp and Punjab Chemicals. Thanks in advance.
Asahi India
CMP -487
Only hope is a temporary bounce in coming few weeks.
But monthly MACD has to complete its cycle and till the time it is trading below 40 WEMA , we don’t see the start of longer term uptrend.
Weekly Chart

Disclaimer :This post is just for learning few methods of price-patterns. Views are personal. No buy/sell recommendations. These are probability study methods and chances of success/failure depend upon various factors.
1 Like
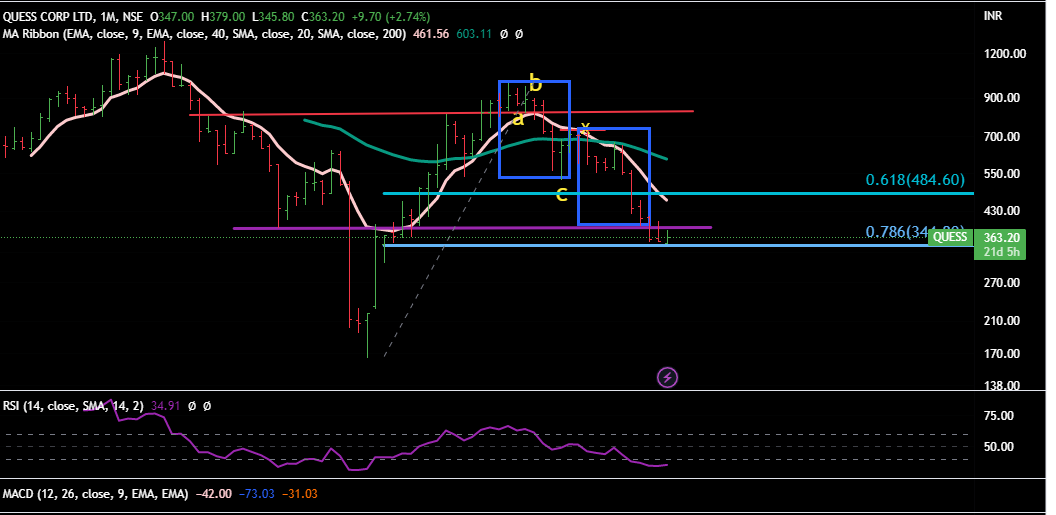
QUESS Corp
CMP 363
Chart seems to have damaged completely indicating that some structural issues are there in the business.
C > A - this happens in those charts where business -fundamantals have changed for longer period of time and lot of headwinds are there.
If we were looking at this company, we would avoid it till it does not give any clear indications of basig out, volume purchase as well as breaking some key MAs on upside.
Level of 344 is the last hope.Otherwise the plunge may be deeper.
Monthly Chart
Disclaimer :This post is just for learning few methods of price-patterns. Views are personal. No buy/sell recommendations. These are probability study methods and chances of success/failure depend upon various factors.
1 Like
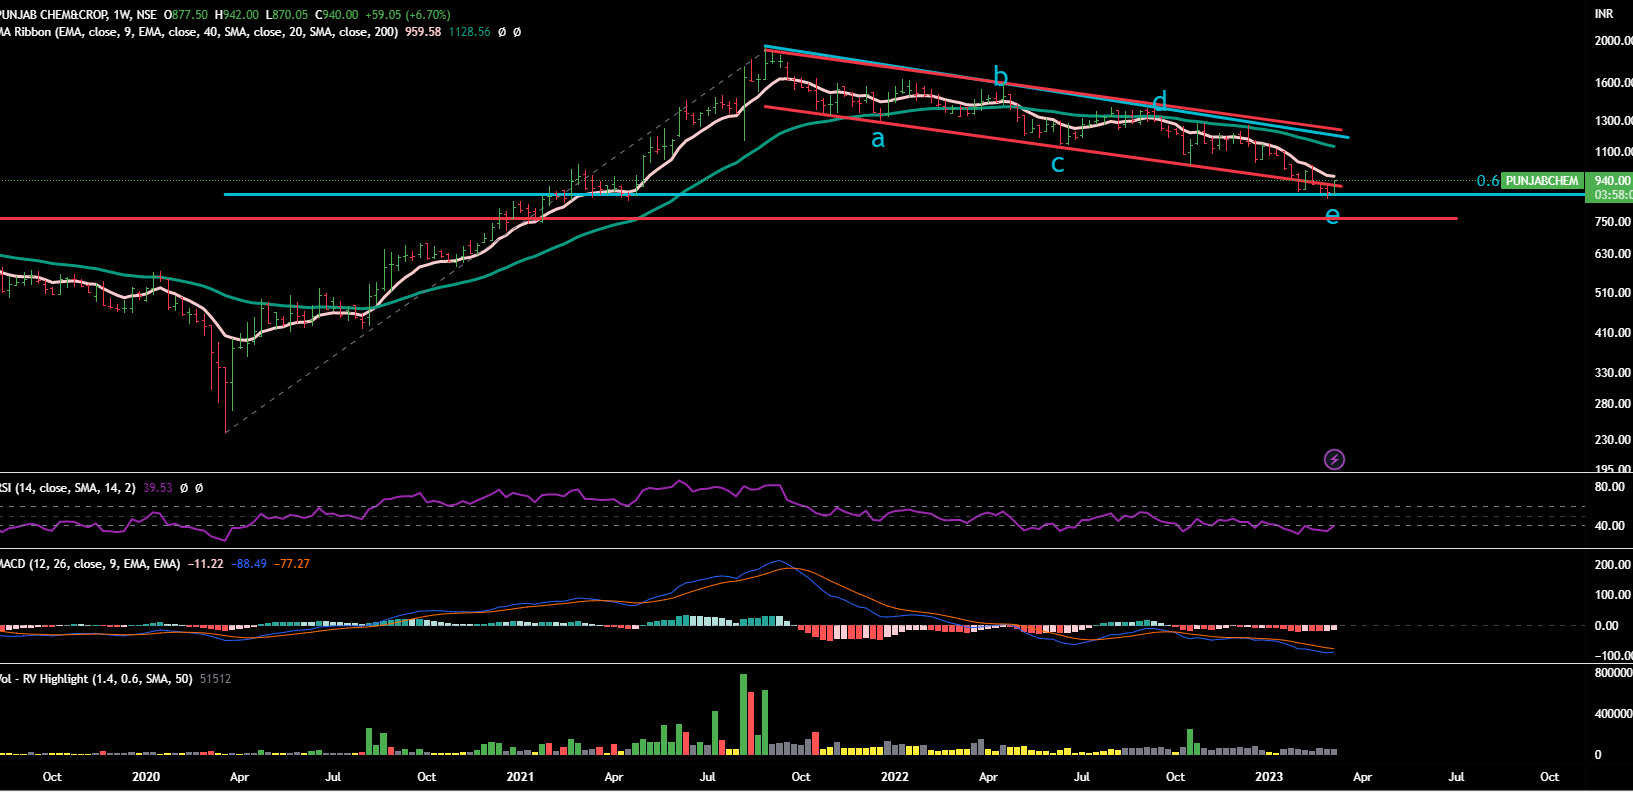
Punjab Chemicals
CMP 942
It is a wait and watch for us. It has completed one kind of correction pattern but gave a throw-under.
Many a times throw-unders indicate the end of correction but on many other occasions they indicate that they may fall more - this makes us bit doubtful.
Also it corrected upto 61.8% FIB level -many a times stocks bounce from these levels.
Other factor that support the baove theory is that RSI was not making lower low while the price was going down.
But again not sure - bottom-fishing is not easy ( that’s why we always suggest that let the stock start giving closing above 40 WEMA for few weeks)
Weekly Chart
Disclaimer :This post is just for learning few methods of price-patterns. Views are personal. No buy/sell recommendations. These are probability study methods and chances of success/failure depend upon various factors.
4 Likes
Can you kindly share your views on Tanla? Thanks in advance
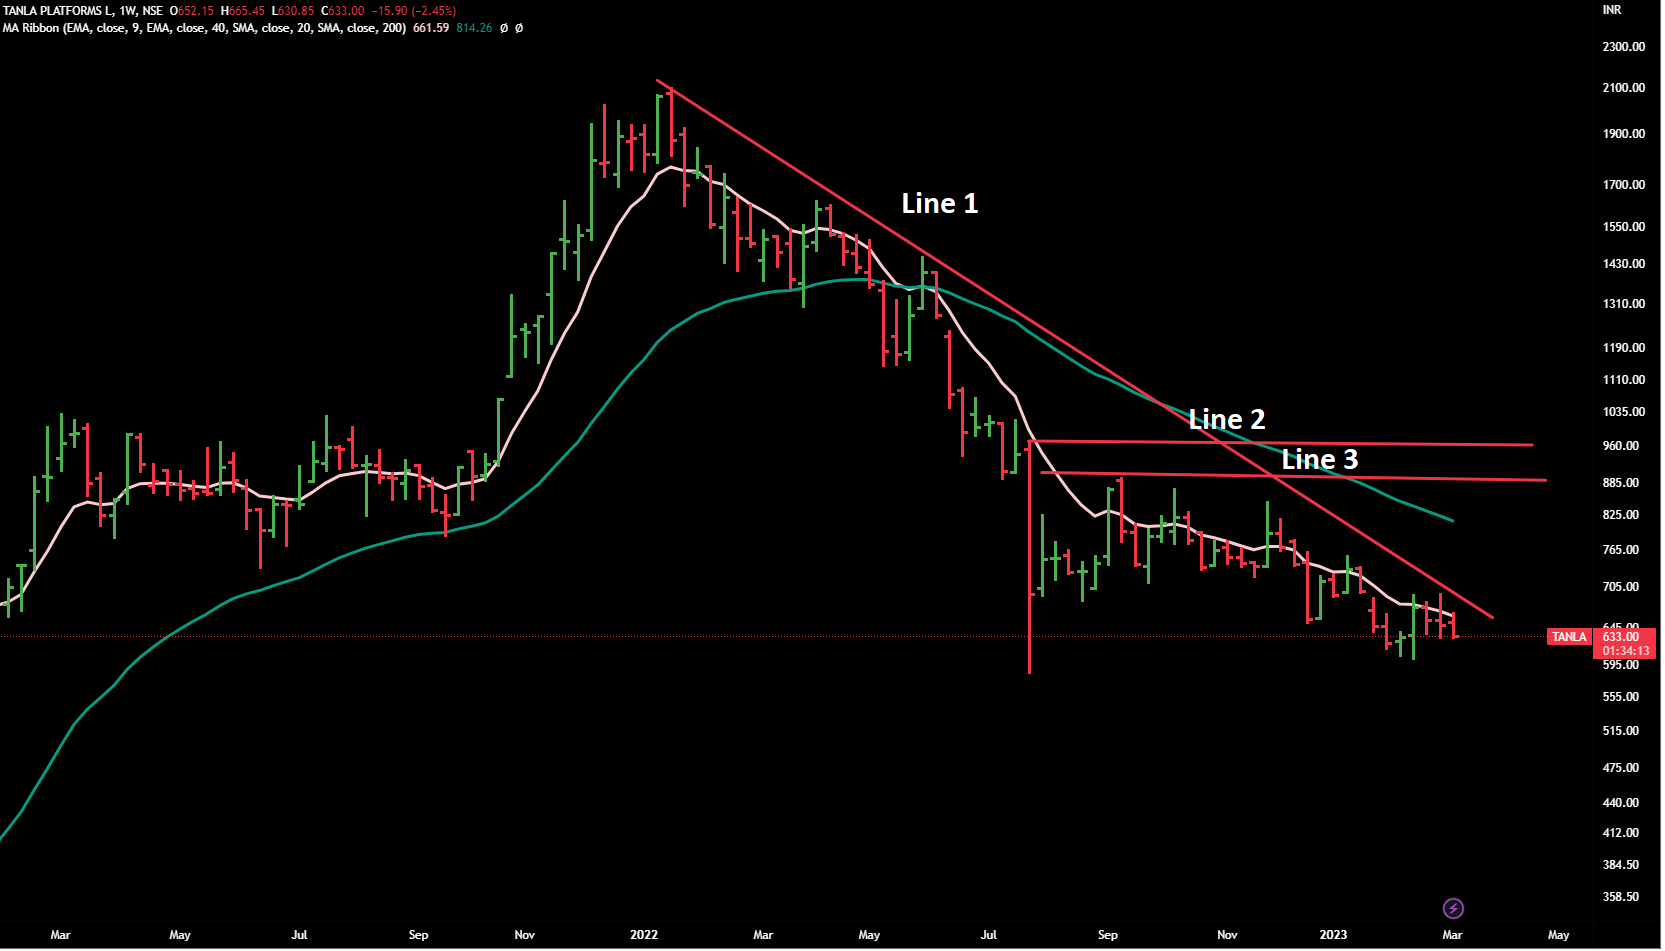
Tanla
CMP 634
फिलहाल इसका कुछ नहीं हो सकता ![]()
It is very simple to track these kind of falling stocks…Open the weekly chart…draw these 3 three red lines…till the time it does not cross and closes above these lines and that too with volume …it is very very difficult for it to go up.
Weekly Chart
Disclaimer :This post is just for learning few methods of price-patterns. Views are personal. No buy/sell recommendations. These are probability study methods and chances of success/failure depend upon various factors.
3 Likes
Hi, Can you kindly share your views on UTI AMC and Axis Bank?
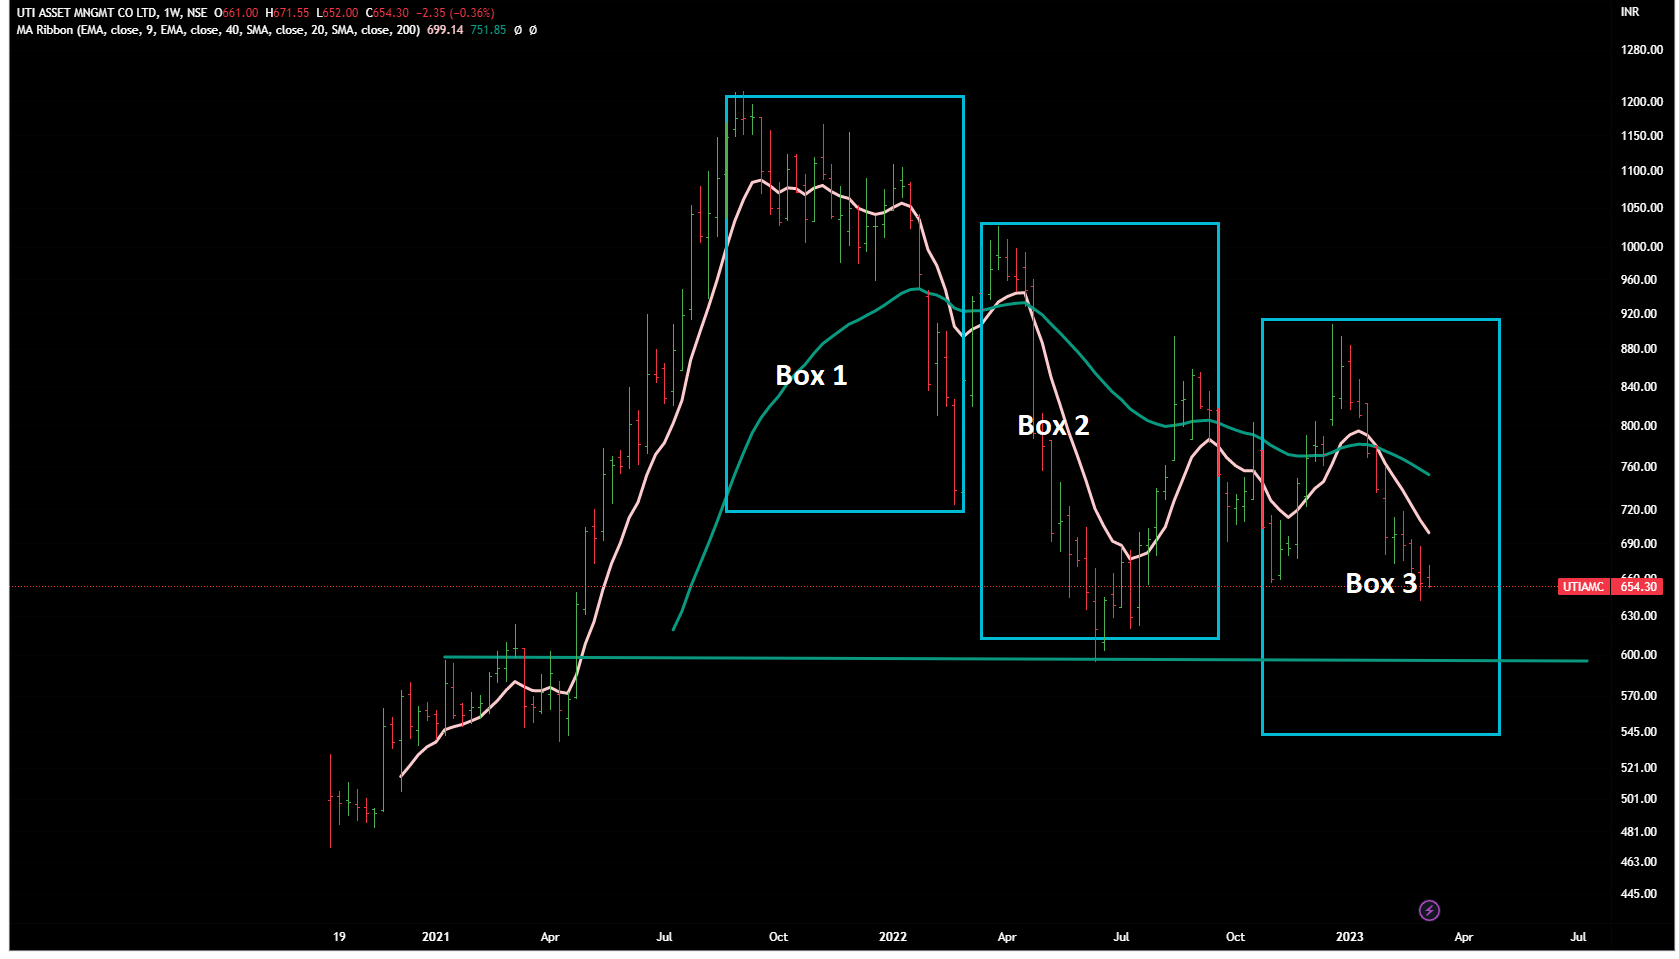
UTI AMC
CMP 654
Like other AMC stocks, it is obvious that it is in downtrend.
Now the question is where it will stop ?
Well green line is the support-level.
But if it breaks that too, then it may follow 3 Box (Dabba) Theory.
That means the stock will fall in 3 boxes at various levels. At the beginning we always assume that the last Box will be equal to the first box . (same thing happens on upward journey)
Weekly Chart
Disclaimer :This post is just for learning few methods of price-patterns. Views are personal. No buy/sell recommendations. These are probability study methods and chances of success/failure depend upon various factors.
2 Likes
@StageInvesting
I am a novice at EW and probably many on this forum ![]()
From your experience on nifty are we seeing irregular correction
I saw this post No 1 Article on irregular correction in EWT - Read Now and the pattern 5-3-5 kind of matches what we are seeing at the moment
Just trying to understand, not trading it.
If it is indeed irregular, what wave are we in?
Are we in wave 1 of C ?
If so will be see a pullback, and then the next wave could be quite painful ?
{edited}
Line 1 I understand it is the trend line.
But on what basis do we have to draw line 2 and 3 ?
We don’t track Nifty .
We don’t trade in it ,hence don’t want to waste our time and energy on the same.
We’re focused on set-ups of individual stocks. Hence we won’t be able to help here.
1 Like
Top of the past big red bars. That is supply -level.
2 Likes
Your view on Force Motors sir?
1 Like