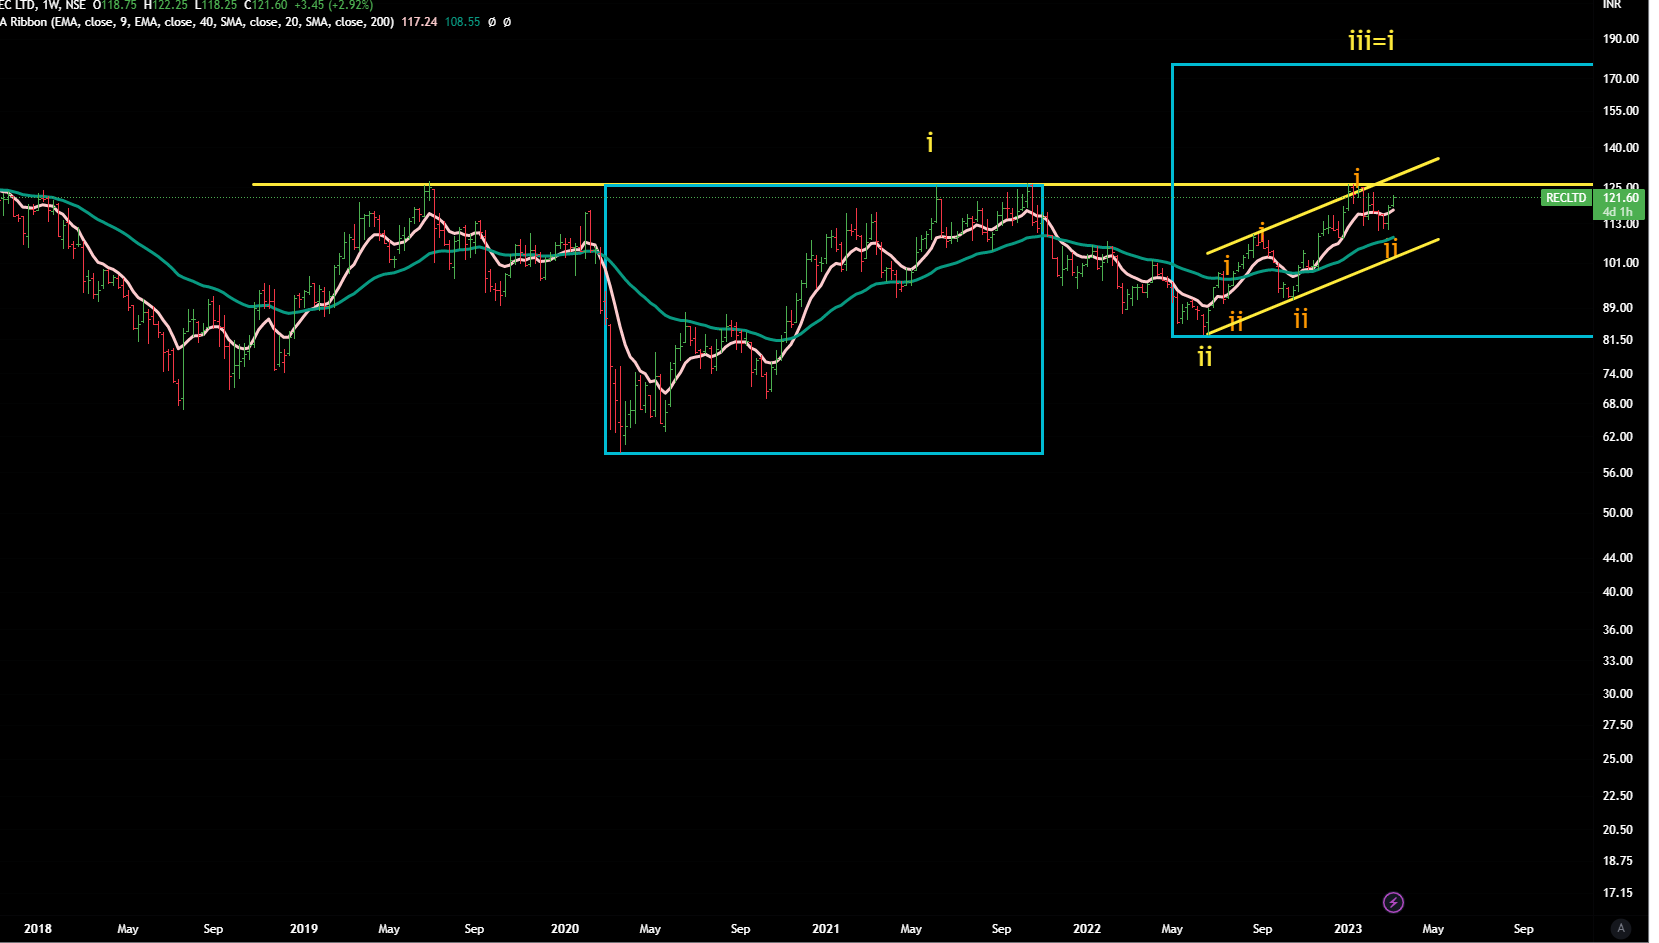
Well ,this is also showing intital signs of starting its final leg of its rally from Covid -lows. A trading opportunity as a positional (swing) trade.
It seems to be starting v of its 5th leg.
That is the final upside in this wave and after that wave 1 would be over and a lager corrrection in wave 2 will start.( that is why it is not an investment-level-price but a trading type entry)
And it is true in most of the PSUs banks, we might be in last leg of rally ( if that happens). If these set-ups work out, if one thinks about fresh investment at this level, better to exit after making some gains.
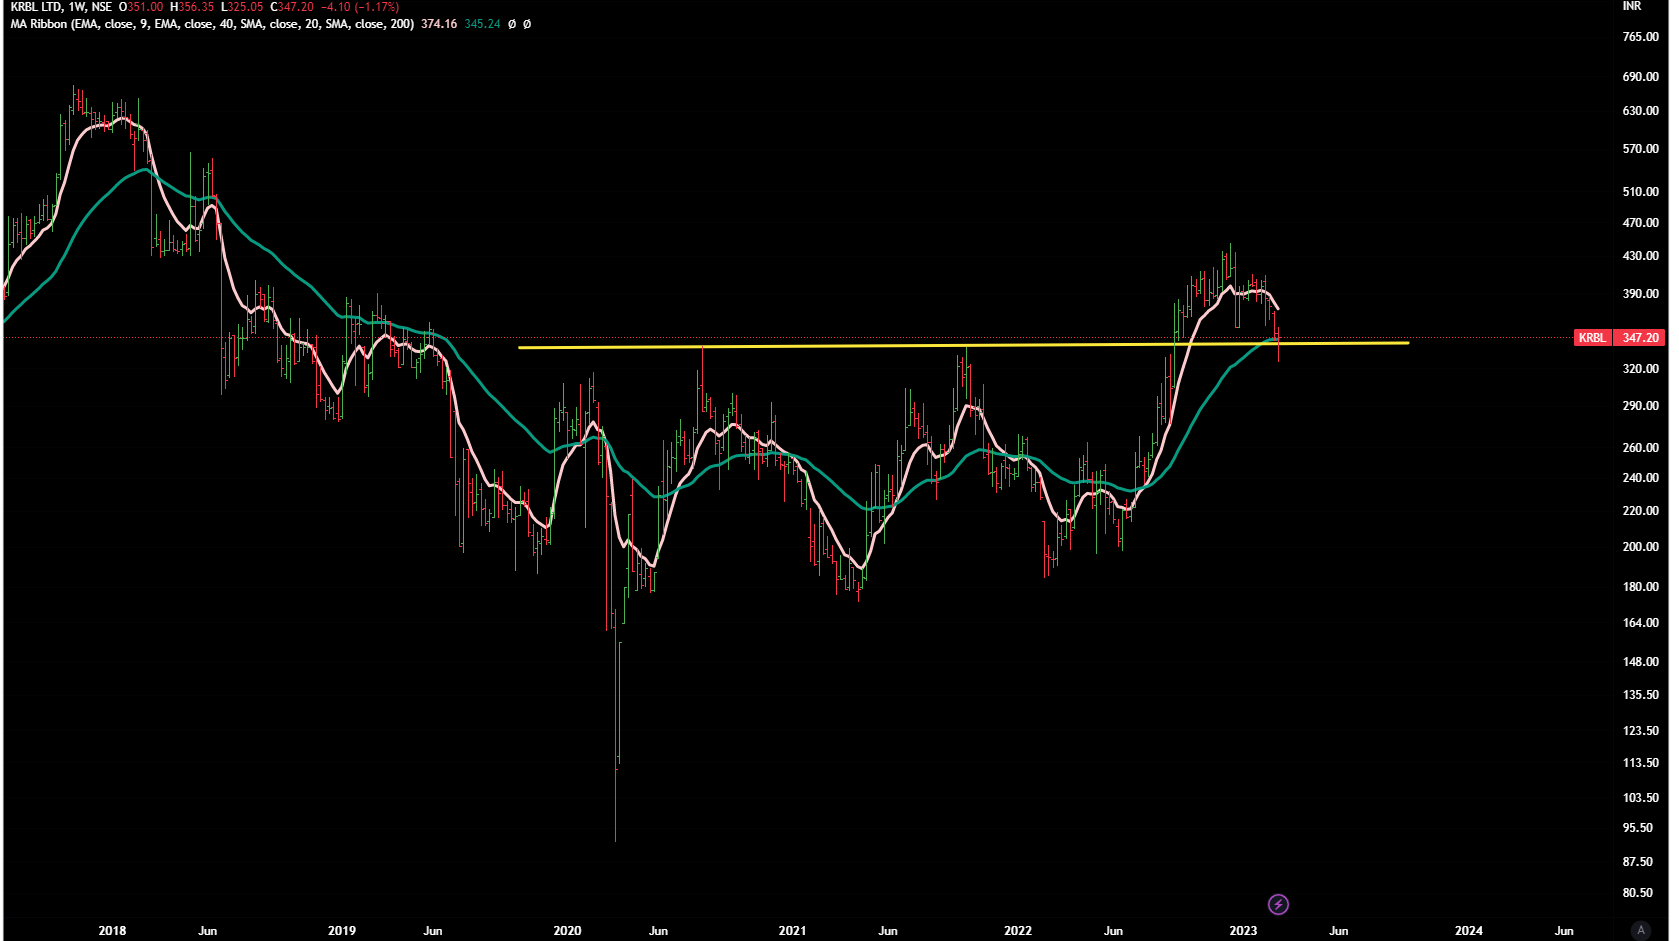
If it works out, it can touch minimum 400 ( v=i)
Daily Macd is in buying mode, there is a breakout on weekly RSI.Volume was good ( not great)
For further confirmation :
a) It should cross and close above 20 WEMA in coming 2-3 weekends
b) 341 is the next resitance level (red line)
c) Weekly MACD should turn to buy.
If we were investing in this stock , we would take first position now and keep on adding on further confirmations. Our stop-loss level would be at 270 ,
That means, a risk of losing INR 35 rupees and upside potential of INR 100 ie RR of 1:3 .
Disclaimer - Not invested.
This post is just an effort for learning few methods of price-patterns. Views are personal. No buy/sell recommendations. These are probability study methods and chances of success/failure depend upon various factors
Thanks for the reply . Request a few clarifications for my learnings :
You said it is the final leg ( V) of the final 5th leg which I understand is based on EW theory of 5 legs upward journey before correction starts in A , B , C wave . My query is how do we decide this 5 leg journey cmobined together right from COVID lows is part of the bigger Wave 1 . I mean why not bigger Wave 3 or Wave 5 , why Wave 1 only ? Why is the reference point taken from COVID lows only ( in that case this is Wave 1 ) ? what is the reasoning here ? Also , can you point out any other stock reference where it is part of bigger Wave 3 or Wave 5 ?
Is it possible that this goes on much above 400 target and larger Wave 2 correction doesn’t happen at all ? In that case , will it violate the 5 leg upward journey of EW theory ? Does it happen in your experience ?
Yo have shown in the image v = i of final 5th leg ? Why should it be v = i only why not less or more ? in which case the target comes 400
If at all , larger Wave 2 correction happens here as per your analysis , How should it move in this wave 2 ? I mean what could be various support levels in that case before it starts the larger Wave 3 journey ?
Why did you choose weekly chart to explain the 5 legs journey here ? Can we use Monthly chart to explain the 5 legs wave journey here ? In that case won’t our analysis & conclusion change significantly ?
I might have asked some silly questions . Bear with me for my learnings .
Thanks for asking some really pertinent questions.
Questions are the start of any new learning-journey.
Let’s address them one by one.
Well- you asking basic Elliot theory - difficult to explain in a post . For that, one needs to learn a lot . Would just say that wave number changes as one goes in higher time-frames…for example if one takes a 10 year time frame on any good company’s stock, all of them are in wave 1.
If you want to learn more , you can start from here and if you find it interesting then you can read this book . And later stages , you need a mentor , a serious practitioner .
Keep in mind that it is not exact science, it is an art and may need few years of experience to master it as it throws many possible- outcomes and on the basis on experience you need to short-list the preferred outcome.
Yes possible. One of many probabilities.But based on our experience, we wiil assign less weightage to that outcome.
Read basics of EW , you would get the idea.
Corrections can be of many types, we follow the price -action to determine the type.
Nope it does not change.
Sorry that we can’t answer everything in detail as that would need a whole post equivalent to a thick book.
Rupesh ji- Based at the choice of the companies you’re asking (now and earlier), we have two requests for you
a) Please start reading about fundamentals of the companies either in one the threads here or via annual reports.Then you would just ignore these type of companies.
Keep in mind that the market is a serious place and like any other proffession, it rewards only hard-working people who are ready slog in for gathering knowledge and analyzing.
If we treat the market as a gambling place then the returns would also be similar to what a gambler gets. And most of the times, gamblers end up losing and house takes all the money.
B) Learn some basic technical -knowledge by studying about stage investing here.
This is very basic and very easy to learn for anyone having an average IQ.
If you can get even 10% of whatever is written in this article and can practice it, then 90 5 of your questions would be automatically answered.
We’re addressing two of the companies that you asked -but we would refrain ourselevs if you ask about penny or kachra stocks in future as these are just wasteg of time for us, for you as well as other readers. Vodaphone Idea
CMP 6.90
It would keep moving in between these yellow lines untill Birla group or givernment does not take a fresh approach to the same.
Any significant movement can happen only of it breaks these yellow lines on either side. Monthly Chart
Disclaimer - Not invested.
This post is just an effort for learning few methods of price-patterns. Views are personal. No buy/sell recommendations. These are probability study methods and chances of success/failure depend upon various factors
Disclaimer - Not invested.
This post is just an effort for learning few methods of price-patterns. Views are personal. No buy/sell recommendations. These are probability study methods and chances of success/failure depend upon various factors
Well we’re tracking this and waiting for confirmations.
Like other PSU banks, these are early days - need few more confirmations to take any significant positions.
If we have to ride this, we would take first intial position if it trades and closes above firtst red line ie. above 18.50. Green line is initial support level (S/L)
Next additional position beyond 21.50 and would add more if it starts closing above 21.80 .
DCB bank - as of now PSU banks look better than private banks , so avoiding the analysis here. Disclaimer - Not invested.
This post is just an effort for learning few methods of price-patterns. Views are personal. No buy/sell recommendations. These are probability study methods and chances of success/failure depend upon various factors
Ok…but looking the chart from longer time frames clearly shows that years of consolidation and retest of breakout is happening…I would expect it to hold 330 levels on monthly and even in weekly closing basis…Would love to see how chart unfolds and reaches ATH
You stated the stages - that were wrong and we tried to correct those based on our learning.
Stage analysis is done on weekly chart.
The method was designed and popularised by Satan Weinstein in the following book and you can check the same by reading it.
We just follow his fundamental rules with few changes in it (40 WEMA vs 30WEMA and 9 WEMA vs 10 WEMA) and add few other chart-reading techniques. Our reply is limited to that context only.
can you help me with site you use, where I can save the graphs with MA & Stage wise analysis along with portfolio watchlist & fundamental analysis
currently I use google finance for PF ( mock drill), investing.com for TA (but cannot track old work) & screener for fundamentals - any recommendation on all in one kind of meal…TIA
TradingView is one place…as a beginner the free versiion is fine. You would get more details in using MAs in Stage Analysis article. And wrt making watchlist , you can use the same site.
For fundamentals checking, SCREENERS.IN and Tijori are good .
First of all ,let’s clarify that there’s nothink known as Stage V in Satge Analysis.
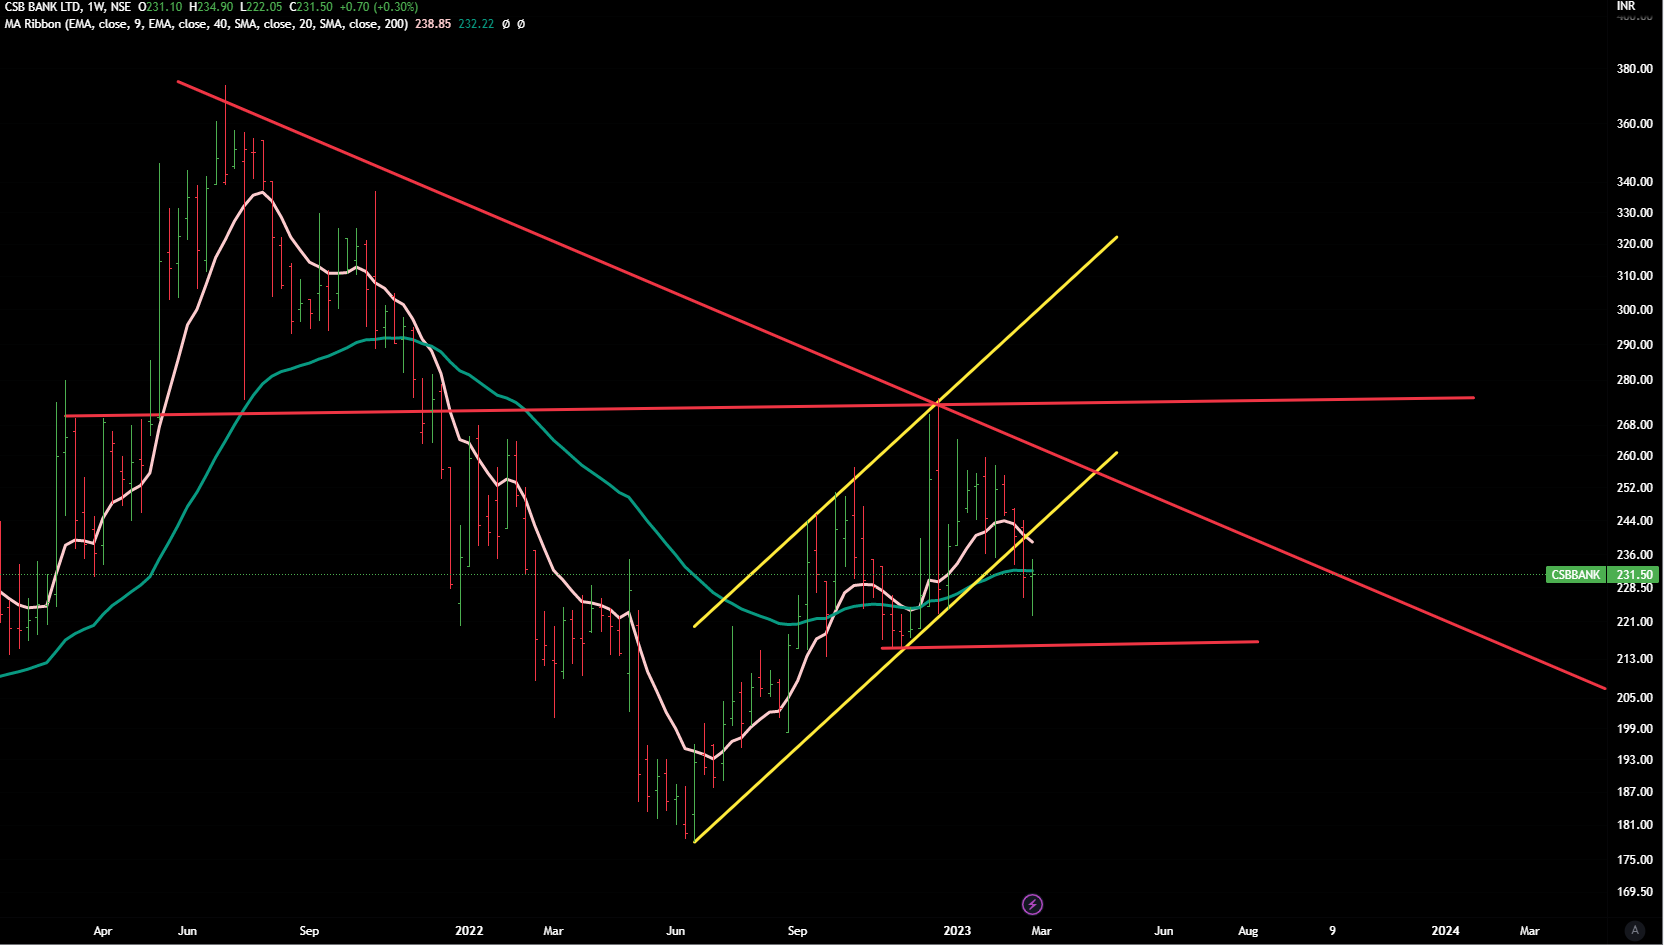
As far as CSB is concerned, it does not very promising. It is still below 40 WEMA .
It has broken the rising channel ( drawn from June 21 lows).
Red lines on the chart show imprtant support and resistance areas ( on lower side 215 is the support and on upside 265 -275 is the resistance zone) . If the stock starts closing beyond these levels for few weeks (with volumes) , it would move in that direction. Weekly Chart
Disclaimer - Not invested.
This post is just an effort for learning few methods of price-patterns. Views are personal. No buy/sell recommendations. These are probability study methods and chances of success/failure depend upon various factors
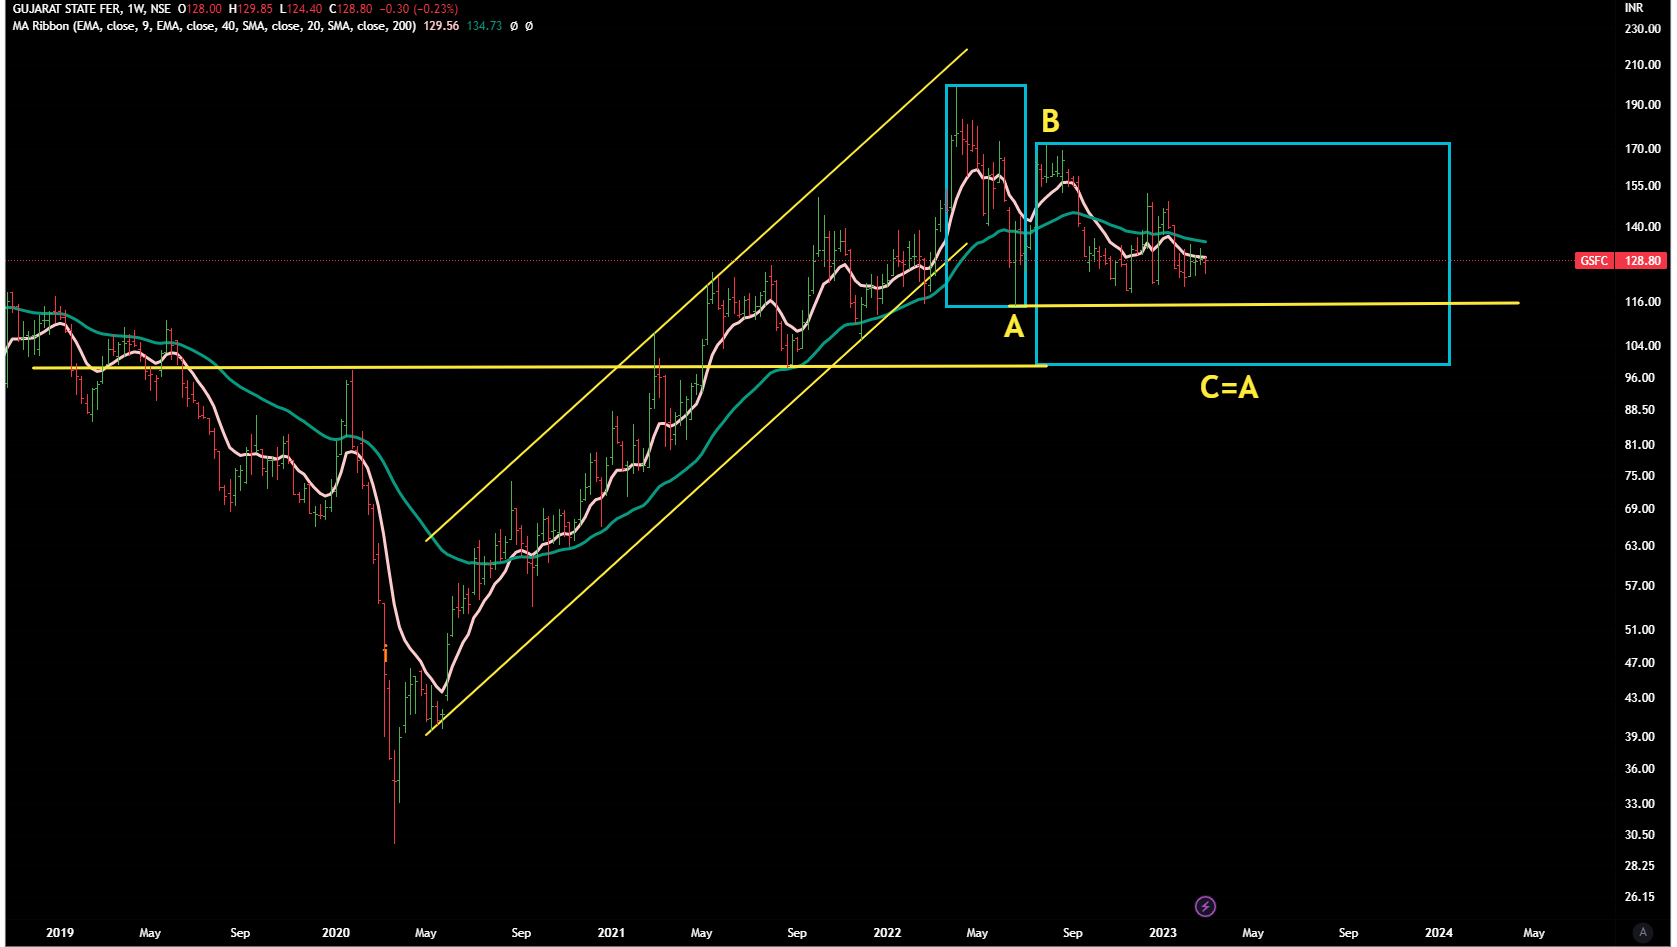
Let’s track. 126 -127 is an important resistance level. For sny significant upmove it needs to cross and close above the same for few weeks. Weekly Chart
Disclaimer - Invested.
This post is just an effort for learning few methods of price-patterns. Views are personal. No buy/sell recommendations. These are probability study methods and chances of success/failure depend upon various factors
Like said several times before, EW always presents lots of probable outcomes.
One can choose based on overall macro scenario as well as market sentiments.
We’re little uncertain on commodities (metals) - on one side it seems that they should remian subdued due to US FED fighting the inflation but on the other hand , China -re-opening as well as liquidity infusion by certain country’s banks suggest that commodities may re-start their bullish phase but this all may happen in a slow manner.
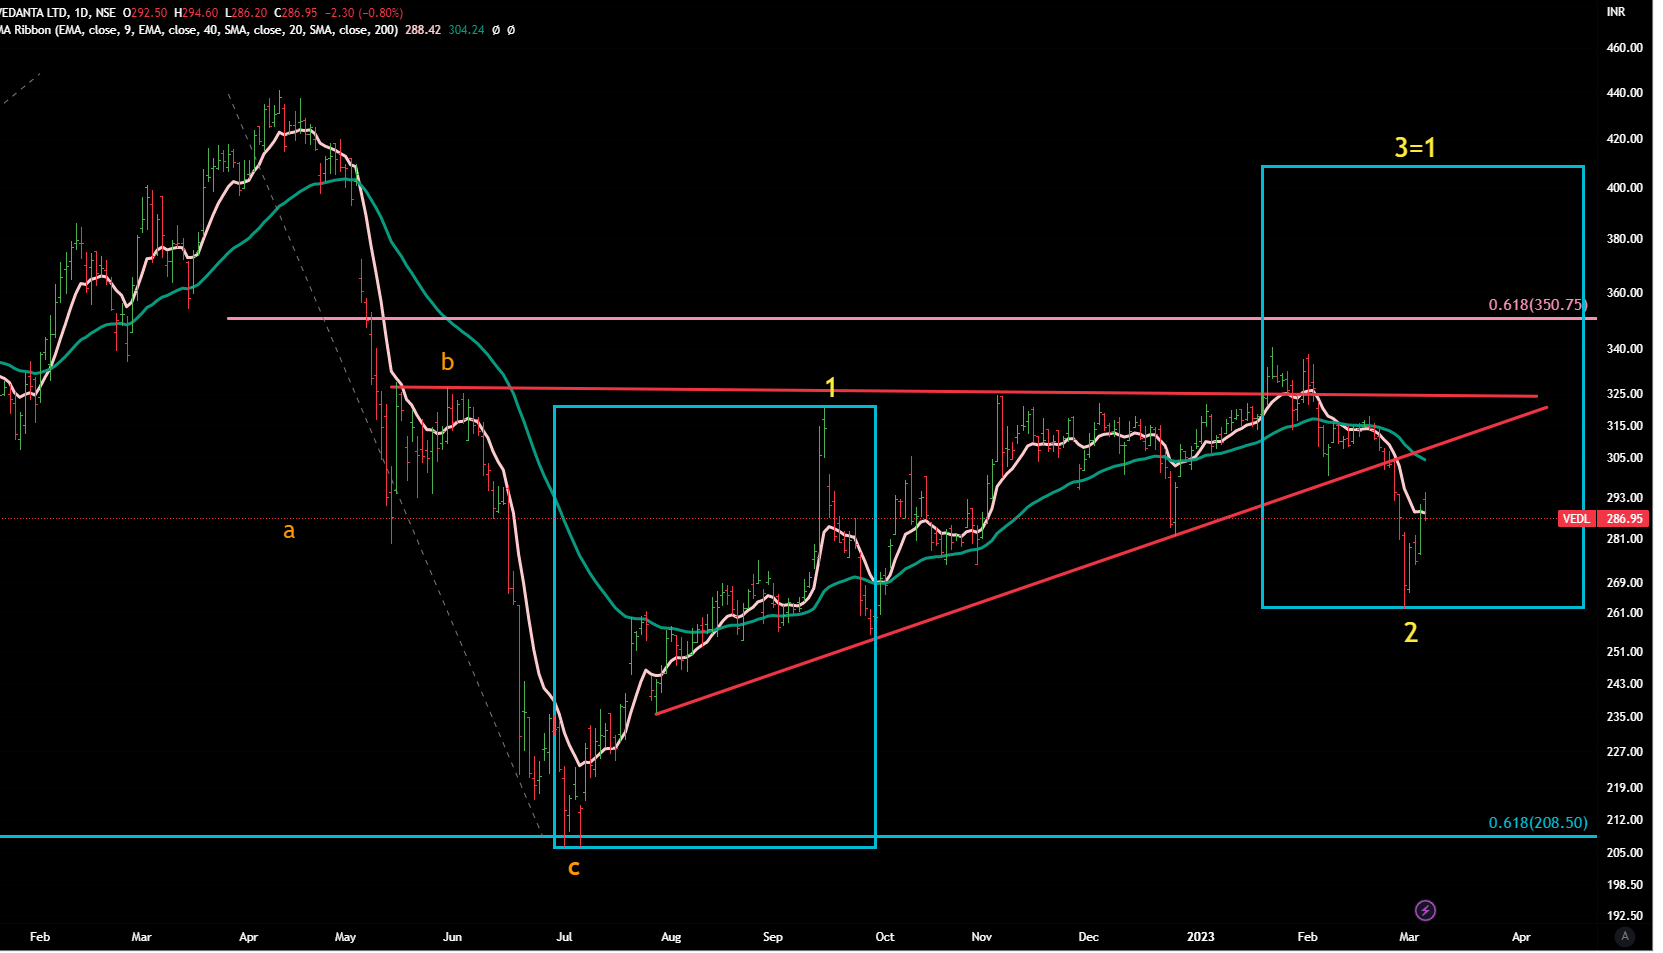
We gave the bearish view in above post, here we provide the bullish view.
But there are certain conditions for this to play out ::
a)It should cross and close above the horizontal red-line
b) It should start trading and closing above 40 WEMA and later on above the level of B (pink line)
c) It should turn towards buy on MACD of all time frames
Disclaimer :This post is just for learning few methods of price-patterns. Views are personal. No buy/sell recommendations. These are probability study methods and chances of success/failure depend upon various factors.