Disclaimer - Invested.
This post is just an effort for learning few methods of price-patterns. Views are personal. No buy/sell recommendations. These are probability study methods and chances of success/failure depend upon various factors
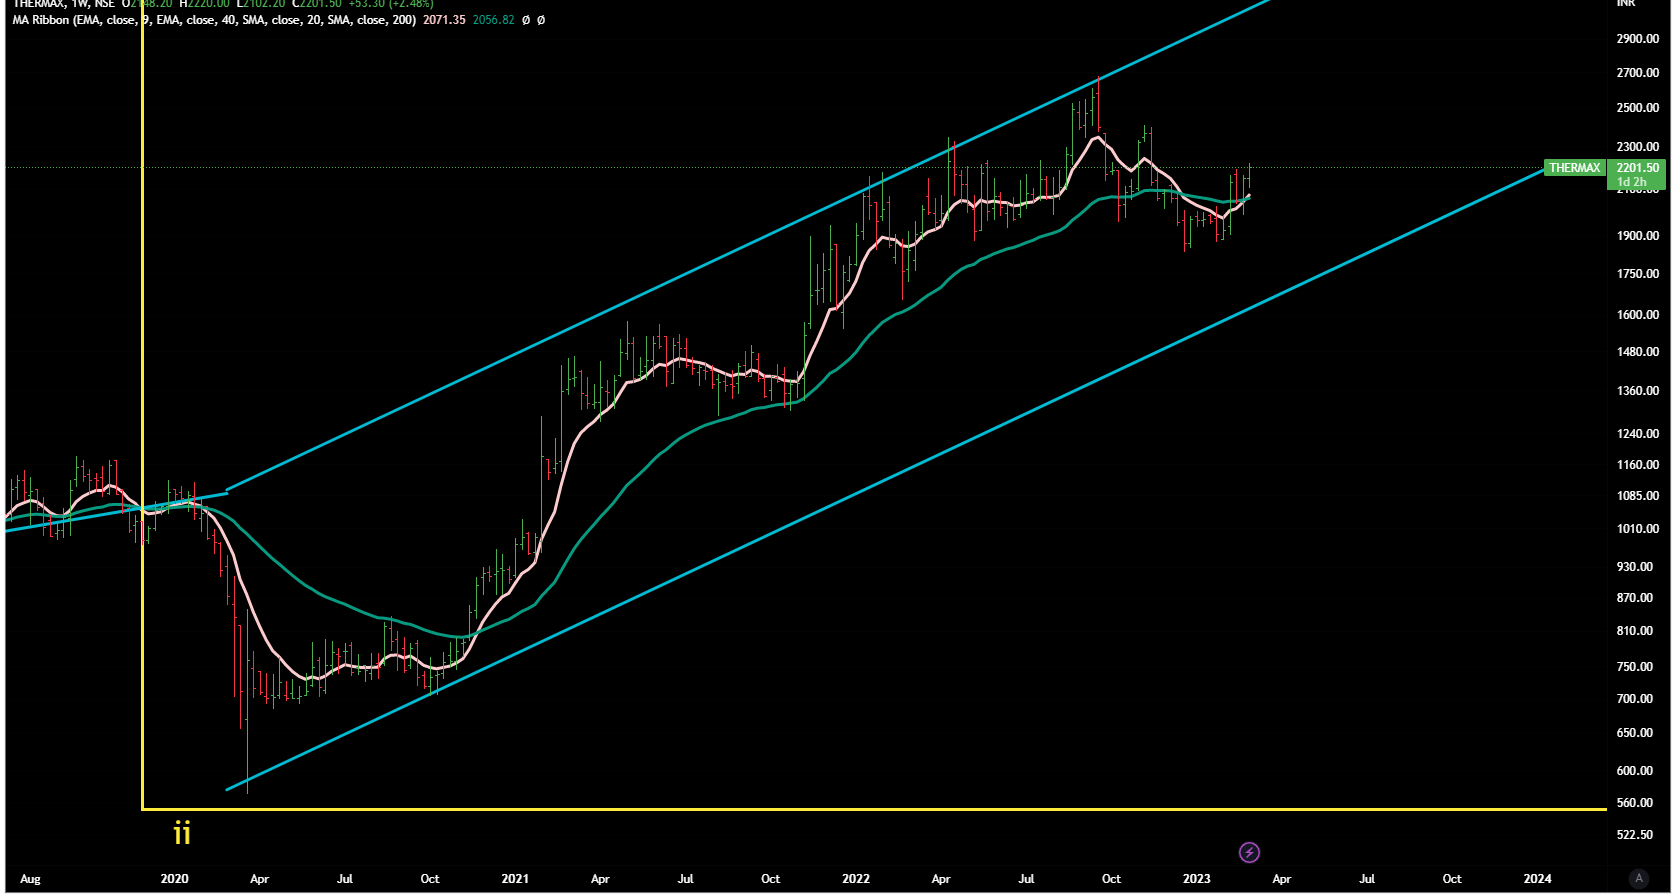
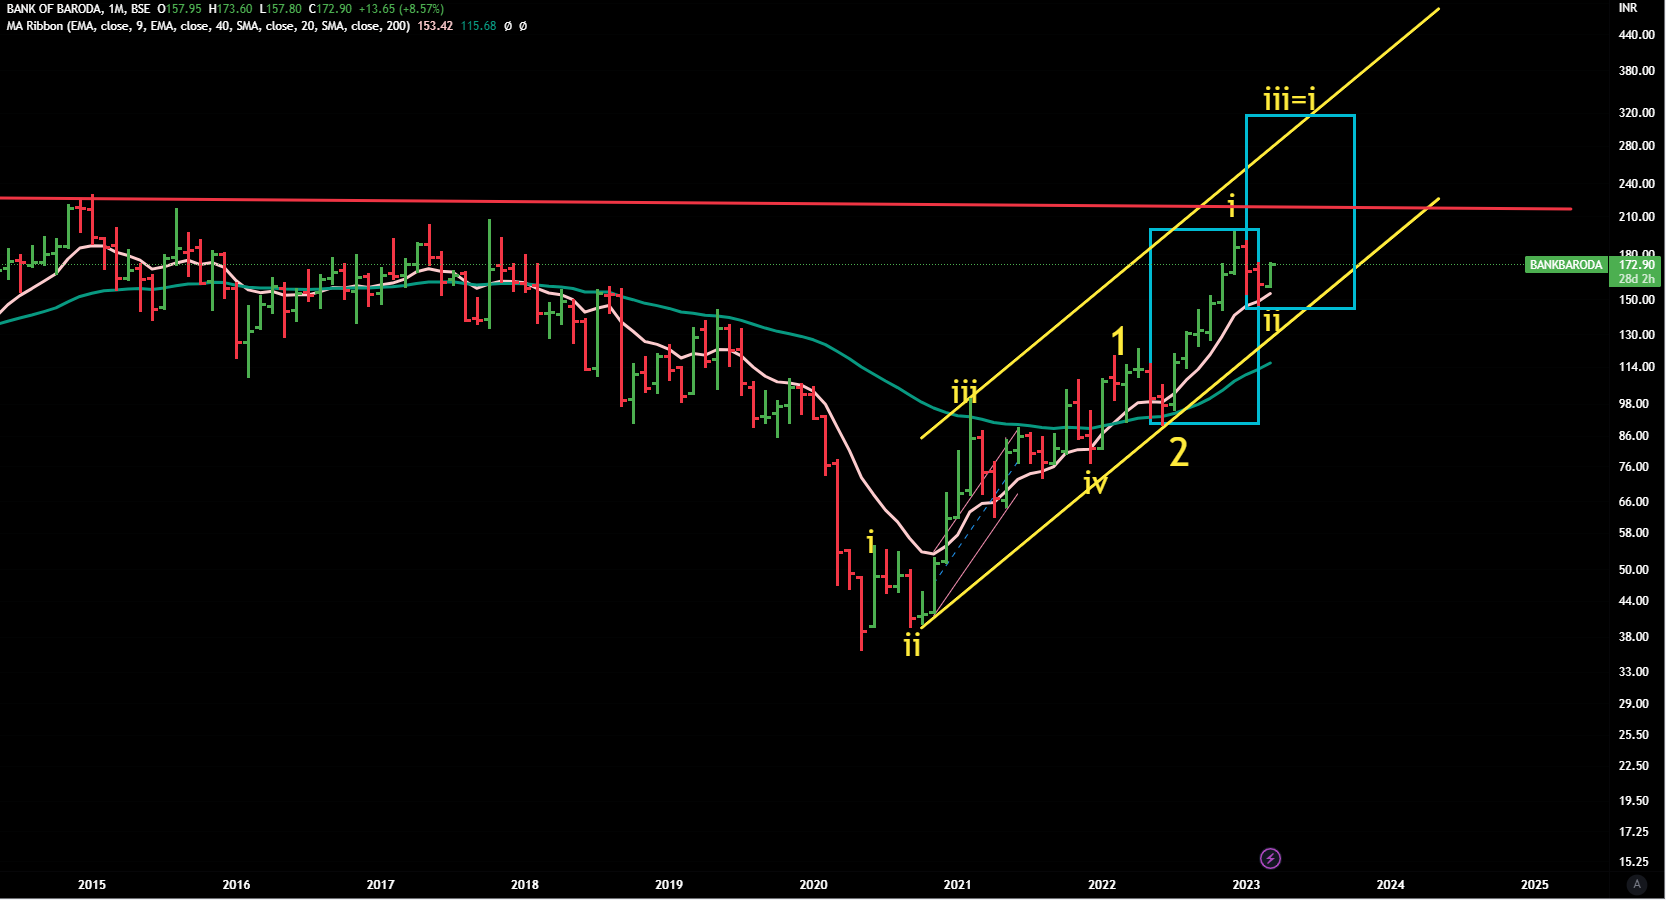
For a reliable upside move it should cross and close above its ATH with good volumes otherwise we would expect only a rangebound movement. (stock became 8-9 X since Covid lows , genrally one should give rest to these )
Disclaimer - No position
This post is just an effort for learning few methods of price-patterns. Views are personal. No buy/sell recommendations. These are probability study methods and chances of success/failure depend upon various factors
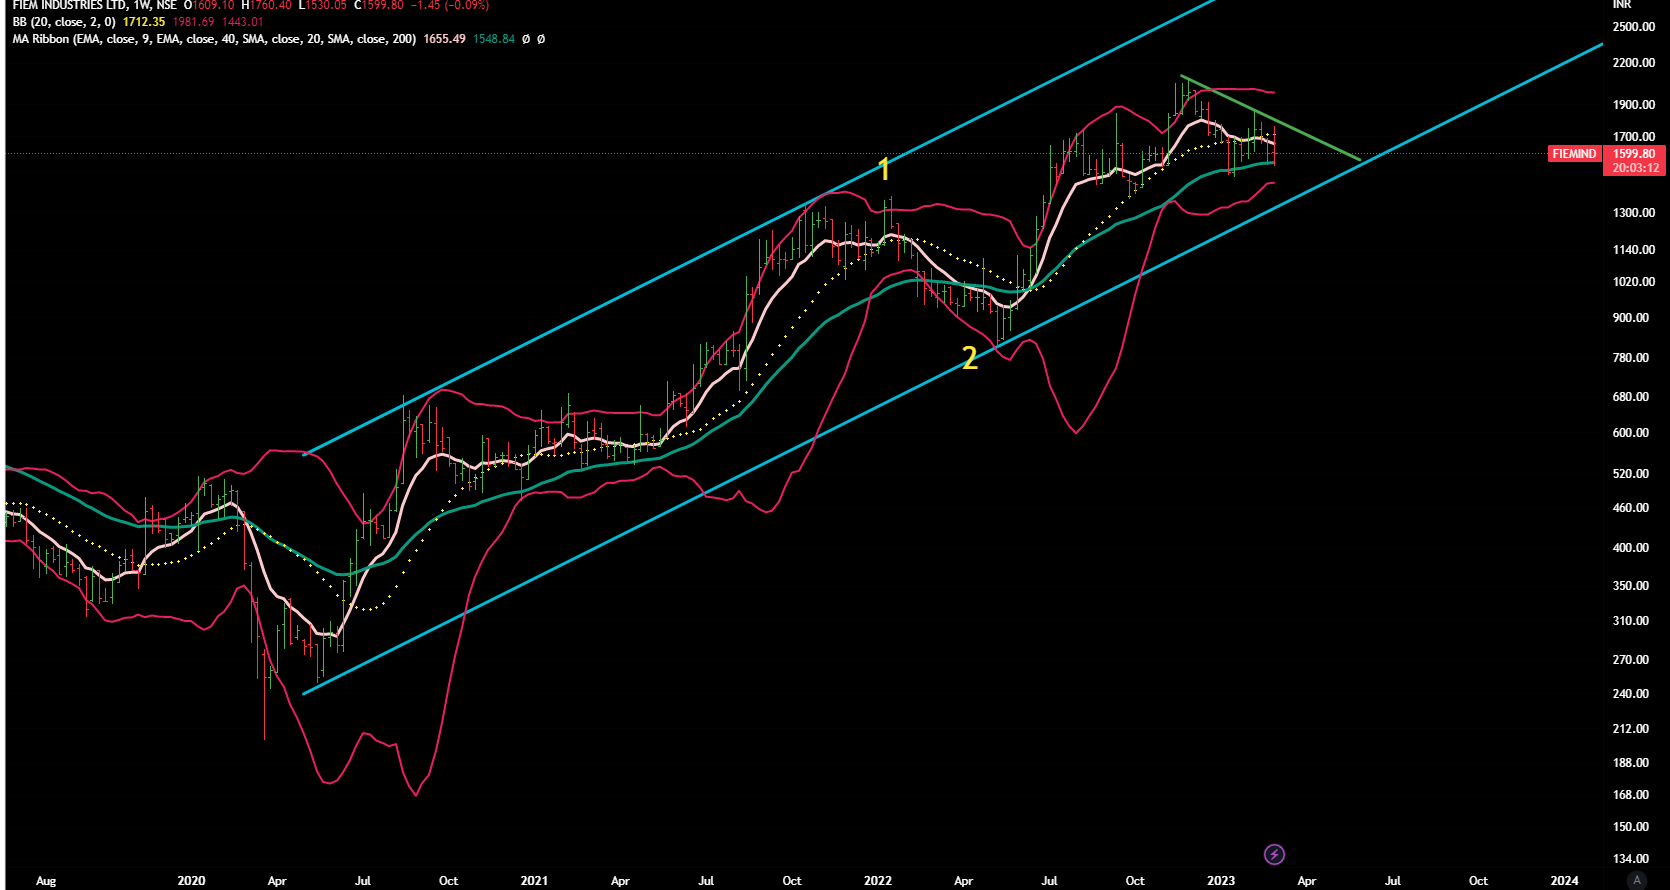
charts definitely do tell a story - if u see this story is playing out fundamentally also… next 2-3 quarter results would be bad due to higher interest expense (interest rates have increased) and depreciation (capacity has got added recently) and probably after 1 years would company start showing better results with ramp up in capacity utilization of there new capex… which would result in better operating margins…
Your endeavour to respond and spend time on each of the requests is commendable and your thought process of educating us with your knowledge is unconditional. I’ve been one of your long term admirers and a beneficiary.
Thanks for that @StageInvesting ! Wish I could meet you one day and thank you for that.
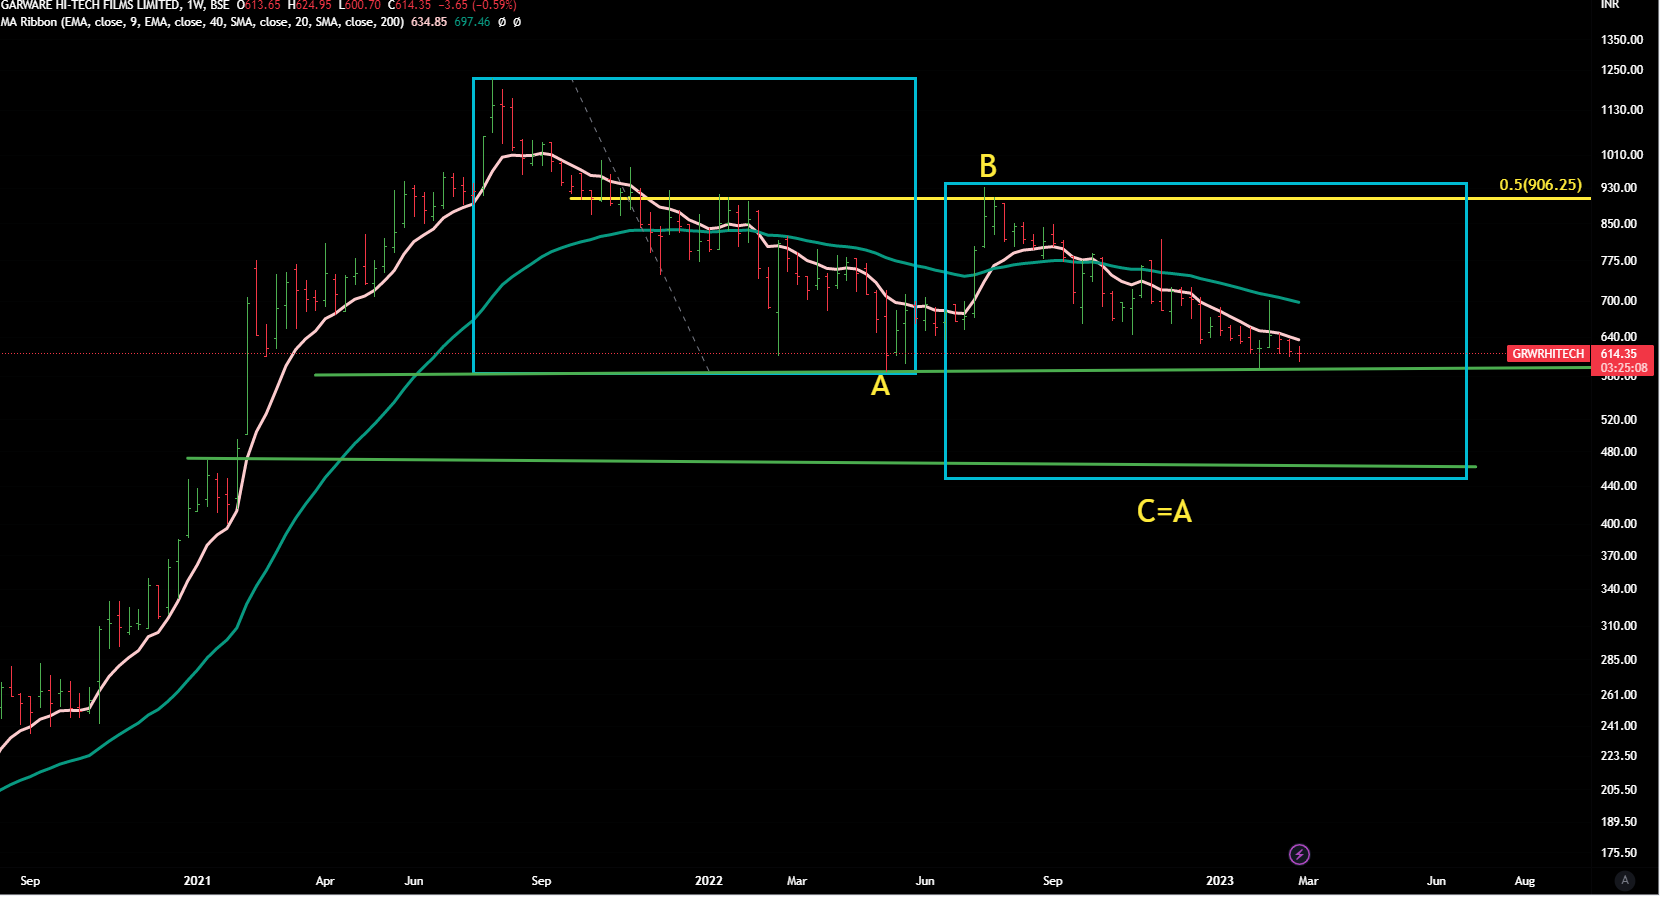
Garware Hitech
CMP 614
Well it is a clear Stage 4 stock-- lingering below 40 WEMA .
Be careful if it breaks 594 , the first green line. If then it breaks that , then there’s a risk that it can go to next green line of support where C=A.
Disclaimer - No position
This post is just an effort for learning few methods of price-patterns. Views are personal. No buy/sell recommendations. These are probability study methods and chances of success/failure depend upon various factors
Disclaimer - No position
This post is just an effort for learning few methods of price-patterns. Views are personal. No buy/sell recommendations. These are probability study methods and chances of success/failure depend upon various factors
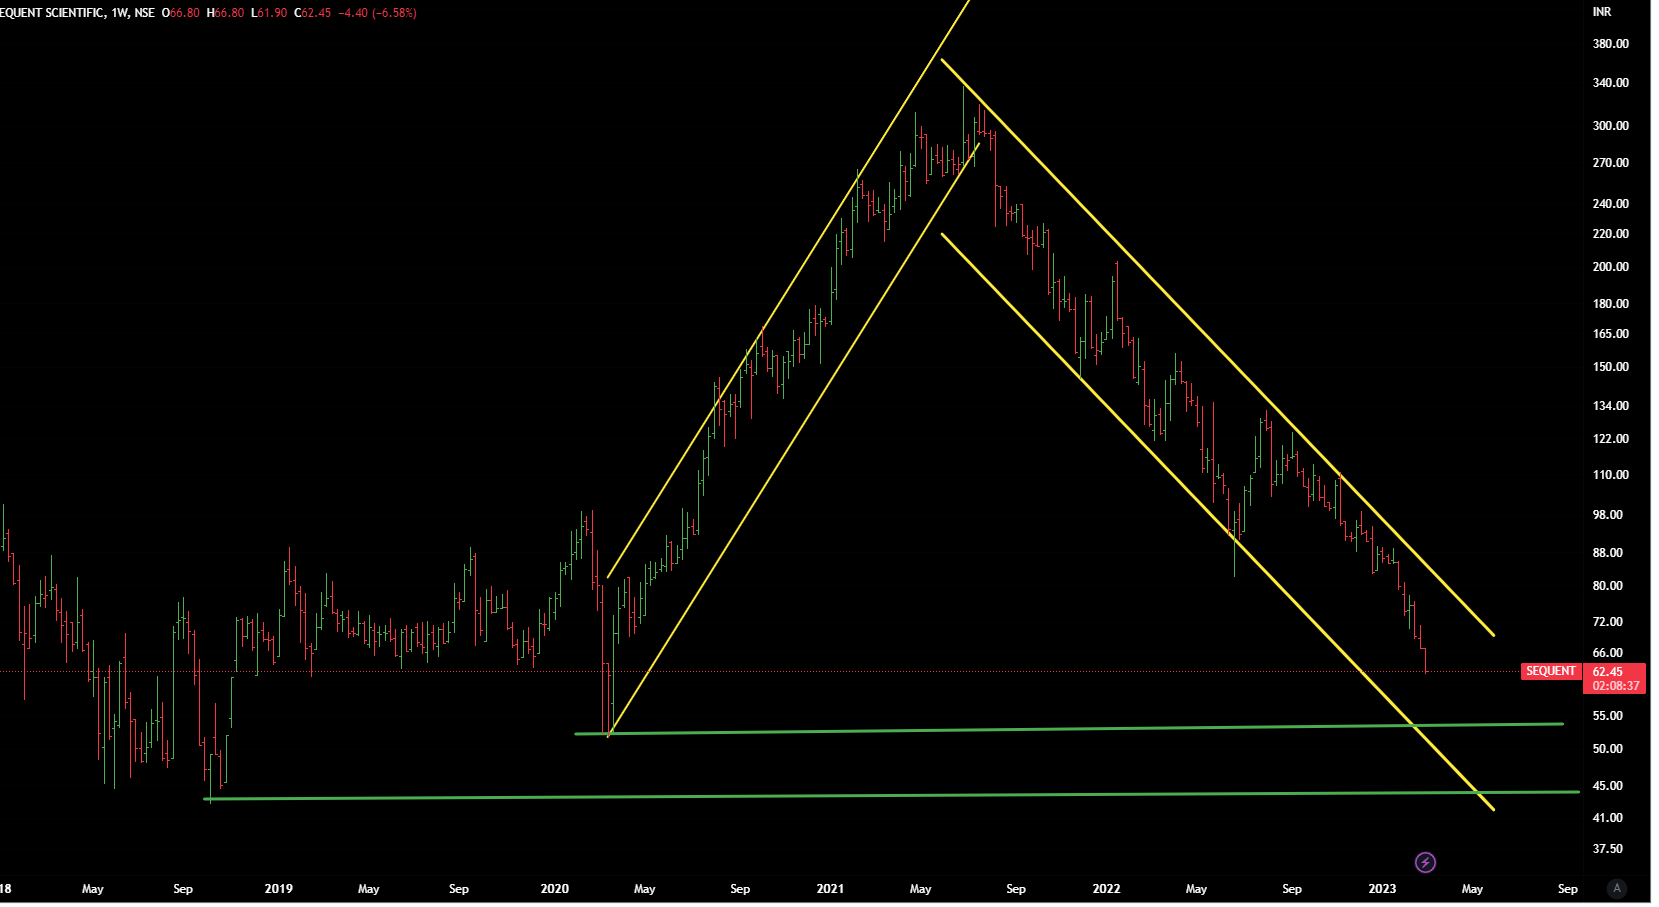
Thank you. Sequent I am watching for base formation and trend reversal.
From whatever I am reading based on fundamental analysis the company should have formed a base. But from the charts - some more pain is pending. So wait and watch.
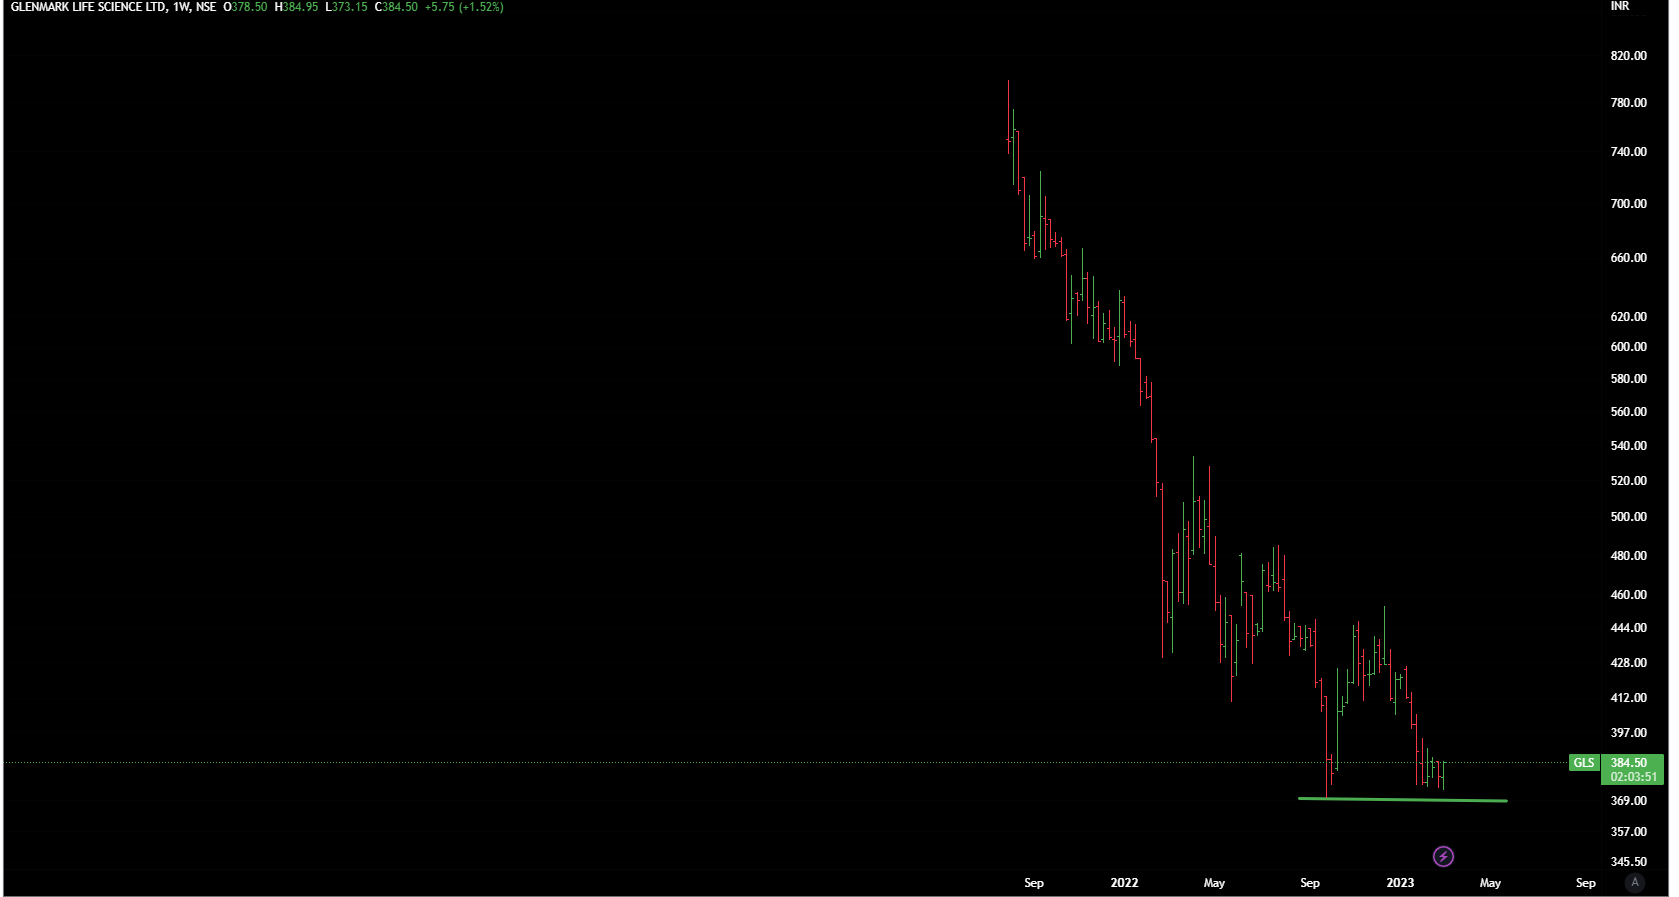
Glenmark Lifesciences also looking for a base formation and reversal. Fundamentally the story is good but charts are telling a different story.
MPS - is one more stock wanted to see your view. Feel its at a start of a big run.
We , at our end , call it Kabbadi (rag-picker) Investment approach.
A rag -picker tries to find some valueables from waste. And sometimes they get lucky , they happen to find some gold in the waste.
Our approach is to find value among quality companies, the beyond-doubt- good -companies trading at a discount, and we focus on momentum stocks ( rising sun, chadta suraj) .
Like said earlier, nothing wrong in any approach- one should do what suits one’s aptitude.
Disclaimer - Invested with small positions.
This post is just an effort for learning few methods of price-patterns. Views are personal. No buy/sell recommendations. These are probability study methods and chances of success/failure depend upon various factors