Hello Sir ,
Request your help in Understanding Wave scenario in Eicher MOTORS …Has it completed its C wave post Major 5th or It’s in 4th .
Hello Sir ,
Request your help in Understanding Wave scenario in Eicher MOTORS …Has it completed its C wave post Major 5th or It’s in 4th .
Well that’s the whole purpose of deleting a post ![]() so that readers don’t get a chance to view it !
so that readers don’t get a chance to view it !
Is not it ![]()
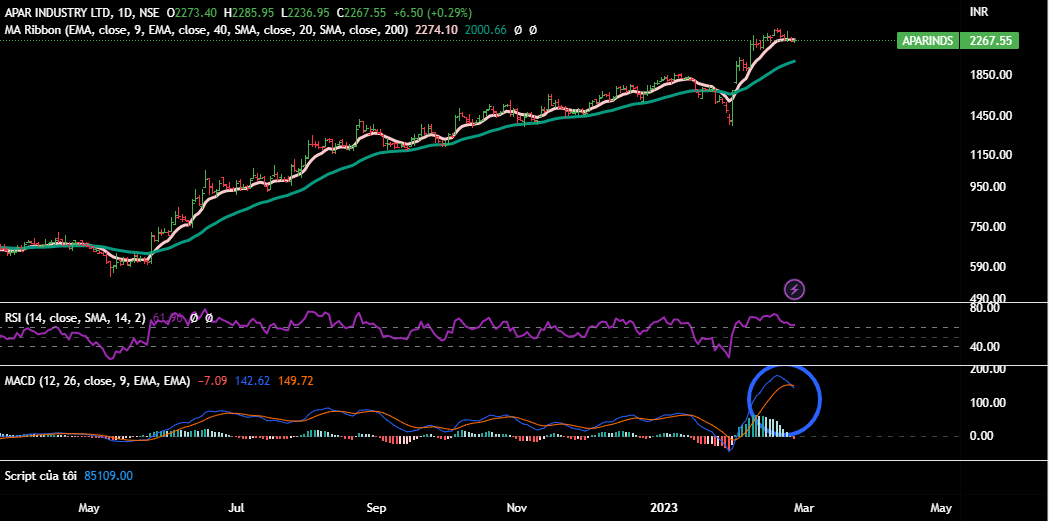
Apar or any stock
Entry Point Technique
Put on MACD indicator . Open the daily chart. If MACD is pretty extended and is turning towards sell -it is time to wait for entry …let it complete the full cycle - and give a buy signal ie blue line crossing the orannge lien from below.
Many a times , stocks complete the whole cycle i.e. the blue/red curves go bleow the zero line and turn up but in many cases ,one can get the buy signal much before that ie ble/red curves don’t touch or go below the zero line.It depends upon the strength in the stock or underlying market.
But be careful , in extreme bull markets , many stocks can keep rising and one can miss the significant upmove while waiting for the cycle to complete.
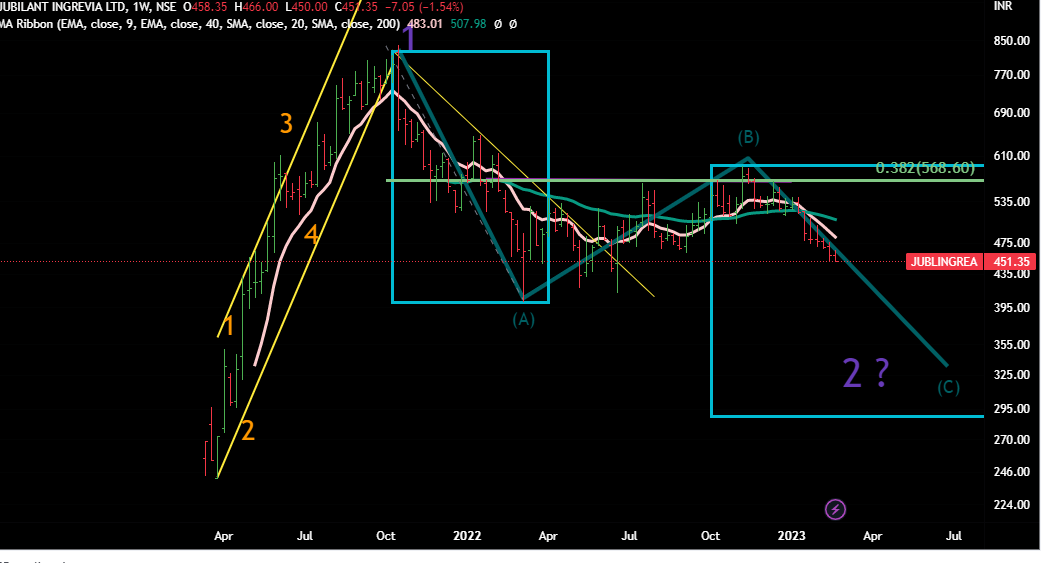
Jubilant Ingrevia
CMP 451
We covered it in October at the levels of 540… no change in the chart structure.
Yes now we know the structure of B, we can tentatively project the extent of C .
Weekly Chart
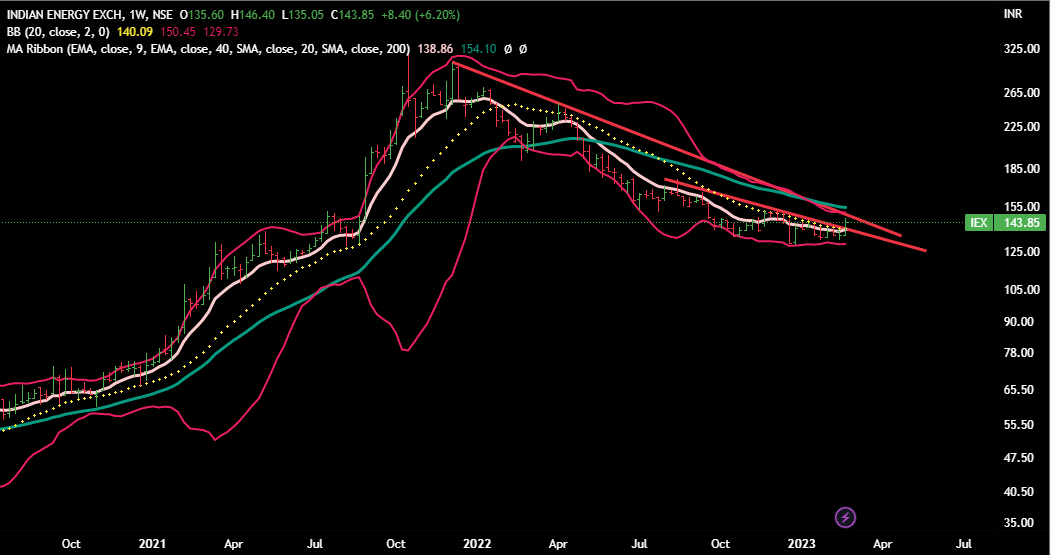
IEX
CMP 144
We just looked at it.
We keep the leaders of previous bull -run (euphoria) out of our watch-lists.
The ongoing small pull back is the result of RSI divergence only.
Ging ahead ,it has lot of overhead resistances - MA, BB and falling trend line.
Hence we would keep our hopes very low for any significant uptrend (unless it starts giving sustained closings above these resistance levels for few weeks and with volumes)
Weekly Chart
Well, we have not counted the wave structure.
But a quick look tells us that currently it is on weak grounds.Monthly MACD has turned into sell.
It is unable to cross 20 WEMA and is very close to 40 WEMA.
Overall, a position where one needs to be extra cautious.
Thank you sir for Views on Eicher MOTORS
Request if you can help with Views on Petronet Lng gujrat
Can you please put your views on Dlink?
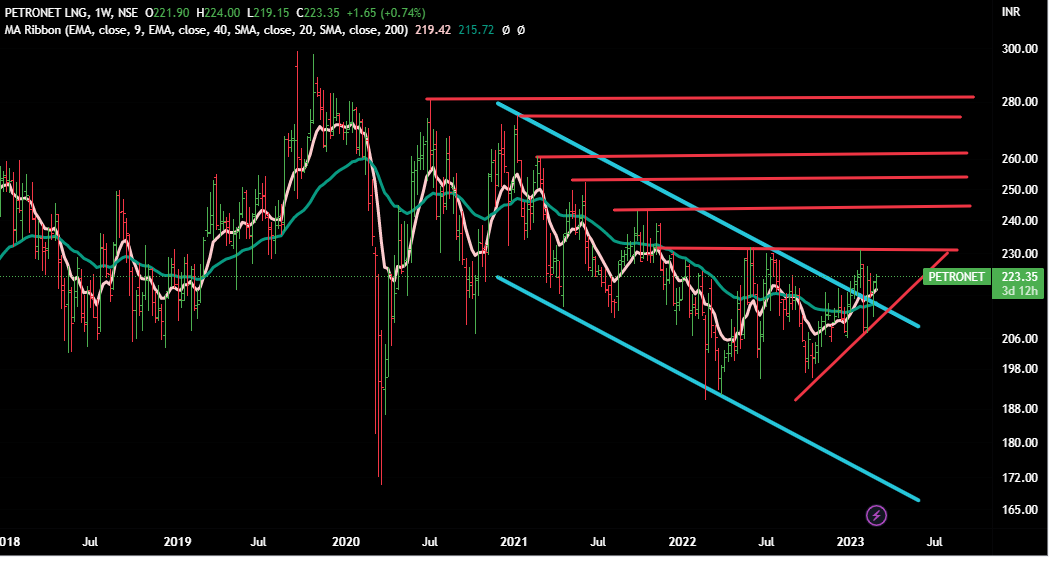
Petronet
CMP 223
This is one of those stocks that has not done anything for last few years despite having good fundamentals.
Has given lots of false starts in the past but most of the breakout fizzled out.Many a times past beahviour can help in understanding the future (exceptions are always there)
There are lot of overhead resistances as depicted by red -lines.
Still if one wants to try ( leaving aside many other good stocks) , one should add small-small postions as the price starts giving weekend closing above these red lines.But if the price again breaks those red lines on downside ,then one should exit.
Good thing here is that downside seems to be limited as the levels of 190 can prove good support- zone.
Weekly Chart
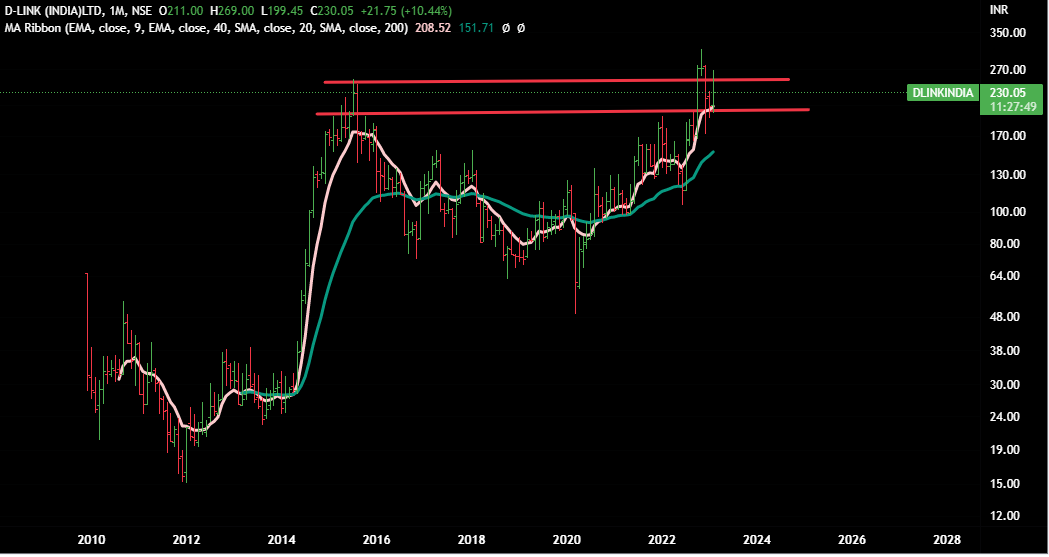
DLINK
CMP 230
In short term, 225 is important support -level.
If it breaks then , price may keep moving in the range of 190 and 250.
Till the time the price does not start giving weekly closes beyond these levels. we don’t expect any significant price movement in any direction.
Monthly Chart
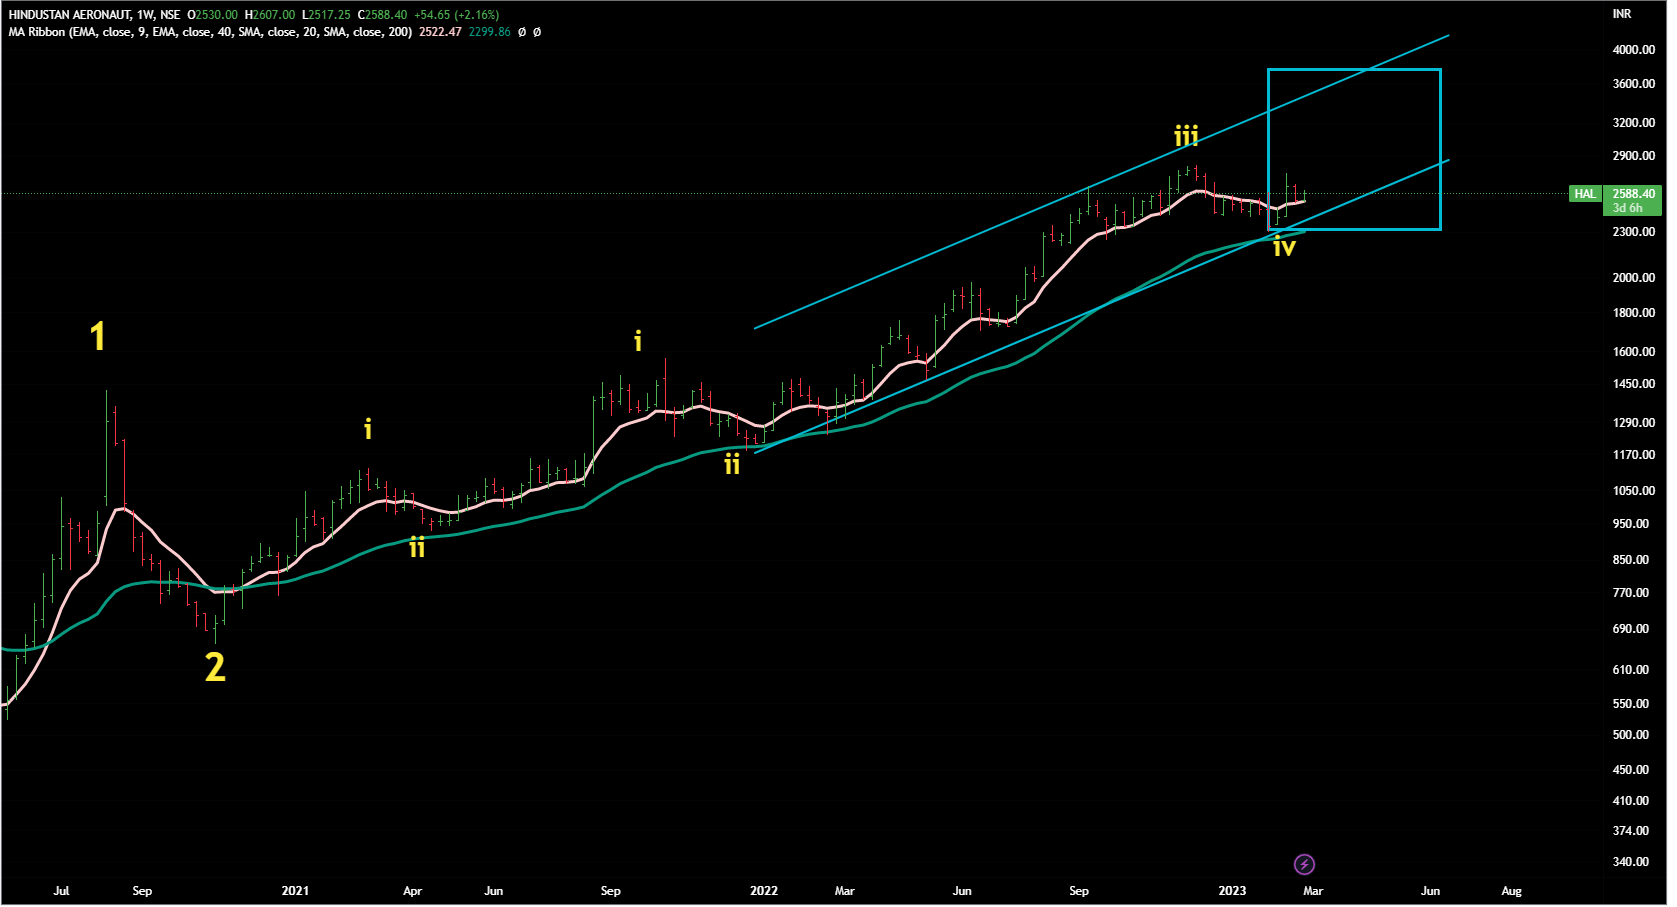
HAL
CMP 2586
Can this go to 3500 ? Or our wave -count is wrong !
Well , let’s track - very difficult to say in this choppy markets where nifty and many other indexes have broken important support levels.
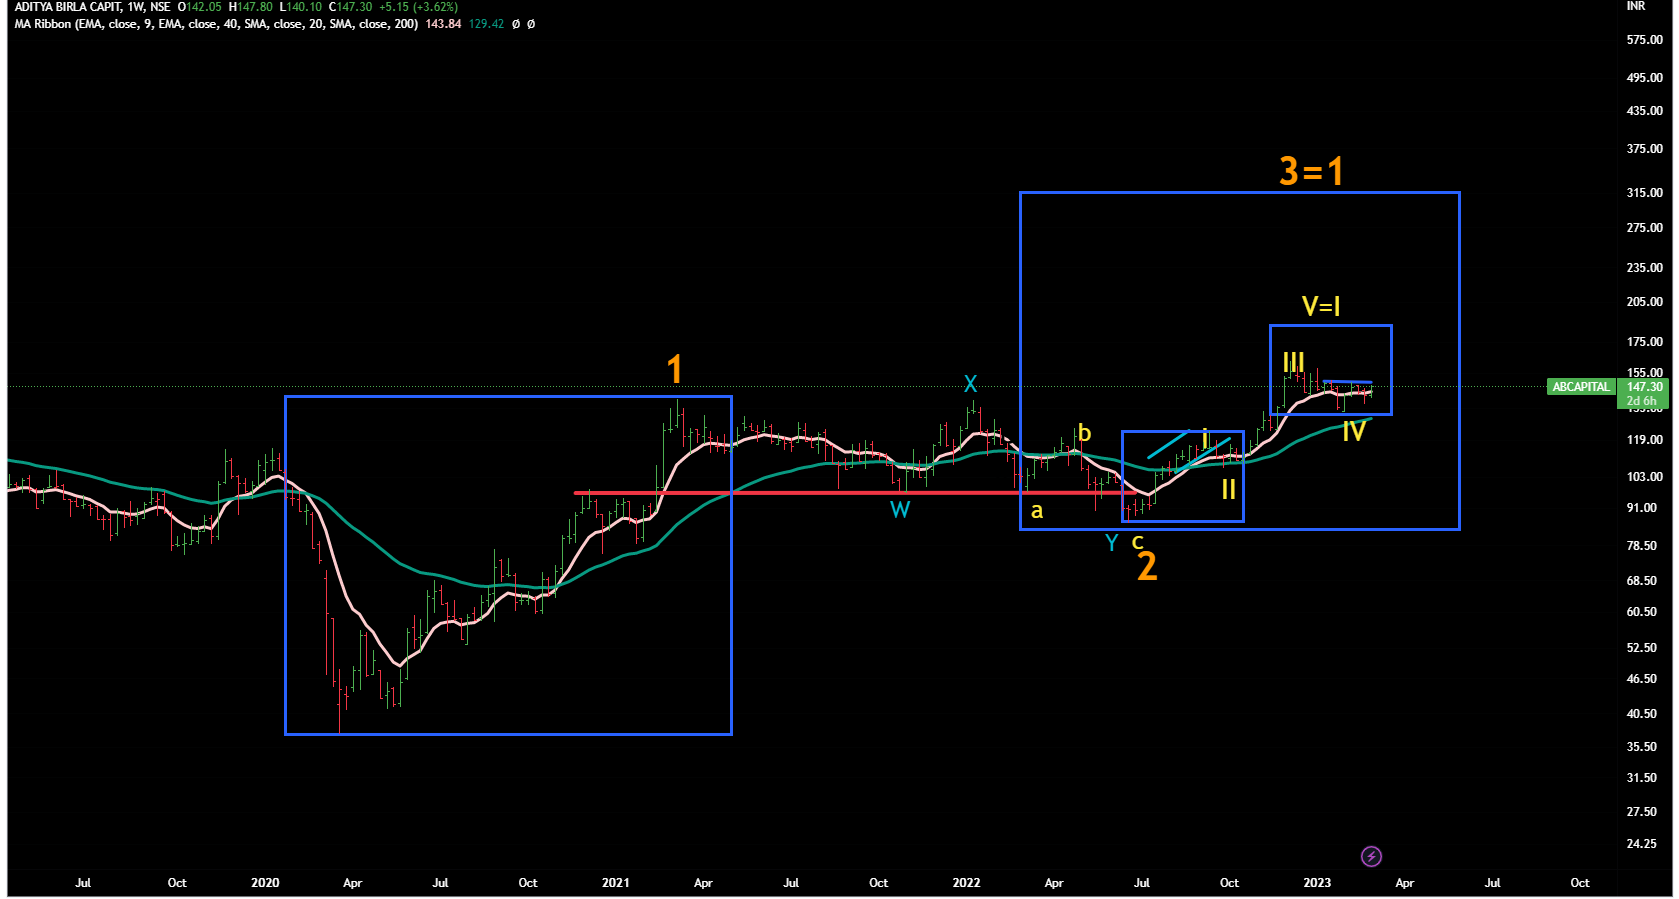
AB Capital
CMP 147
One of our core holdings.
Long Term Wave Chart
Keep in connsideration that no journey is without ups and downs.
This is weekly chart , the projection may take few months to years to play out.
Weekly Chart
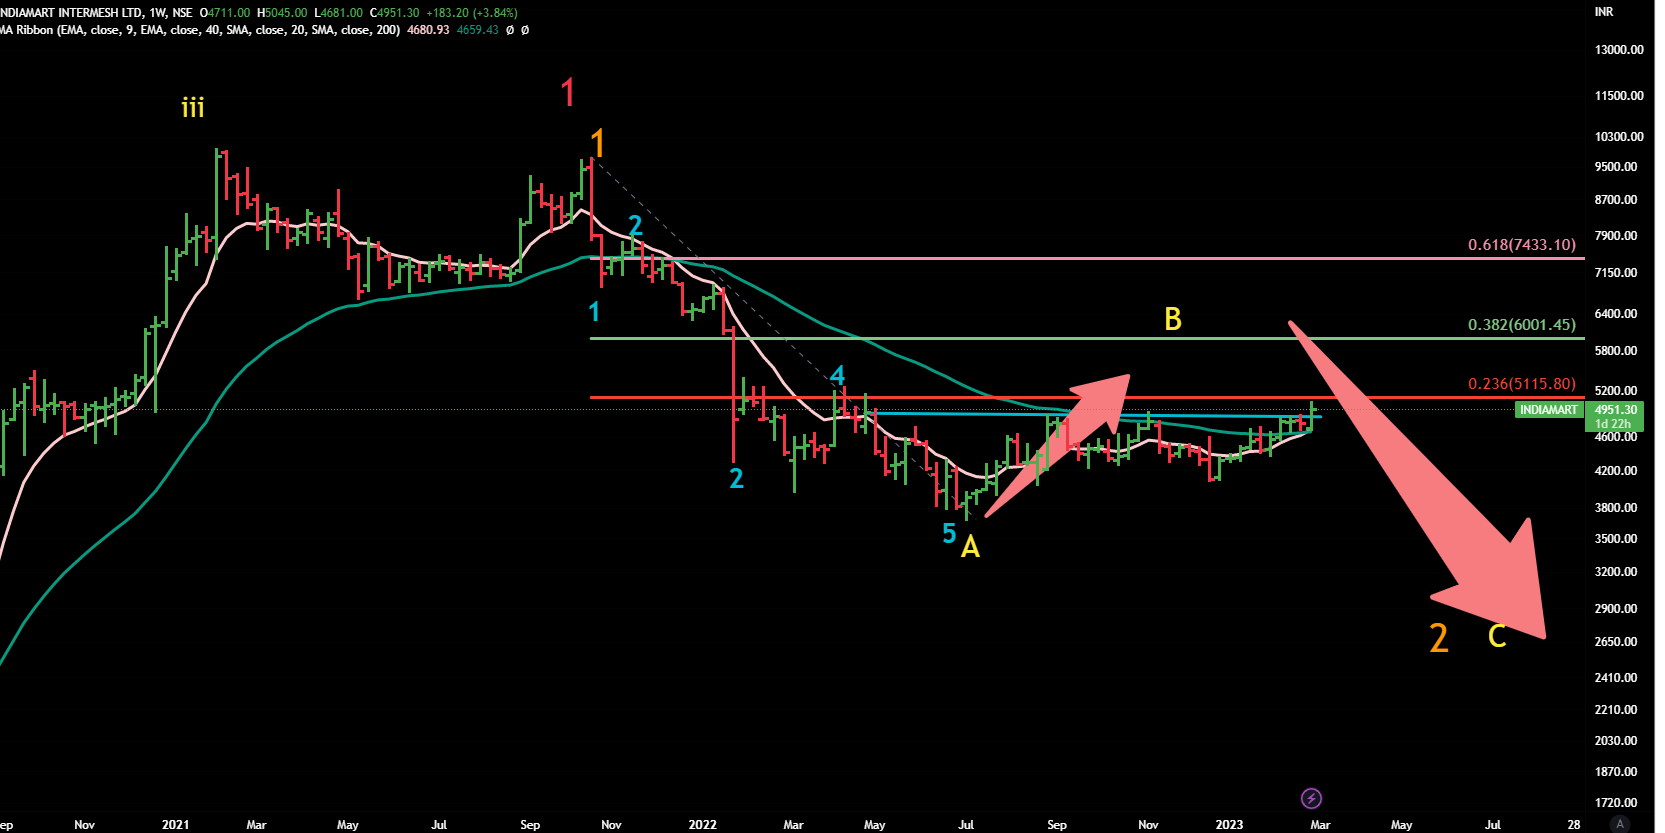
Hi @StageInvesting
You view on india mart. It looks very good to me
We somehow don’t like the company on fundamental basis (our views can be very wrong) .
Mental- bias can play badly on technical analysis, hence although we would be able to analyse the chart but it would also reflect our bias.
Here is the chart.
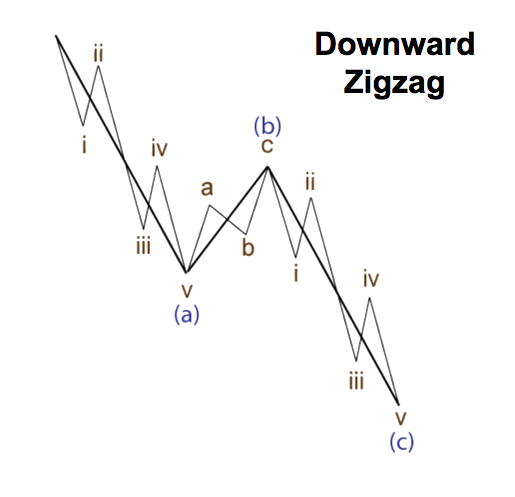
Seems we’re recovering wave B in a ZIg Zag correction.
Now B can do 23% or 38% or 61 % retracement of whole A .
Level of C would be known once B is over.
Weekly Chart
This is how a Zig Zag correction looks like.
Disclaimer -
This post is just a for learning few methods of price-patterns. Views are personal. No buy/sell recommendations. These are probability study methods and chances of success/failure depend upon various factors
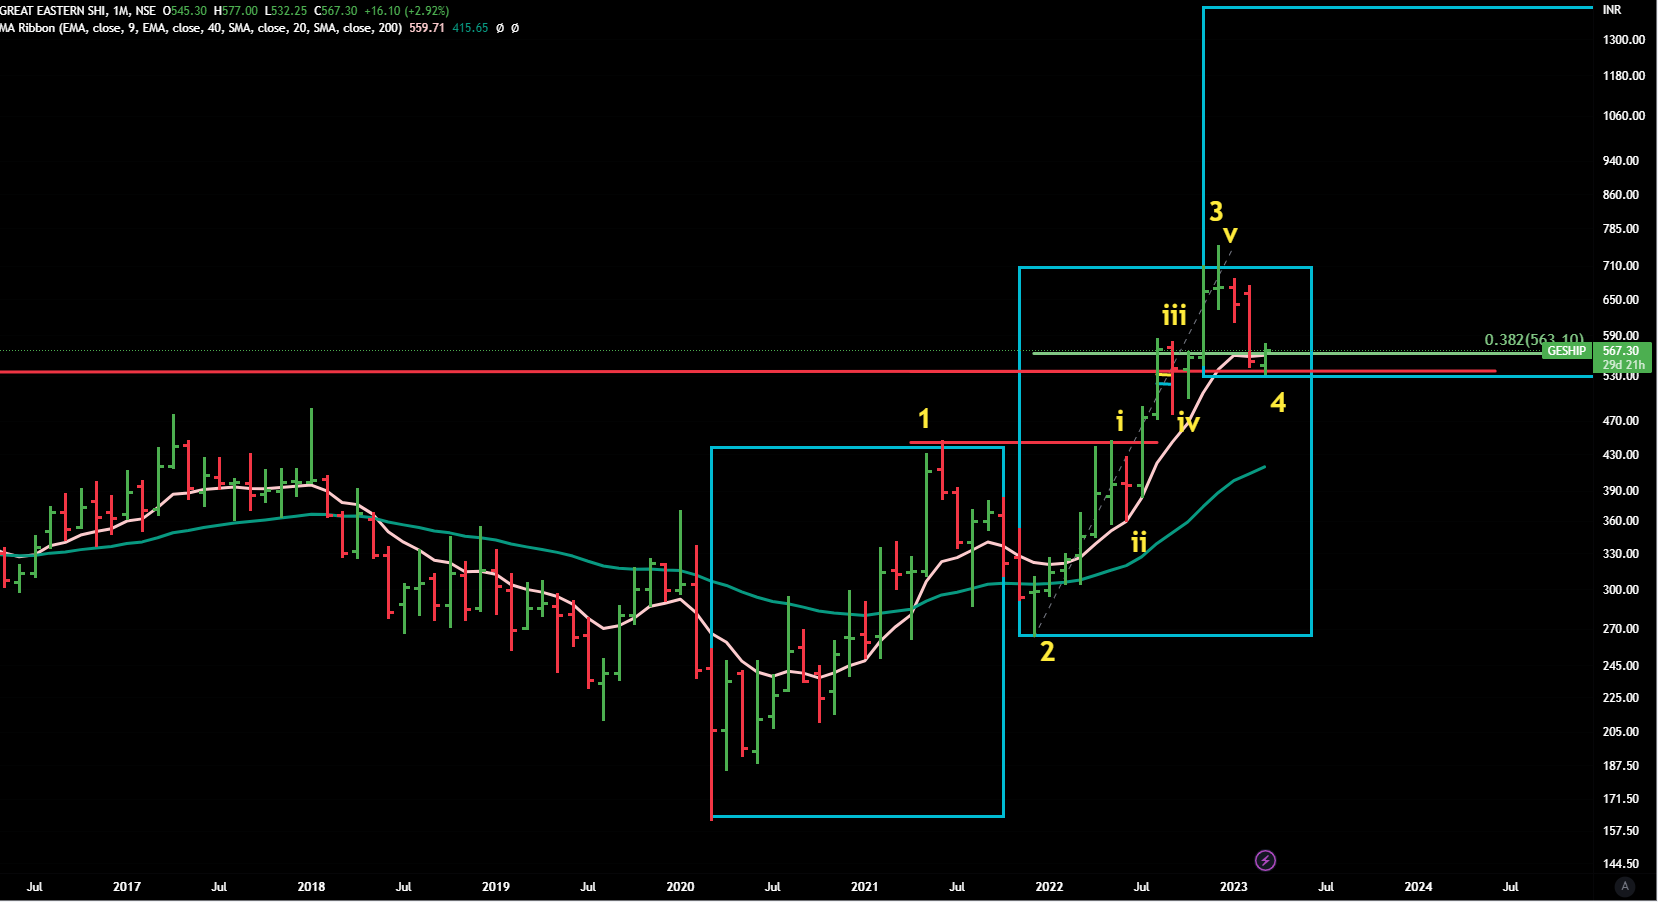
GE Shipping
CMP 567
Is the correction of wave 4 over ?
Today bounced back from an important support with >2 X average volume.
If yes, then next leg can take it to 1500 and beyond !
But need to very vigilant before becoming confident.
Need confirmations … should first start closing above 572 and then above 20 WEMA and MACD in different time -frames should start moving towards buy…currently all in sell.
Weekly Chart
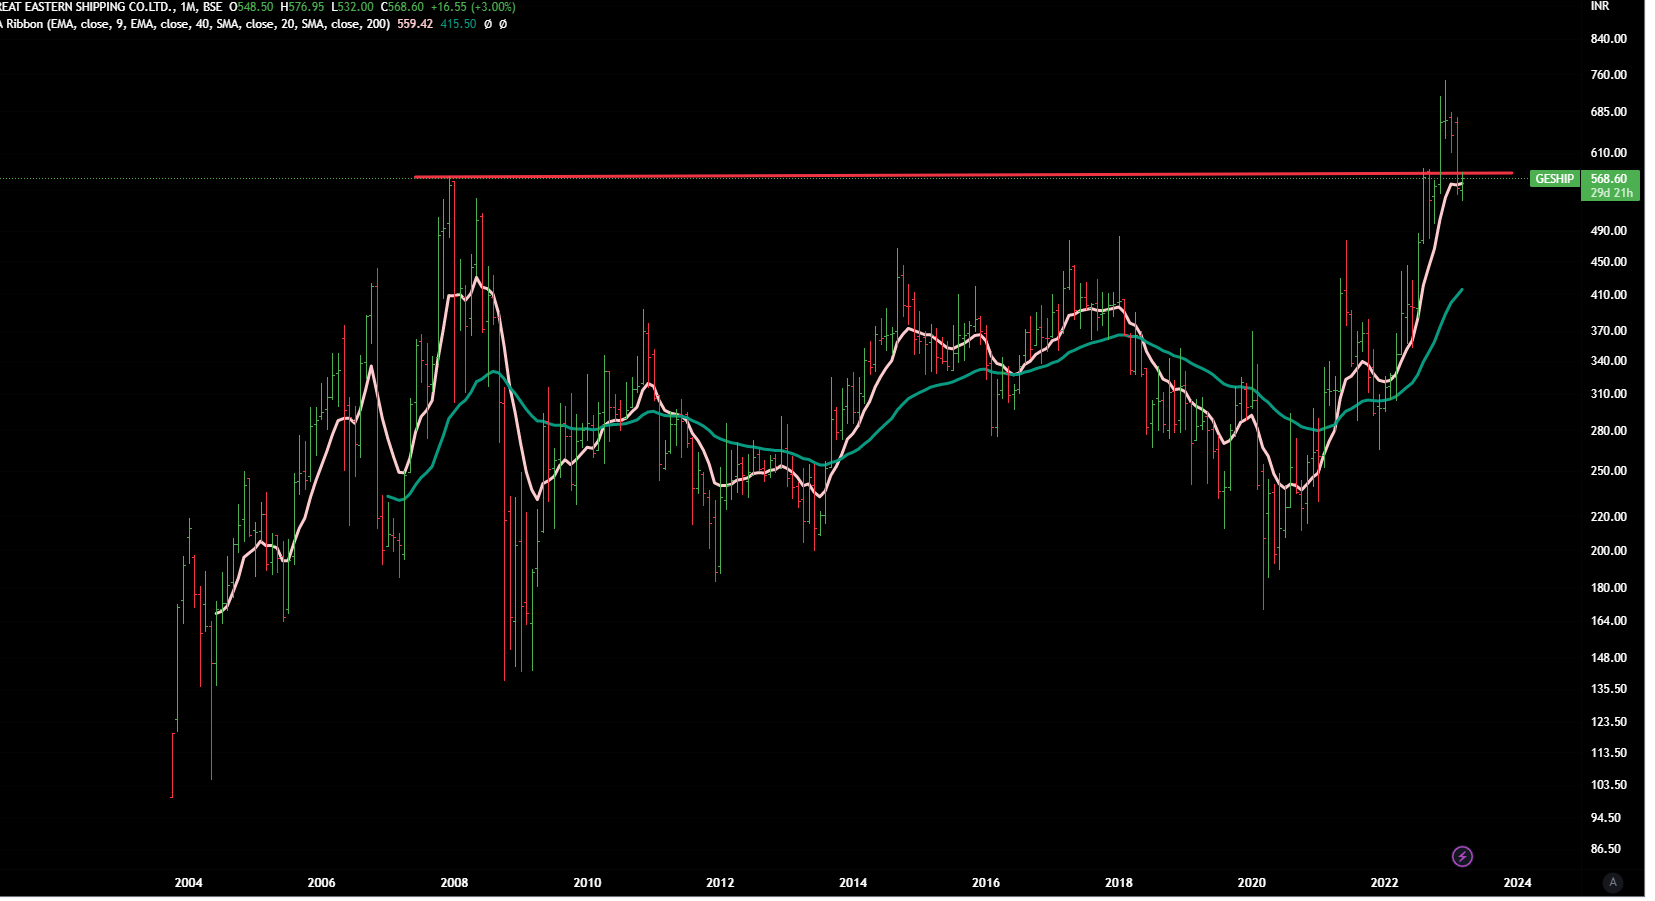
There was a muti year breakout in this stock after 15 years - that indicates a structural change in the sector.
Monthly Chart
Disclaimer - Have small position.
This post is just a for learning few methods of price-patterns. Views are personal. No buy/sell recommendations. These are probability study methods and chances of success/failure depend upon various factors
Hi sir,
Thanks for doing a wonderful job of educating us.
Your efforts are sincerely appreciated.
Can you throw some more light on EW which looks more tough.
Please take LAURUS LABS as an example and put your comments.
Best regards,
Laurus Lab
CMP 314
From Elliot waves prespective.
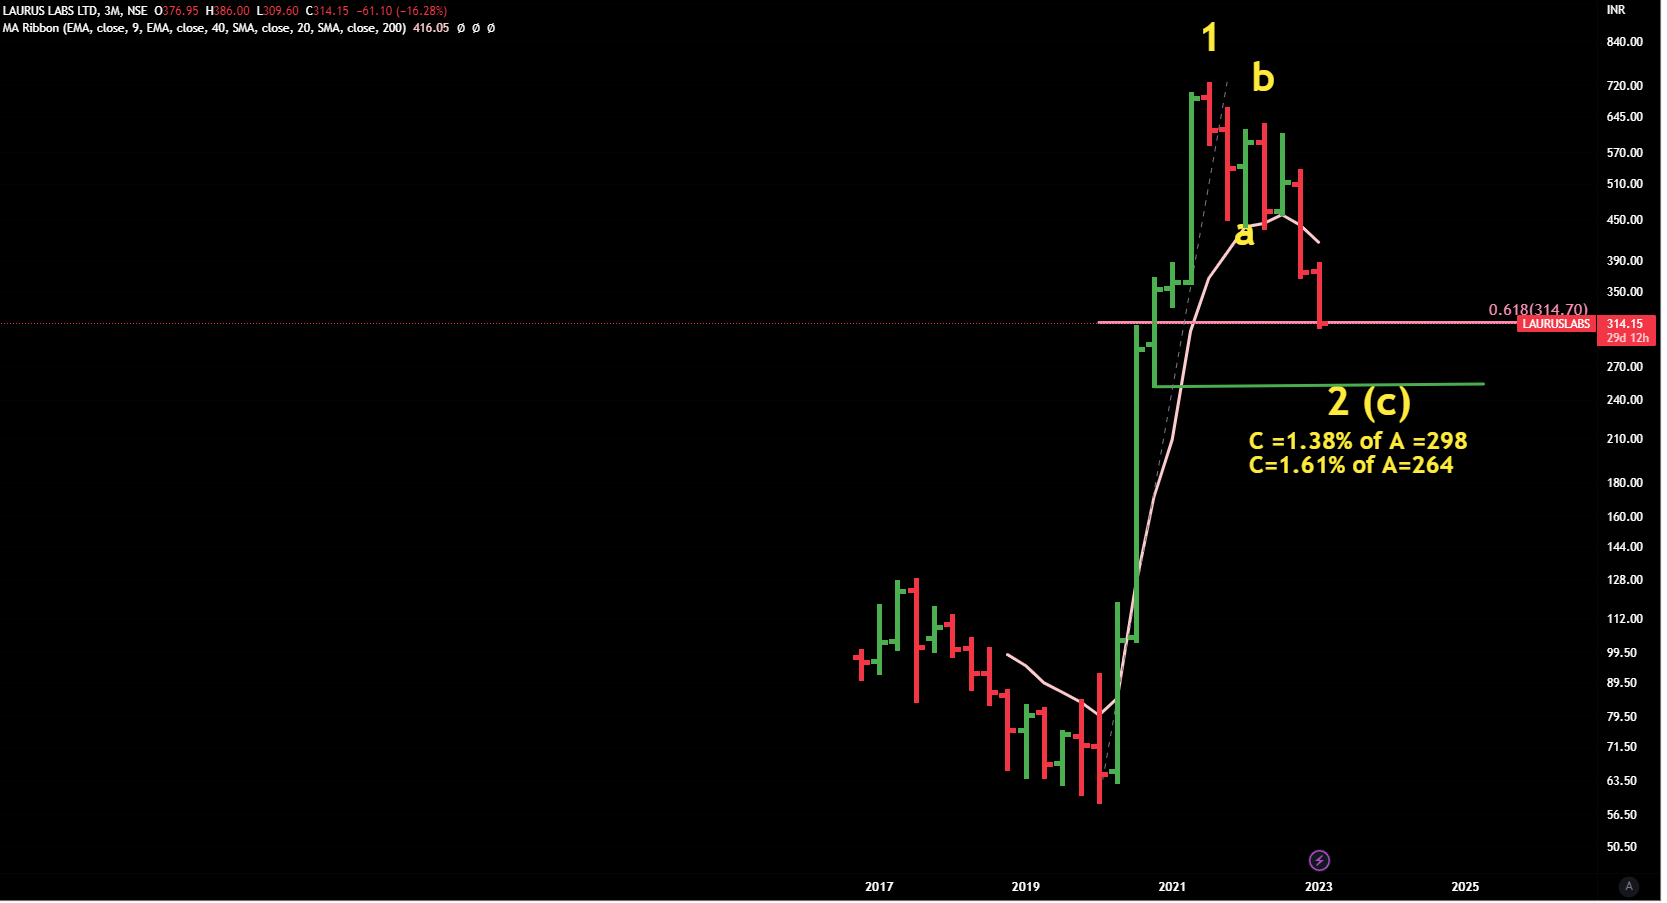
We start with quarterly chart to take a bird eye view (for long term).
It is clearly in C part of wave 2 and currently at an important support zone -61.8% of retracement of whole rise and a previous resistance level that has become support now.
It might hold and bounce from here, but we doubt that it might not be sustainable.
We would come to the reason of our doubt when we show the weekly chart.
Quarterly Chart
On monthly chart -Here we show the internal wave counts (fractals of wave 1)
MACD has completed its cycle , it is below zero line but yet to show the signs of getting a long time reversal.
Monthly Chart
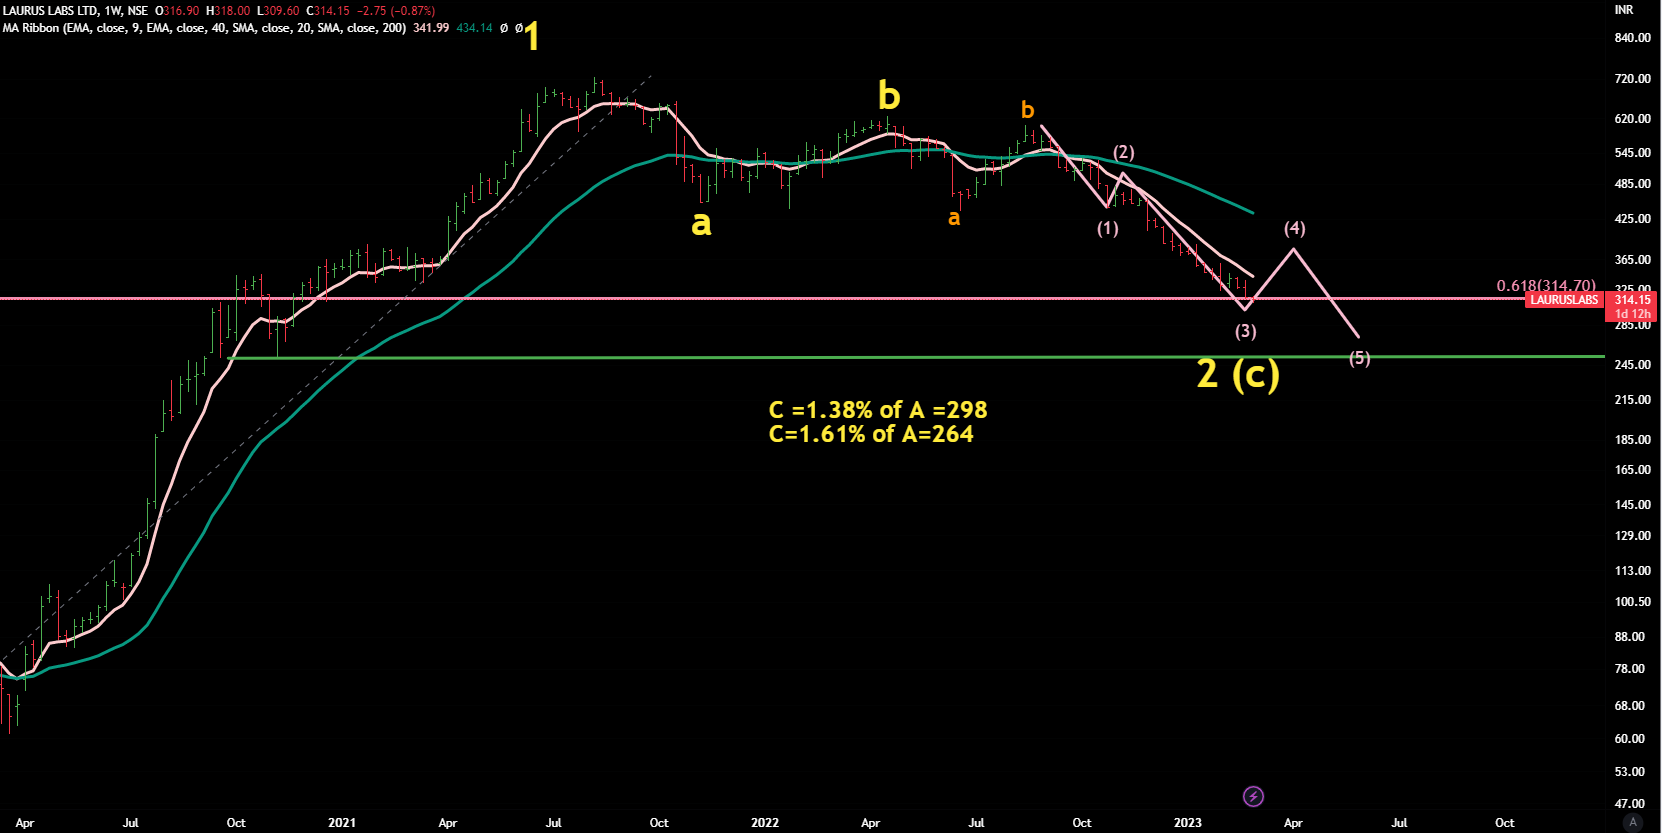
On weekly chart, we have tried to check the internals of this correction.
It seems that we are in last leg of correction - that is last C .
The worry here is that it is falling in 5 waves straructure. Till the time ,these are not completed , we might not be out of woods.
Currently we’re in correctiv- wave 3 of the fall. We might see a bounce back (retracement) in corrective -wave 4.
And then another dip in corrective-wave 5 and then the correction should be complete.
Now where this corrective- wave 5 would end ? That would depend on the extent of retracement in corrective-wave 4 ie level where wave 4 ends.
Though we can make a rough guess - we have next strong support at 250-260 and that also matches 161.8% of wave A .And it also coincides the level of wave iv of whole rise (wave 1) , many a times wave 2 corrections end there.
These are all probabilitic projections. Need to keep a close watch.
Weekly Chart
Just a note for the people who’re interested
Choose the time-frame of charts by keeping the following in mind.
Daily/Hourly Charts - for intraday trading -for people who want to become rich overnight but they end up becoming poorer after a short streak of small wins ![]()
Too much effort , tiny returns.
Too many decisions too take, number of mistakes tend to be high,feeling of greed/fear on hourly basis, can end in having high blood pressure.Need lots of risk-management techniques.
Most of them fail in earning from their own trading and few end up in selling technical-training programs offering quick-rich-programs to others.
Weekly/Daily Charts- for swing/positional trading for one to three months (for people who are there for quick bucks ).
Medium level of efforts, medium returns.Risk management is key here.
Monthly/Weekly charts - for 3-5 years investors - for the people who want to become rich slowly (but surely).
Least amount of efforts with maximum returns - maximum time goes in understandig fundamentals and reading.
Least number of decisions, can sleep well.Risk management is neccessary but less critical as decisions are made after deep-research.
Disclaimer- Excpetions are always there but those are rare.
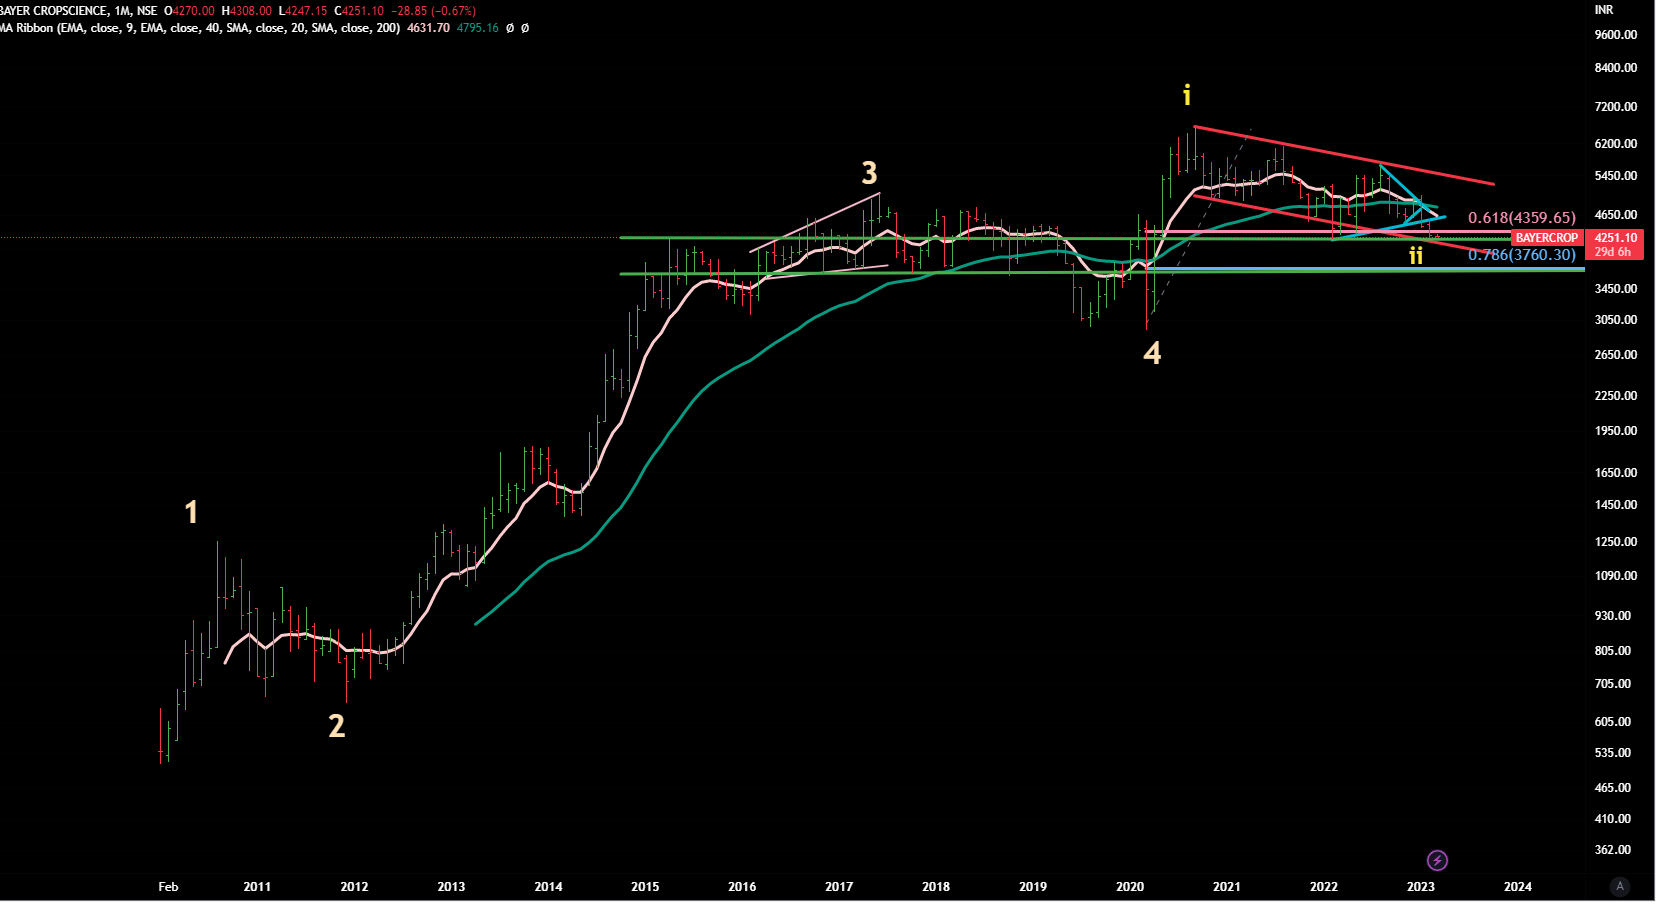
Hi, could you look at Bayer crop science. It has been in a downtrend for quite sometime.
Bayer Crop
CMP - 4250
Sometime we wonder about these kind of questions from investors !
This is a compounder type of stock —these kind of stocks move for a certain period and then gets into correction mode- it is quite usual.
One should ask a question to himself :Why it should move now ?
a) Is it undervalued ?
b) Is it a bull market when every Tom ,Dick and Harry goes up ?
c) Is it giving some extra-ordinary and surprising results ?
d) Is it going to disrupt any sector ?
If the answers to above question is ‘no’ ,then one should not expect any fast upside movement .
On weekly chart, it is in Stage 4 and it is currently at an important support zone (green line). If this breaks, then it may test lower green line ( next support level)
Till it does not move above 40 WEMA, we don’t expect any upside.
Weekly Chart