
So what would the 30 WMA be?
30 WMA ? It is 30 Week Moving Average .
If you are asking for NGL Fine -it is currently at 2330 ( but it keeps changing as per the price movements)
As of now, worry about that it can go down near 1700.
Dixon also appears to be on the cusp of a similar H&S breakdown. What do you think?
2 Likes
Yup, seems like H & S.
Have a look at the above post and have a look at the following chart of EW theory
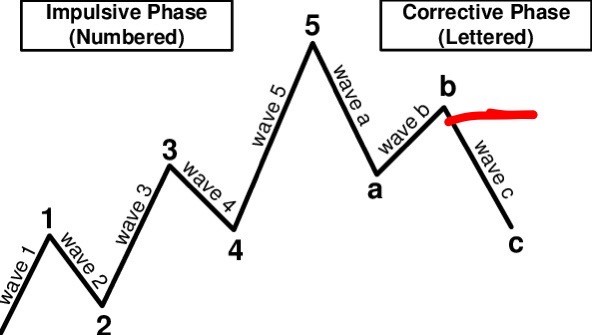
We are somewhere near red line. Long way to go down.
This C wave is developing 5 legs (overall ABC correction, 5-3- 5 zig zag -A had 5 legs , B had 3 legs and now we are in C ) . Currently we are in 3rd leg of the C then 4th leg counter- bounce and then down again in 5th leg.
But it wont be a straight fall .Next stops can be at 16150 - 15400 . But if it does not stop there ,then all hell would break loose.
Be careful guys.We are in Satge 4 as per Satge Analysis, Try to avoid bottom-fishing till we dont form a base in Stage 1.
6 Likes
Be Careful
For Long Term Investors.
Be careful - if someone is asking to keep SIPPing - be careful .
That is an average person approach - save your money as of now and put in bulk when we see a clear uptrend in the markets ![]()
Understand Stage Analysis from following picture.
- It is so simple that even an illiterate can understand it
 *
*
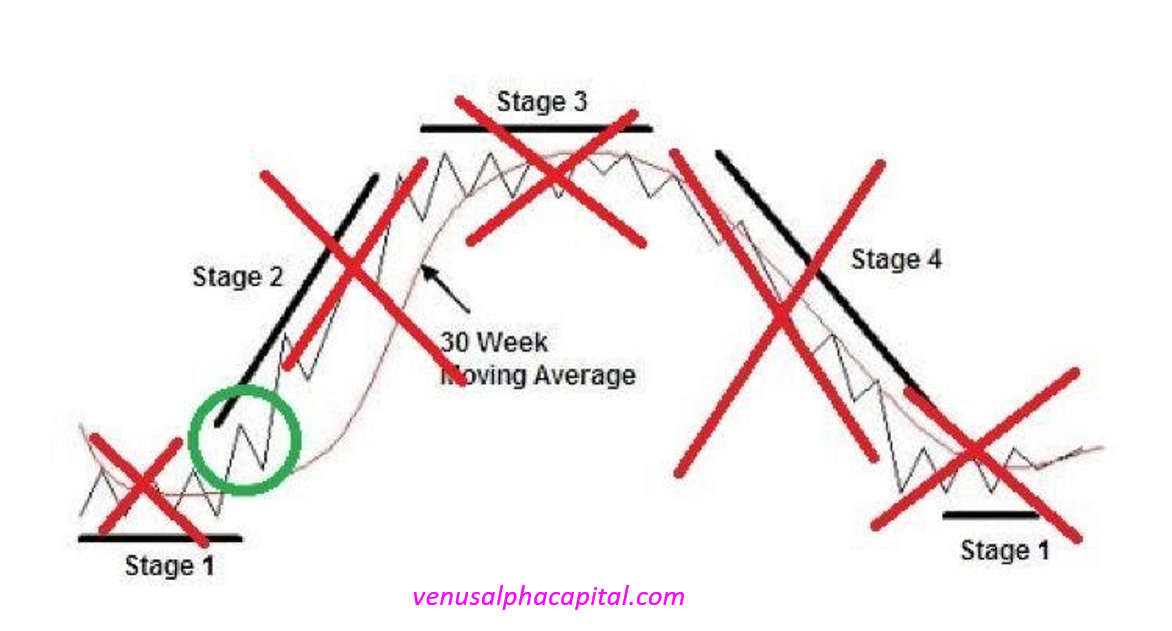
Enter only when Stage 2 breakout happens - whether in Nifty/Index or in any stock - currently either we are in Stage 4 or we are entering Stage 4 in most of the stocks
Fundamentals matter , but liquidity also matters. Most of the Stage 2 breakout happen when instititutional investors enter a stock + there is enough liquidity .
And only then the momentum begins .
6 Likes
Nasdaq -Tech Stocks
Would the bubble finally bust ?
And the impact on Indian IT stocks.
For very long term investing, 40 months moving average is a good way to track.
Analysed Nasdaq and Amazon from this prespective.
Both at a critical stage
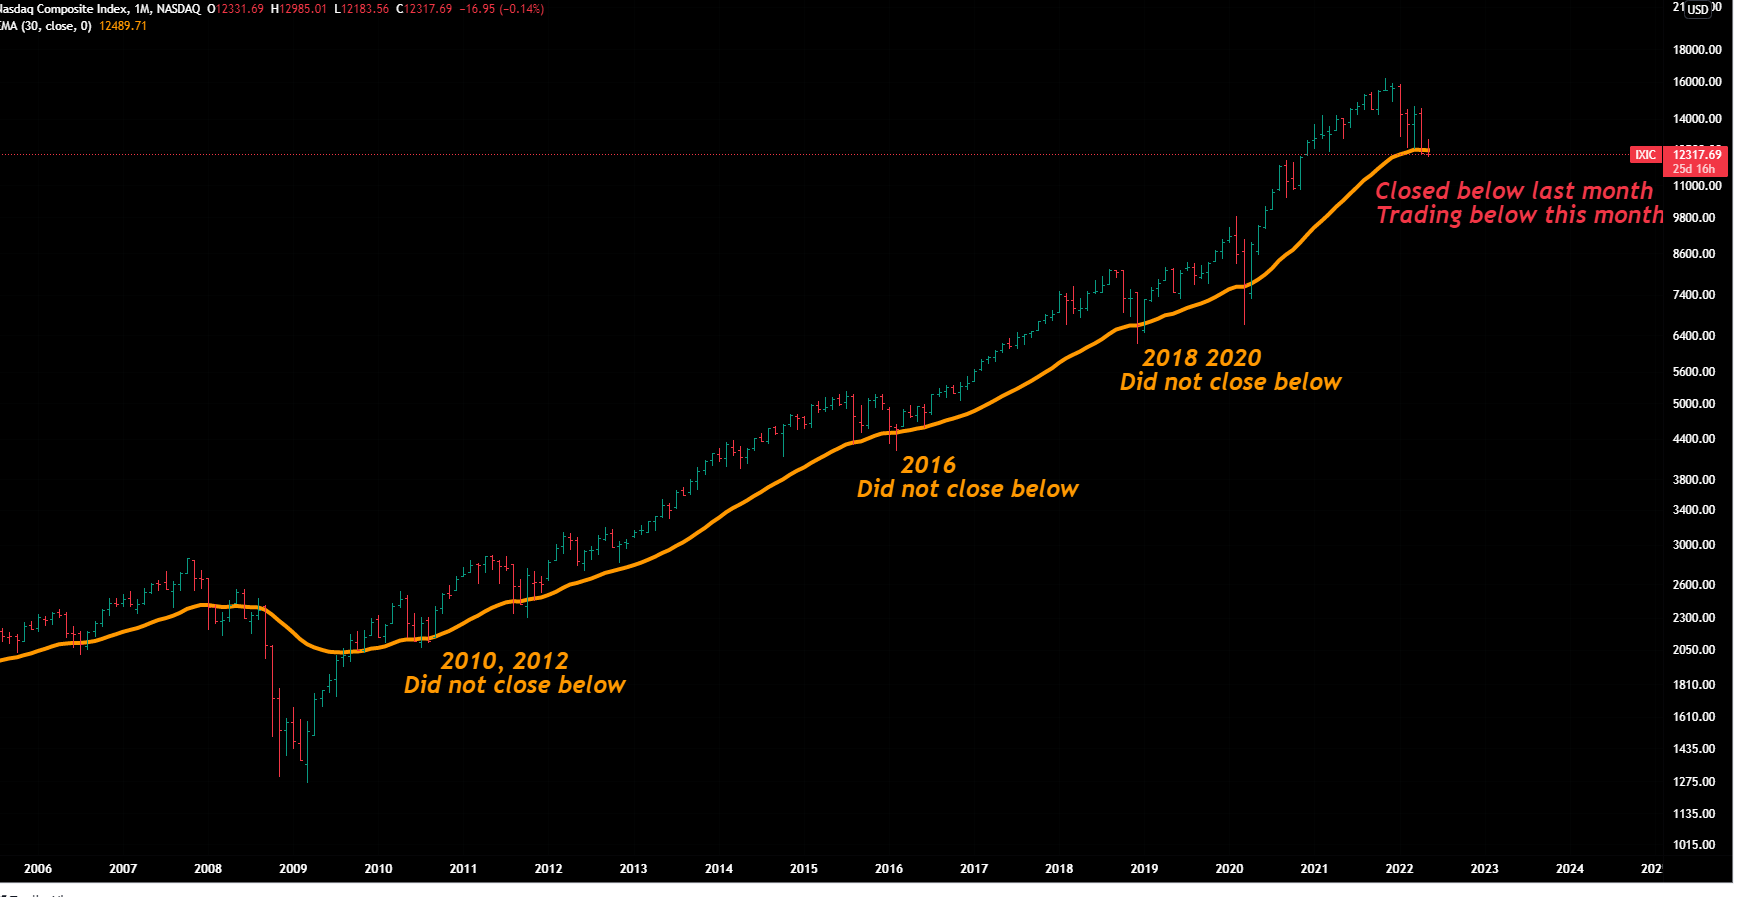
After 13 years (from 2009), first time ,Nasdaq closed below 40 months moving average last month and now in this month,it is trading below it … not a very good sign.
Similarly Amazon broke its 40 months moving average after 13 years.
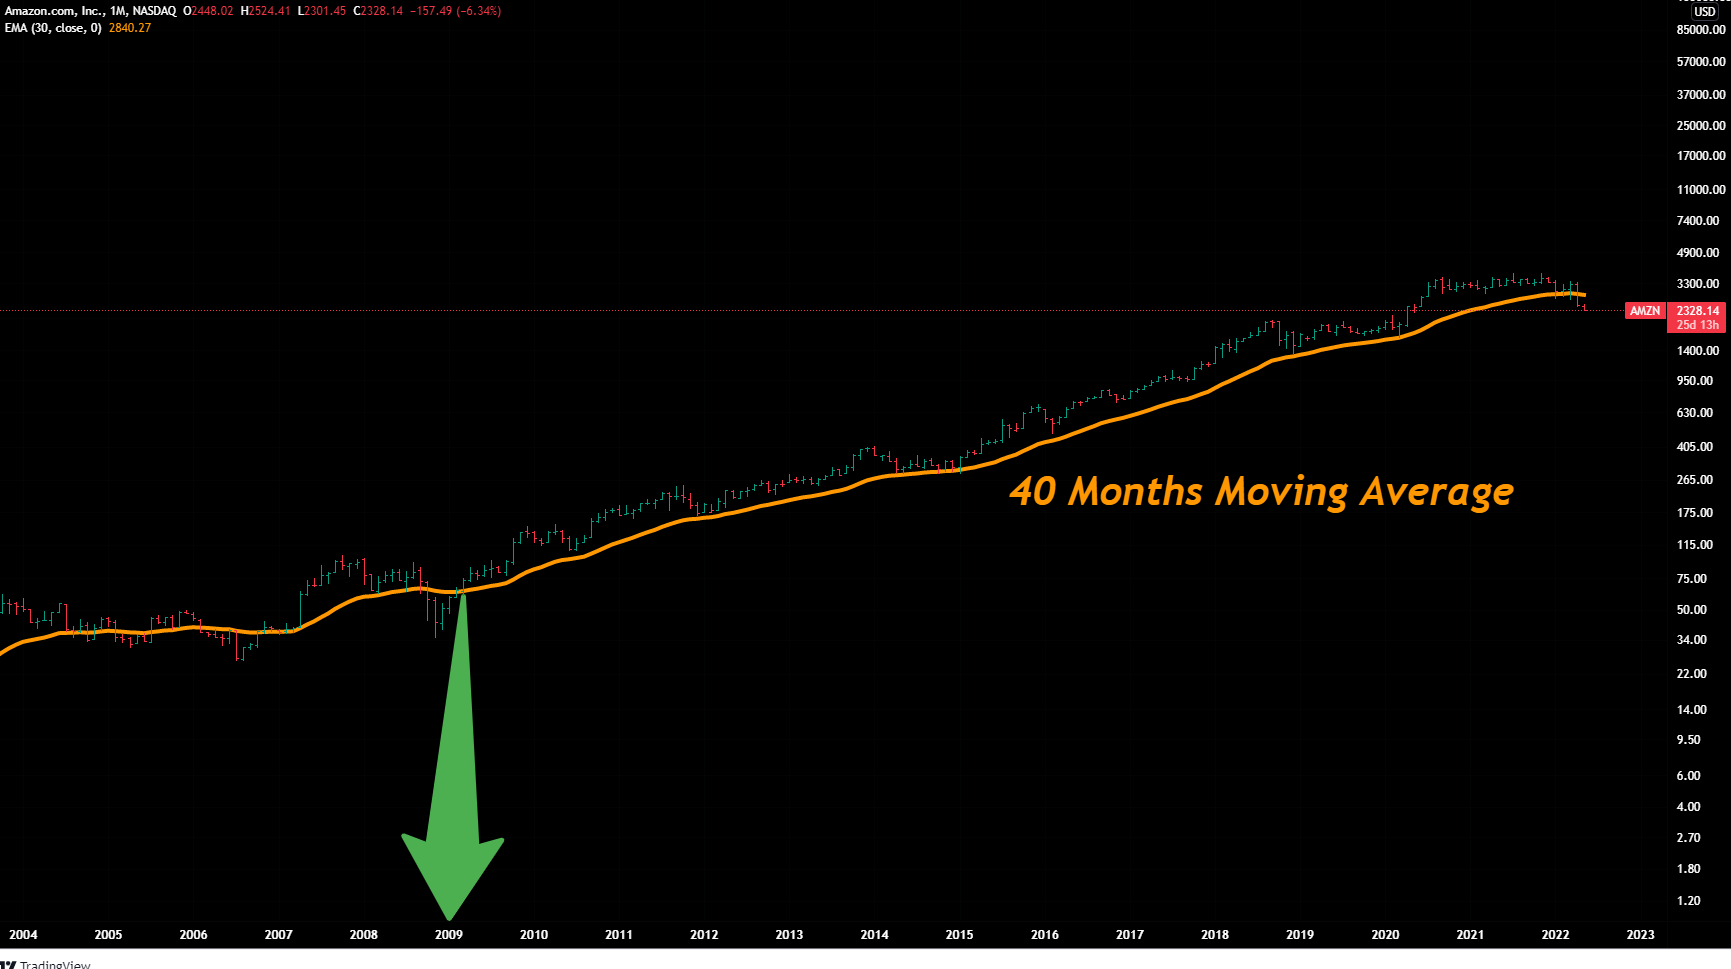
Time to be cautious …as if they crack further we might see more downside in Indian IT stocks also
Disclaimer: These charts are for learning and understanding purpose …no investment decision should be taken without consulting your financial advisor.
5 Likes
पैसा है तो Valuation है
If the liquidity is sucked out, there are no logic for higher valuations.
I have printed the folloing picture in my brain. ![]()

5 Likes
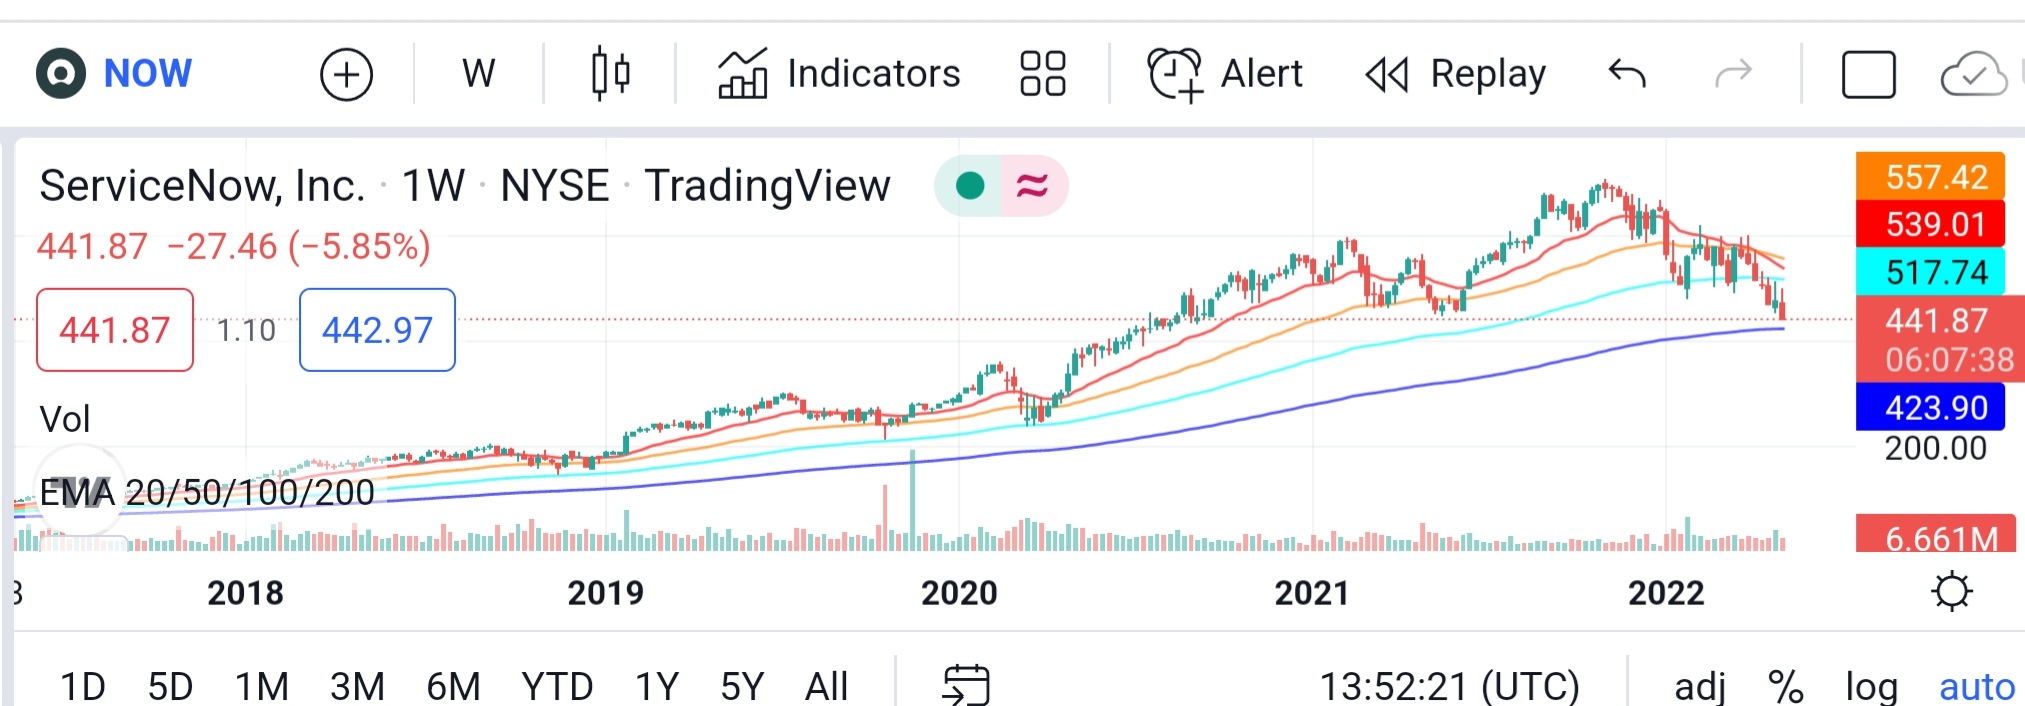
Namaste, first of all thank you for sharing your observations with valuepickr Community. May I request you to take a look at ServiceNow stock, part of Nasdaq index and advise if it is good for accumulation at current levels for long term or should we wait for it to take support at 200D EMA. A look at 5 year chart with 50,100 and 200 day EMA shows it always bounced when it broke 50 day or nearing 100 day. 200D EMA is placed at 423 and current price is very near to it. Fundamentally its one of the leaders in Cloud workflows software and the go to product for many organisations on their digital transformation path.
@StageInvesting, interesting take on overall market and IT stocks in particular… it’s so fascinating what charts can reveal… and I’m totally uninitiated into this… wondering if this method can be applied on small cap stocks too like Acrysil or Borosil…
1 Like
Yes, chart reading is fascinating field.But sadly few people think that it is only for traders.
But yes it requires 2 things :
a) Enough history ( at least 2-3 years of listing )
b) Mass participation thus liquidity
Most of the patterns are made due to movement in price and volumes. Volumes show the interest of people at large and price tells what value people are ready to give.
Mass (human ) psychology has remained same for thousands of years, so their behaviour also gets repeated in every facet of life. Chart (pattern) reading is thus a study of human psychology and their action thereof.
Now to your stocks :.
Acrysil
Although we have only abpout one year chart history, have tried to do some basic analysis.
It seems to be in Stage 4 ( has broken 30 WMA -orange line ) and Wave 2 ( ABC correction).
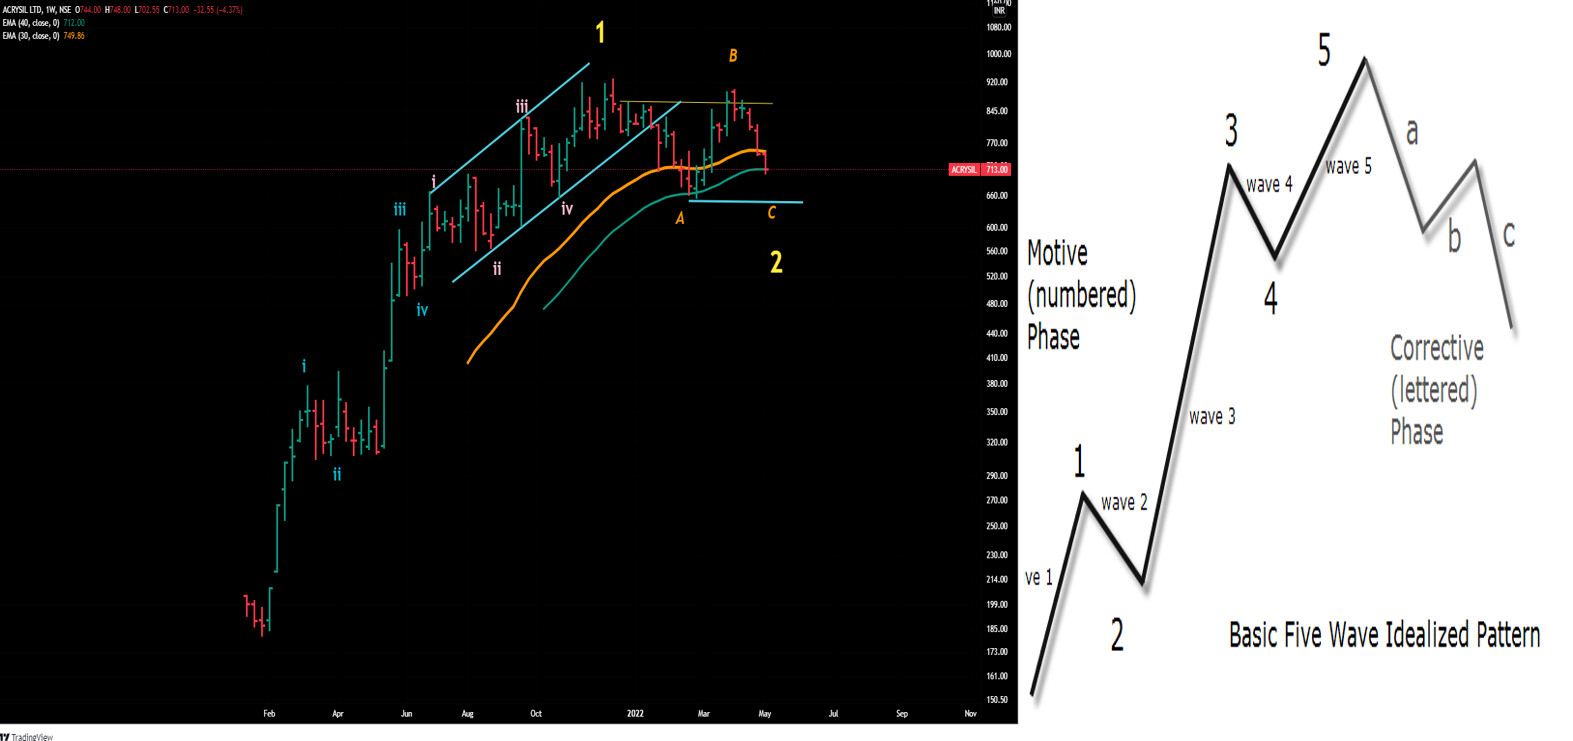
Now it has taken support at 40 Week Moving Average ( green line)
Thing to watch in strong stocks is whether they break 40 weeks moving average …many a times strong stocks tend to bounce back or keep floating near 40 week moving average till the time market sentiments remain weak.
But if it breaks this level , there is a chance that it would complete C wave . C wave happens to be equal to wave A (probability 1) .If that happens , then we will reach near 657 and that is also the level of previous swing low.
So weed to watch out in next few weeks whther it closes below 40 weeks average , if yes then we migh reach the above mentioned levels.
Can it go further down ? Yes , if it breaks that level , next support would be near 602.
Borosil Renewables
If you are holding it and wanna exit then i think it is too late to ask the question.
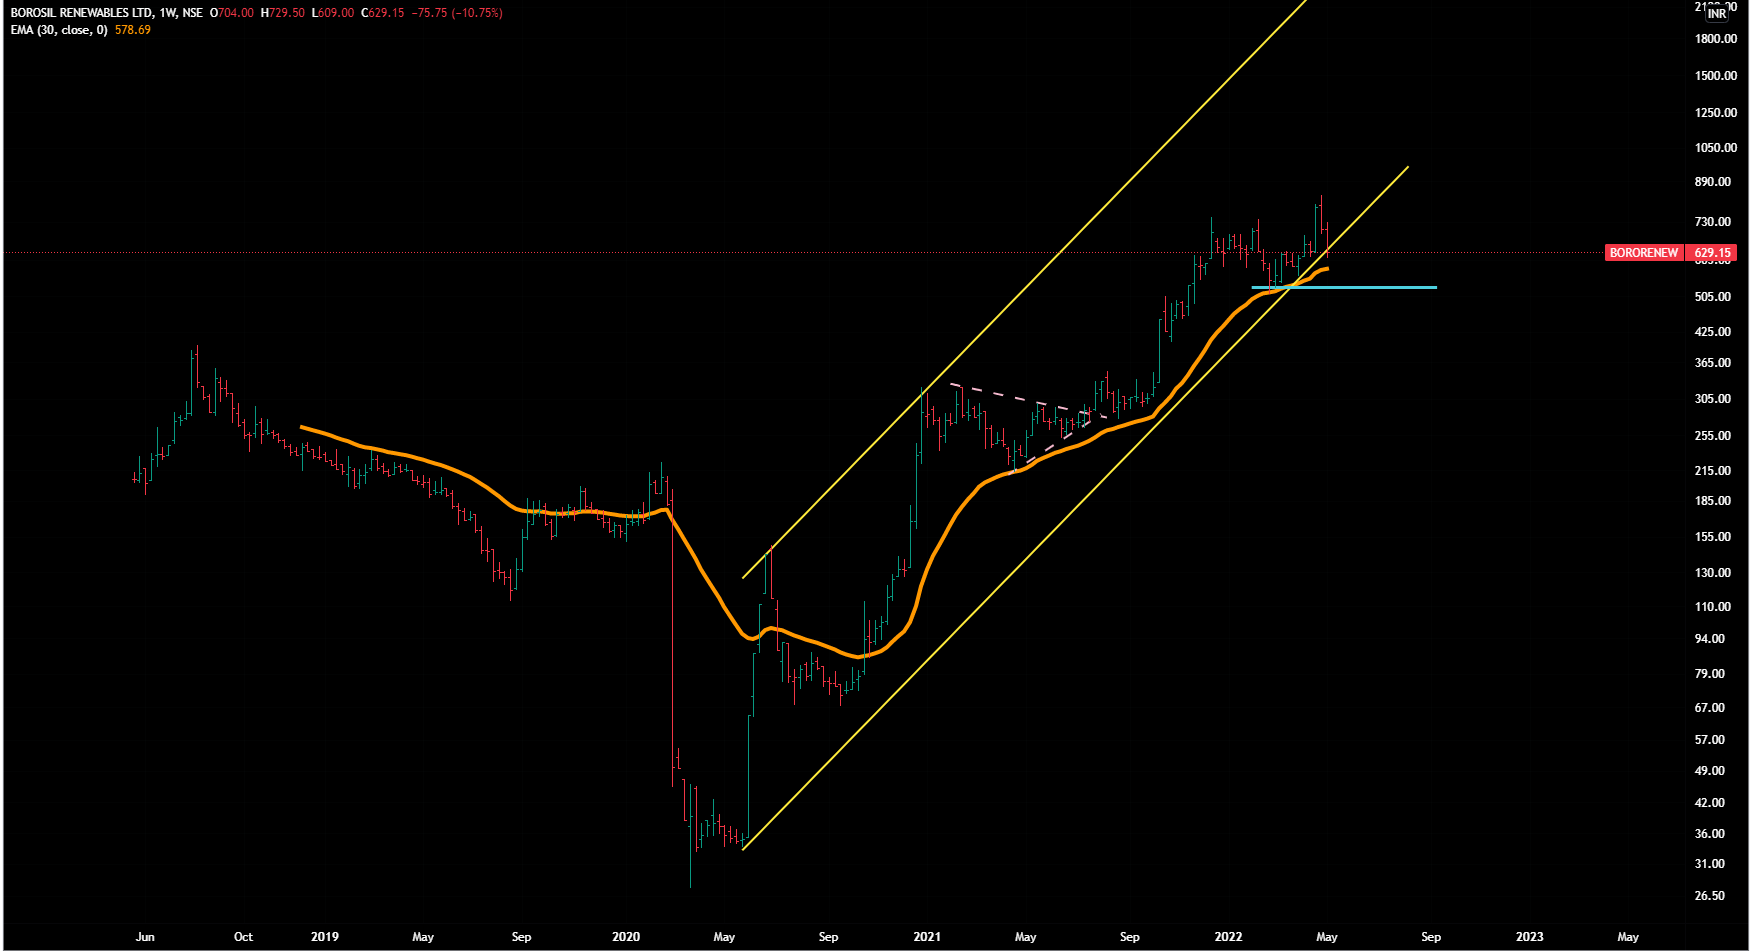
It has corrected a lot from ATH . And now it should get support near channel as well as 30 WMA i.e near 560-570. If it breaks that then 538 (40 WMA as of now) and beyond that we’re looking at support at 506 .
But overall stock is due for a long journey -with ups and downs in between. Currently it is on sell mode on all time-frames.
For new entry prespective, I would watch for MACD buy signal on weekly time frame.as well as stock moving above 30 WMA ( after ongoing pullback) and key support levels ( as given above)
Keep in mind, that technical studies are also time-consuming like fundamental investing - and like a fundamntal investor focuses on quarterly results, OCF, CAP-ex etc, one also needs to keep a track for technical studies .
In short, there’s no holy grail ![]() ,everything needs practice ,patience and being lucky that out of various prabibilities, the most favorable probability works for you.
,everything needs practice ,patience and being lucky that out of various prabibilities, the most favorable probability works for you.
Hope you get your answers.
9 Likes
Hi - Thanks for asking.
Have looked at this stock from technical prespective.
First few suggetions based on my experience:
a) Always start from monthly /quarterly timeframe charts to take longer term view
b) Never look at any stock in isolation - first take overall market view , then sectoral view and then the individual stock .
Stocks of a sector tend to move in a herd most of the times (unless there is a turnaround story e.g M & A, management change etc etc )
Now first the market and sector view :
As share above in a previos post , Nasdaq is in a trouble zone, it has borken 40 months moving average after 13 years , same has happened with Amazon and many other leading tech stocks.
So market as well as sector view is not so encouraging.
Now to Now ![]()
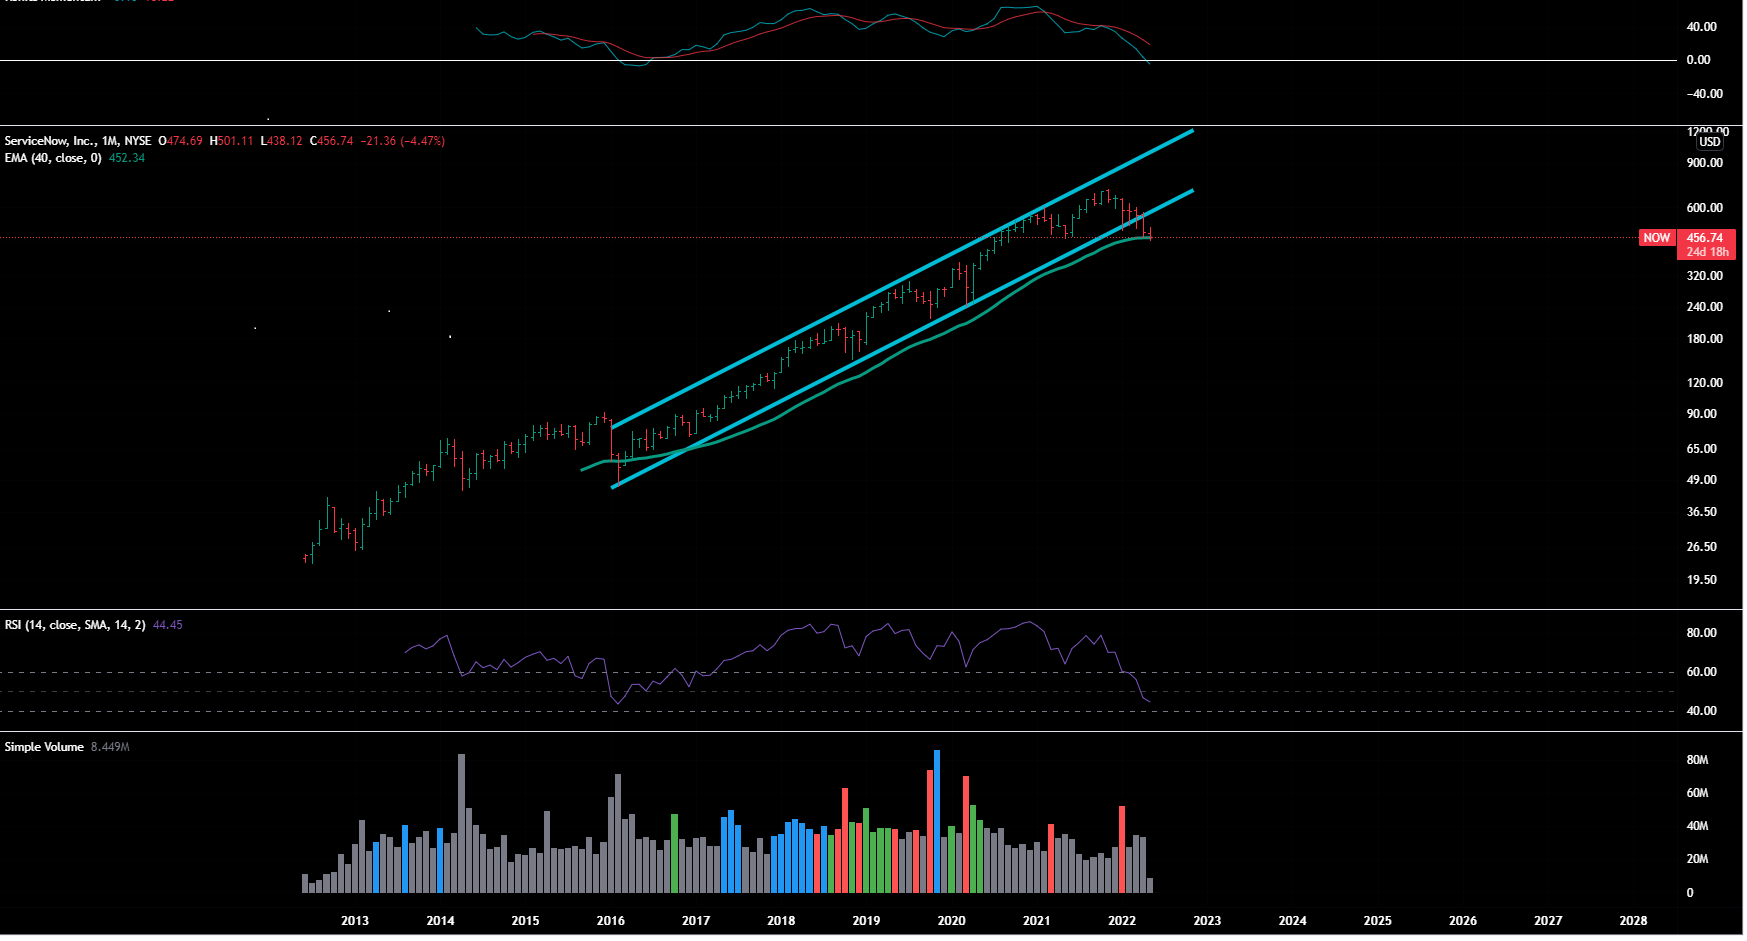
Here is the monthly chart
-
It has broken the very long-term channel - 1st major sign of weakness.
-
An now it is hovering near 40 Week Moving Average ( bit better than Nasdaq and Amazon who have broken their 40 MMA.
-
It has completed full upside cycle on RSI and MACD indicators - but there is always a chance to get into a downcycle.
-
The breaksdown of channel in January was with heavy volumes ,that means big hands have deserted this stock
So as per this , 440 level (40 MMA )is a crucial level - it that get broken - that would another danger sign (big one ) —as per monthly chart , after this break ,the major support would be near 370 levels
But the worry is whether the bigger tech bubble is crashing - if that happens then there would be no surprise that it might come near 250.
On Weekly Charts
It is a clear Stage 4 stock- in Stage 4, it is difficult to tell how much it would fall
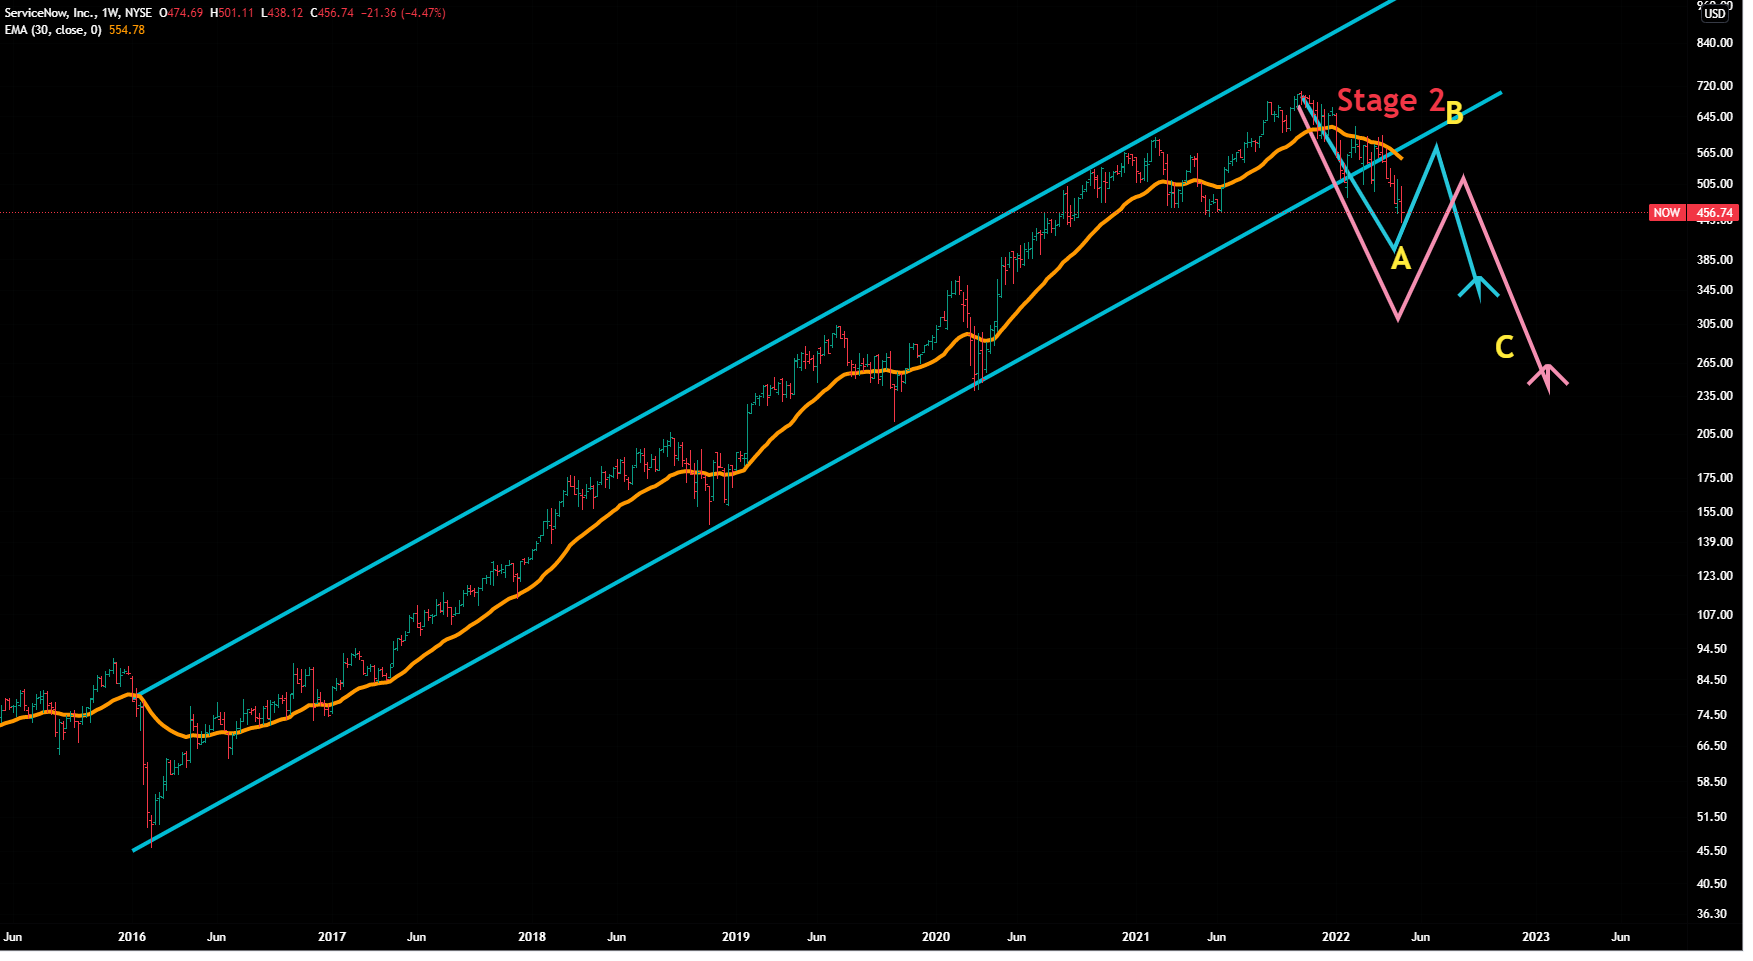
Have drown two likely paths (blue and pink ) - the levels match with the levels given as per monthly chart studies.
For fresh entry : One should wait ( and wait would be long ![]() ) …let it settle down, form a base ( S1), let weak hands get -out and let new big-hands enter , first let it cross 30 WMA (S2) with volumes ,get a buy signal on weekly MACD , then one can add on positions as soon as monthly MACD gives buy-crossover.
) …let it settle down, form a base ( S1), let weak hands get -out and let new big-hands enter , first let it cross 30 WMA (S2) with volumes ,get a buy signal on weekly MACD , then one can add on positions as soon as monthly MACD gives buy-crossover.
6 Likes
pronto response  … I’ll have to study the theory at the beginning… and reread the stock specific write-up… I’m not sure I understood the basics… Let me revert with my doubts… Thank you @StageInvesting!!
1 Like
Ideally go through various posts in this thread ( e.g. the latest one on Now), you would get to know a lot. Basic princilples remain same,
Tata Motors
CMP 408 -already corrected from 546
Can it go down further?
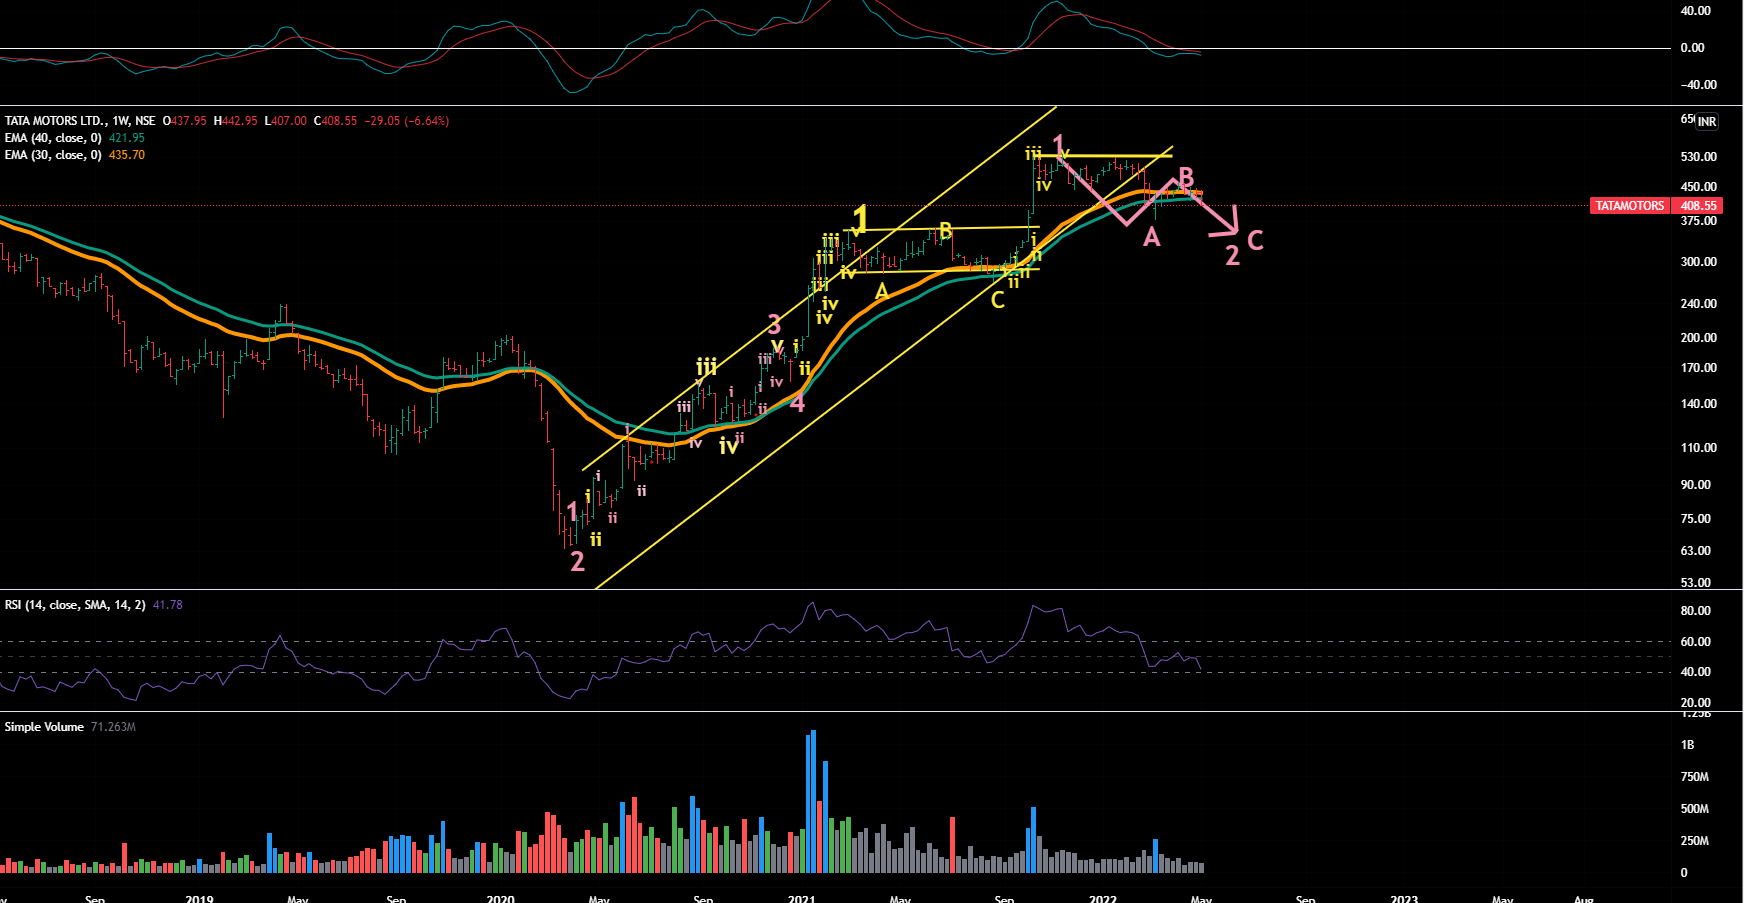
It seems to be in Satge 4- had broken 30 WMA (orange line) last week and this week closed below 40 WMA (green line) and with a real bad big bearish candle .
MACD Timefrmes - Daily/Weekly/Monthly moved to sell side.
From Elliot Wave prespective -overall it is in wave II of bigger wave 3. Currently doing correction in wave II via ABC . We are now in C .
A =C comes near to 340/50 - many a times stocks can finish the correction before that depending upon Fib ratios & overall sector/market sentiments.
The set-up gets cancelled if it goes beyond 440 ( 30 WMA)
Disclaimer: These charts are for study /tracking purposes. No recommendations at all as it is all a matter of probabilities
3 Likes
From 465 to 418 …if it cracks below 409 …lot more downside should come.
Many thanks @StageInvesting . Indeed any bounce in US indices is being sold into and nasdaq is showing strong downward moves. After reading a lot of opinions it seems markets all over the world will take couple of months or even quarters to adjust to liquidity pullback and inflation and consecutive rate hikes. Will watch out for the levels you mentioned for NOW stock. Cheers.
3 Likes
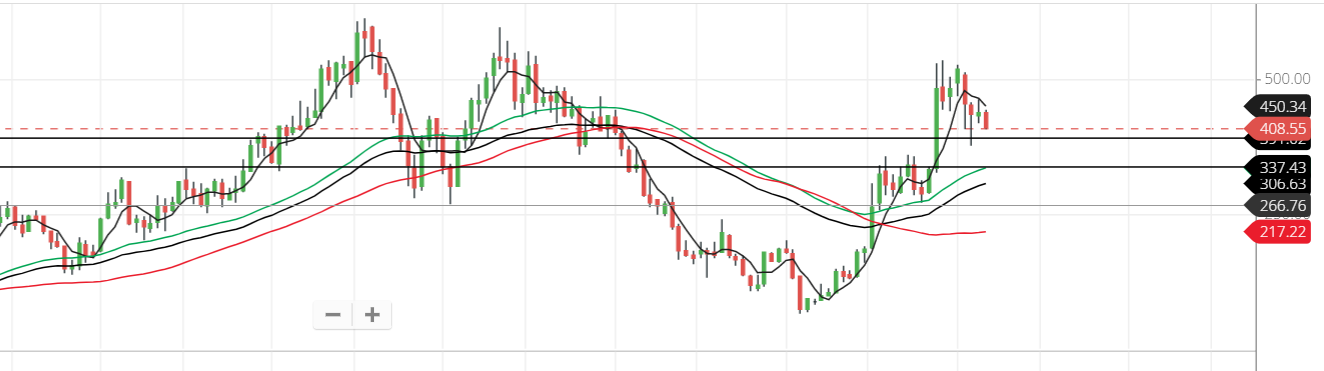
I agree that Tata Motors will come to 338-340 in the coming weeks (if it breaks 390 with volume) which is also a good support from long time. (almost 10 years)
1 Like
Impact Of Fall in 2nd Rung US Tech Companies
Let’s look at 2 of the Indian names (Infoedge already given earlier)
Dixon
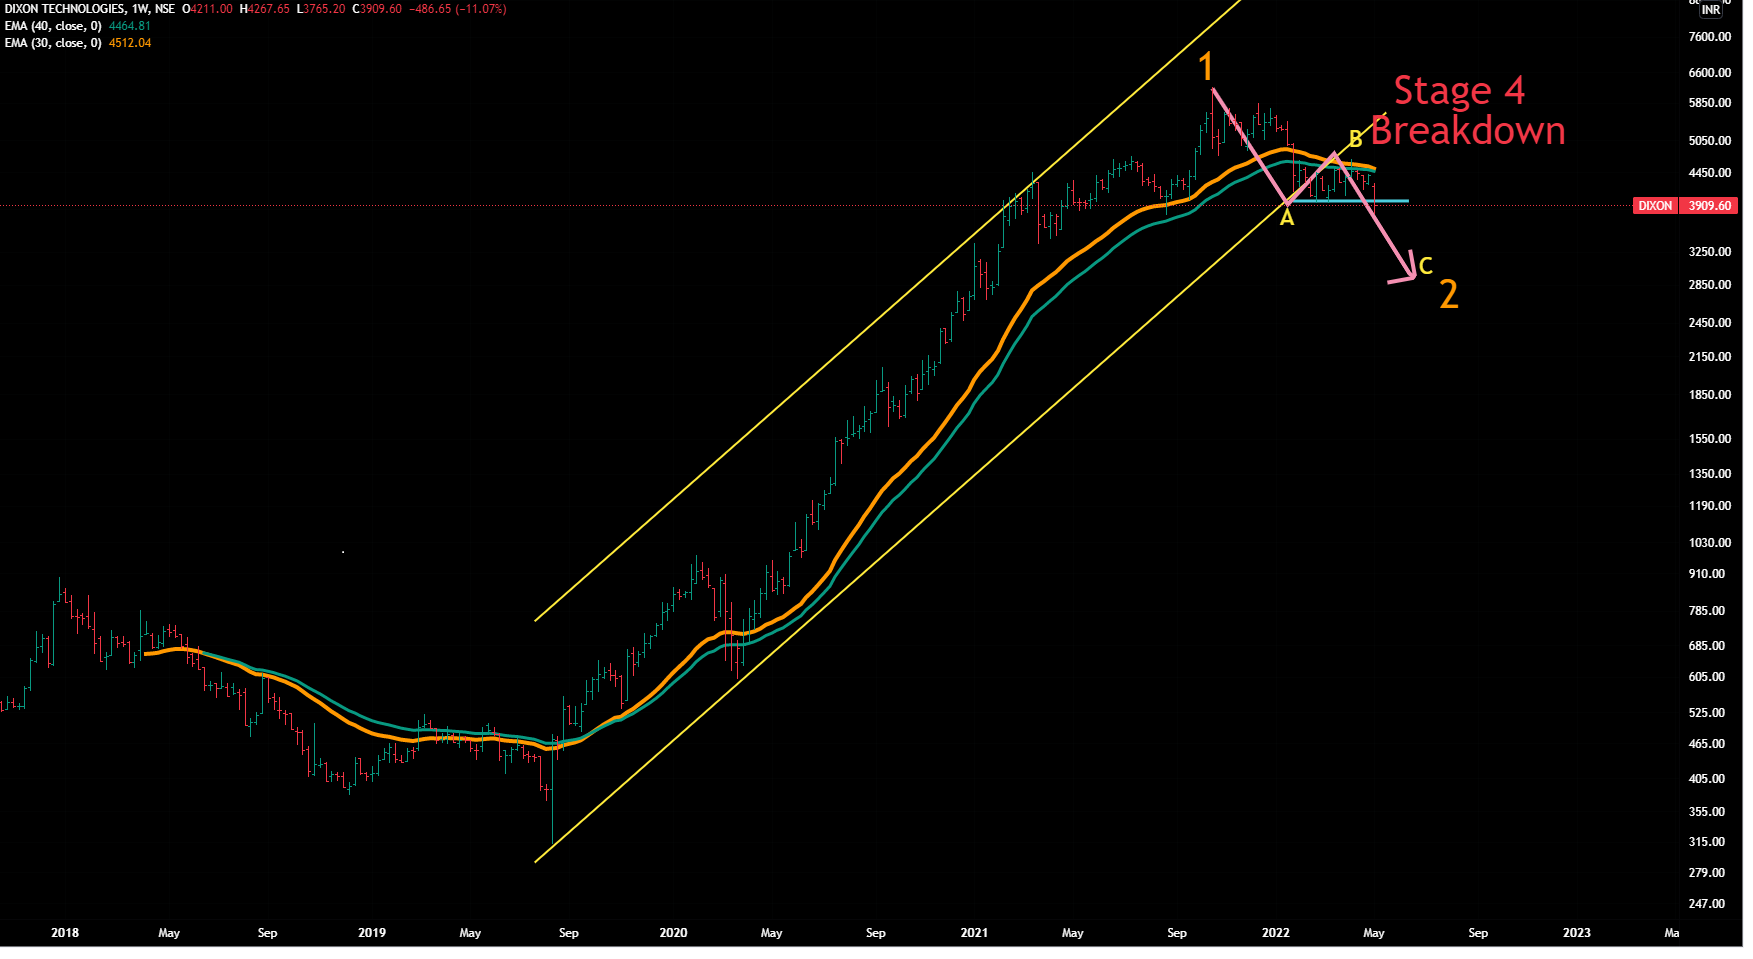
A clear stage 4 stock - in Wave 2 …bottom should be far-far away.
IndiaMart
A clear stage 4 stock - in Wave 2 …bottom seems to be far-far away.
The only difference between this and Dixon /IInfoedge is that Weekly MACD is still in buy mode…waiting that to give a sell signal to ride it downwards.
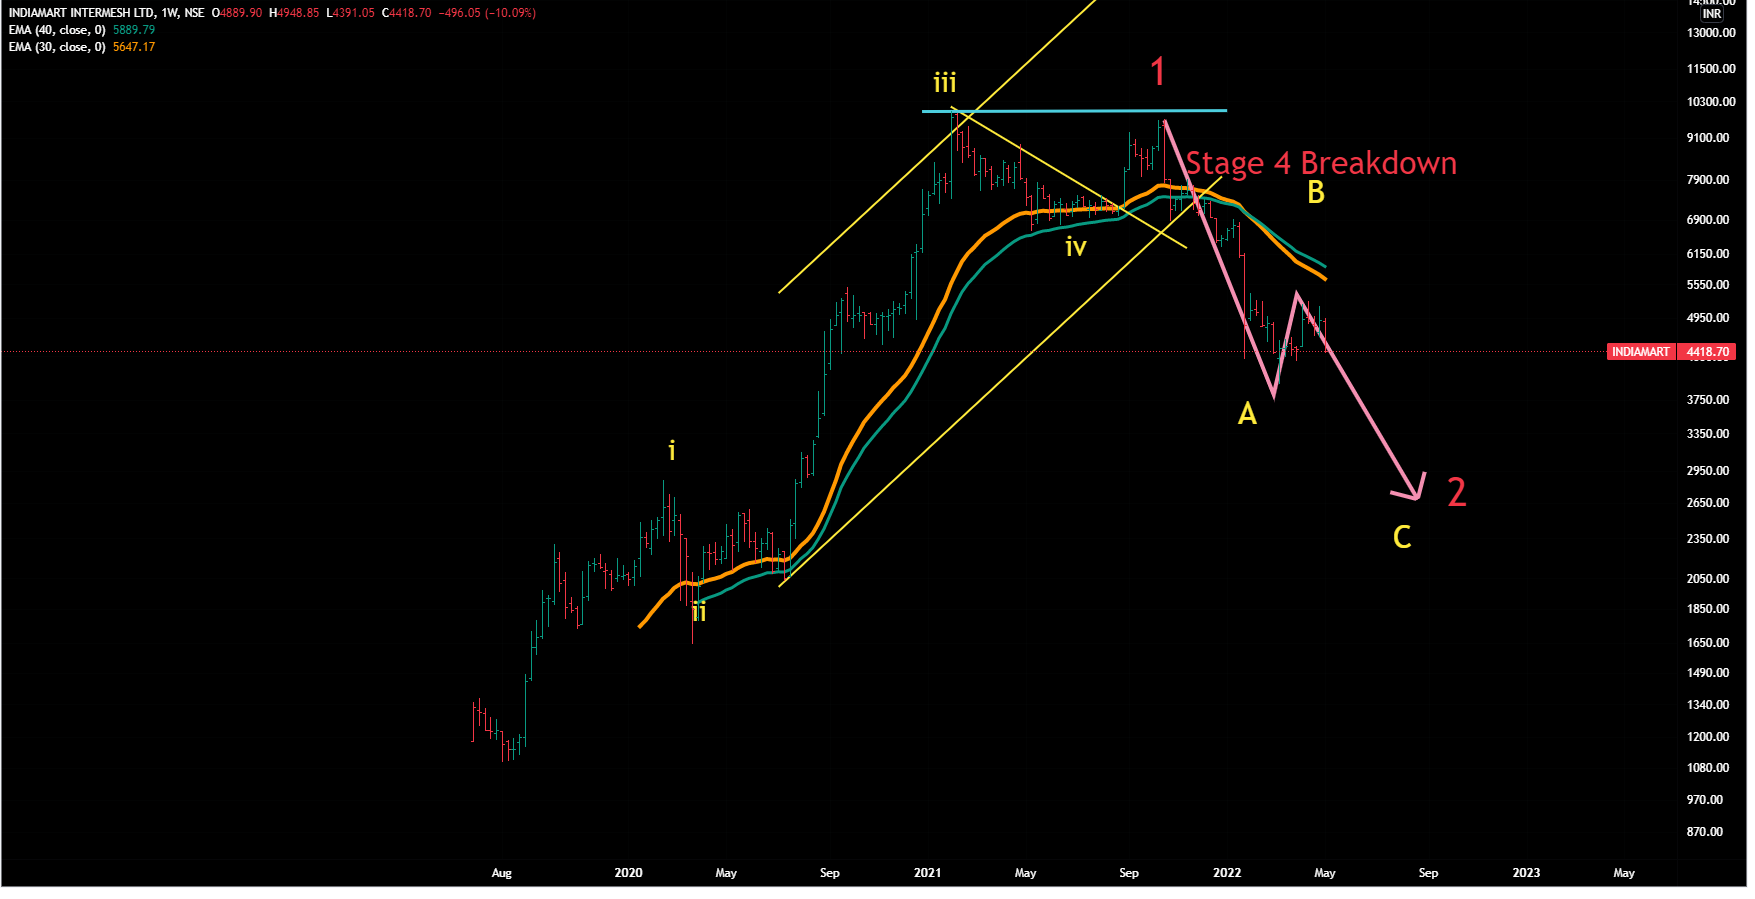
Disclaimer : Charts for study purpose. No recos.
5 Likes
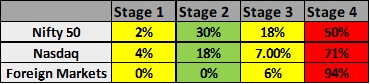
Global Markets - Stage Analysis
Last Week-end Update
Color Code :
Yellow- Can go anyside- Sideways
Dark Green -Strong Uptrend
Light Green - Uptrend but momentum is absent-
Red : In downtrend
2 Likes