
We posted the chart and our view few days back. Please check.
Godrej Properties
CMP-1187
The stock has corrected from 2600— from last October 2021…more than 15 months.
Is the correction over ?
Can’t say but we can see few intial signs.
A triple bottom - and divergence in RSI.
Price was coming to same point but RSI was not going back to old levels .
This is one of the several methods of bottom fishing. But we need lot more confirmations to be confident that correction is over.
Now it can come in the watchlist and once can track as per stage -analysis method.
Weekly chart

Disclaimer :This post is just for learning few methods of price-patterns. Views are personal. No buy/sell recommendations. These are probability study methods and chances of success/failure depend upon various factors.
3 Likes
Galaxy Bearings
We will avoid to give any view on this stock.
The reason is lack of volume.
EW and Stage Analysis works on the basis of mass- psychology about a stock over a reasonable period of time . One of the key aspect of understanding mass psyhology is volume behavious. If there is no volume, that means there’s no mass participation , so applying these methods in these types of stock does not help.
5 Likes
Thanks for the clarification.
On lines of Equitas is Ujjivan reverse merger case. Can you\Have you check the charts for in this case for both - Holdco and SFB??
Also, in these arbitrage cases isn’t there a higher probability of increasing delivery volumes as the merger timelines decrease? So is that a help to the charts or a distortion??
And how vl u play the Equitas case now that the merger is complete and holdco doesn’t trade.
The Bank is solid fundamentally but thr vl be arbitraguers selling pressure initially.
Disclosure :- Invested in all 3 - IDFC, Ujjivan nd Equitas holdco for arbitrage. In TA nd EW - Stilk an Old dog trying to learn new tricks…![]()
![]()
![]()
![]()
Pls mention wave count also…I think it reached 5 in larger wave 1 and wave 2 is already in progress which may contain few pull backs here and there…#Tejasnetworks
Hello Sir,
Its been great learning from your simple, uncomplicated observations the past few months.
Could you pls post your observations on the Polycab chart please?
My understanding:
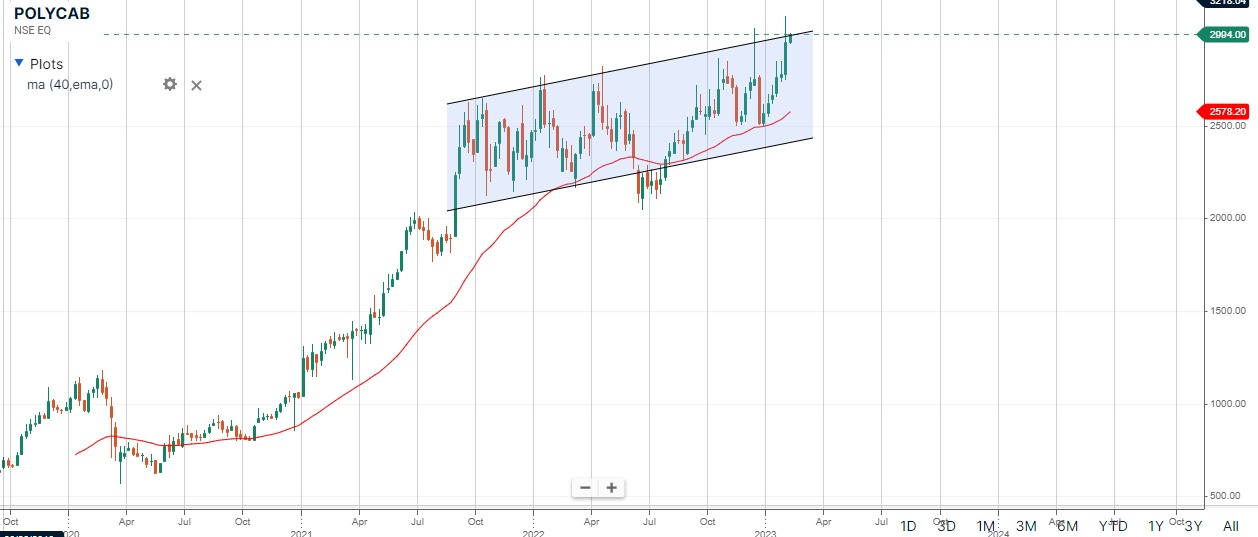
It had a failed breakout above 3000 in the month of December.
Since the Q3 results, it has had a strong run up again, and is hovering around its ATH.
From my understanding, it is consolidating in an uptrend trending box structure, after an impressive couple of years in stage 2, and any breakout above this range needs to be watched out for. It has generally taken support at the 40 week EMA trendline.
Your inputs on this will be useful for my understanding. Please also correct my observations, in case they are wrong.
Thanks.
Dear Sir,
Few points here:
a) We never look at delievery % ge. That does not help us much and we just treat it as an extra data-point of no value.We only look at volume traded.As far as charts are concerned, they take everyting into account.
b) We get into arbitrage of we find the underlying business at a good valuation and we plan to hold it for good. We finf all of these 3 as good -fundamantals companies and charts are quite fine for long term.
Hope this helps.
2 Likes
Thanks for checking.
To answer your question, first we need to tell something about MACD cycles.
On top of our charts, you will always find MACD. It can help in finding the direction. But keep in mind that signals on weekly/monthly take time to play out.
Now let’s have a look at the PolyCab
First let’s have a bigger picture.
On monthly chart, MACD gave sell signal in Jan 22 and we had a one year long correction ,sideways movement.
Now MACD is flat for last 3 months with little bias towards upside that indicates that stock might resume its upward journey. But this needs to be confirmed from shorter time-frames MACD ( weekly/daily)
Ideal situation is that MACD green line should come to zero line and then should move upwards but in many cases it does not happen and MACD moves up without touch the zero line. That means that it is not a fresh move but it a move that is balance from the previous -upward ( downward ) journey.
Monthly chart.
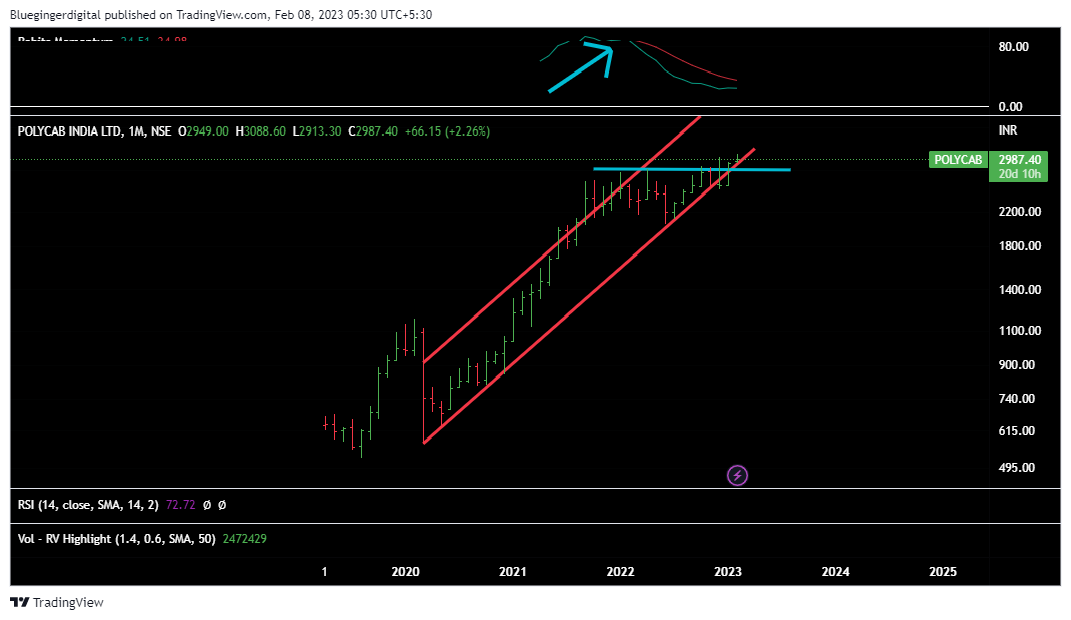
MACD gave a sell -signal In Jan 22 when price was near 2900 and stock corrected near to 2000 in coming month.
But keep in mint that weekly and monthly signals take time to play out.
Sometimes you might get a sell signal on MACD but stock -price keeps going up or keeps moving in a range.The pattern at that point is known as distribution pattern - that means that big hands are exiting but they don’t want the price to fall immediately as they want to sell their big quantity at higher levels only.
But the price won’t go far as the direction has been set. So sell/buy signals on weekly /monthly MACD should be taken as an alert and one can plan phased entry/exit based on other parameters (Stage Analysis or any other methods)
Now after we’ve looked at monthly chart for bigger picture, then we come to weekly chart for medium term signals.
Weekly Chart
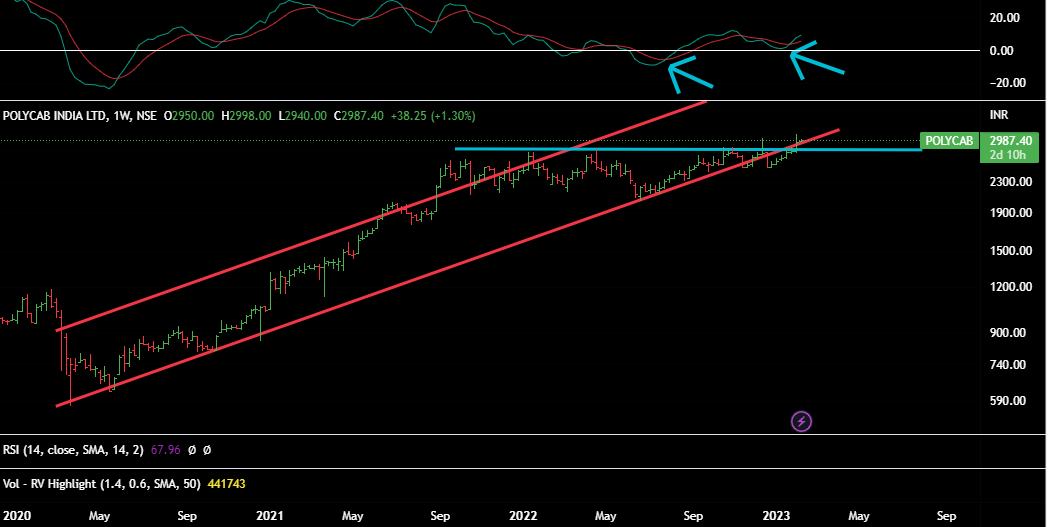
Here we get anothe confirmation on what montly MACD was trying to tell.
We can see that few weeks back we got a buy signal ( the first blue arrow), stock moved up and then we got the sell signal, it came to zero line completing one cycle ( correction of that leg) .
And now again we’ve a fresh buy signal and fresh upward move should start.
For more shorter term ,people use weekly/daily/hourly charts.
Hope this is helpful.
Would suggest to look at few charts of the past on daily basis - on all time frames and get a hold on how MACD indicator moves . Slowly -slowly one gets used to it.
11 Likes
MACD cycles are magic cycles.
If someone can get a sense of these by regular practice and observation, his investment journey can reach at a different level.
We gave an overview in the morning post.
1 Like
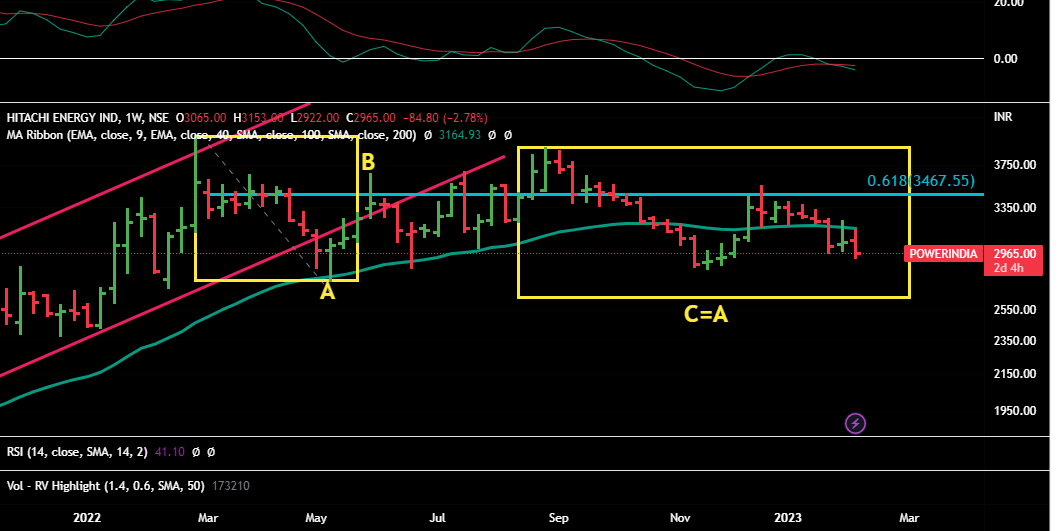
PowerIndia
Oops we just realised that you asked for Power India but replied with ABB India …correcting the mistake.
We had posted the chart of Power India in April 22 …the movement is as per the same chart.
Old chart is here ![]()
It has been going up and down but overall direction is same as projected 10 months back.
Here is the updated weekly chart as of today.
Disclaimer :This post is just for learning few methods of price-patterns. Views are personal. No buy/sell recommendations. These are probability study methods and chances of success/failure depend upon various factors
2 Likes
VBL SURYA SEEMS QUITE STRONG ALONGWITH APAR IND.
What your view on Paytm ?
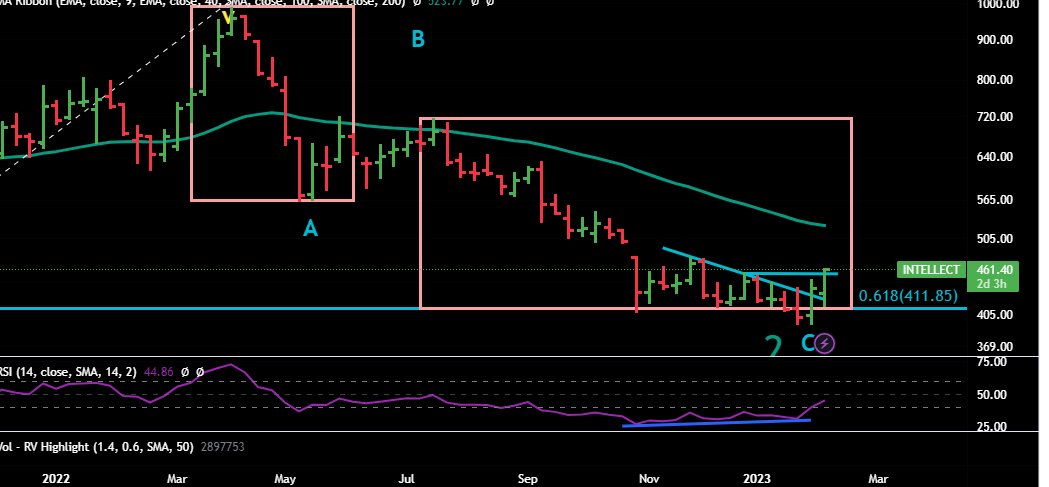
Intellect Design -Follow-Up
461
RSI divergence and other factors( as mentioned above) worked in its favor .
Now next hurdle is 527 -40 WEMA levels.
Let’s keep a watch.
Weekly Chart
2 Likes
PayTm
It should do well. Profit coming in …long way to go.
Saying this on the basis of our market experience and fundamental understanding of business.
Not posting chart as it is hardly has nay history - we should have a history of at least 1.5 -2 years for doing technical analysis for investment-purpose.
Disclaimer :This post is just for learning few methods of price-patterns. Views are personal. No buy/sell recommendations. These are probability study methods and chances of success/failure depend upon various factors
2 Likes
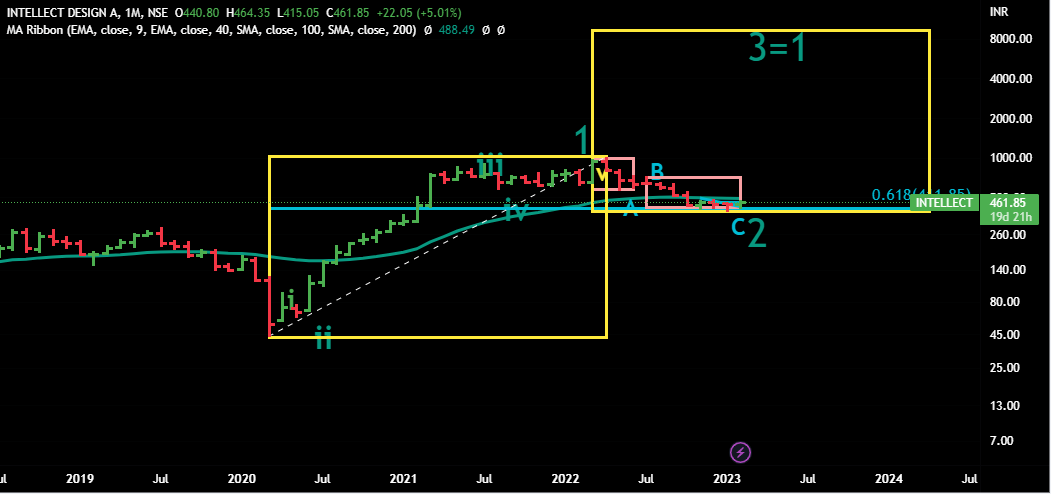
Intellect Design
CMP 461
If wave 2 is really over , and wave 3 has started then we’re getting an incomprehensible target for this stock for next few years.
That is 9000— yes your read it right . It is nine thousand …but it might take years or a decade . And company has to do some really amazing stuff.
Most of us won’t believe it… it is same like many did not believe when we gave unimaginable downside targets for many stocks in last 10 months.
But before we go there , we need lots of conformations whther wave 3rd has started. Like said before , first it needs to cross and close above 40 WEMA.
Monthly Chart
Disclaimer :This post is just for learning few methods of price-patterns. Views are personal. No buy/sell recommendations. These are probability study methods and chances of success/failure depend upon various factors
7 Likes
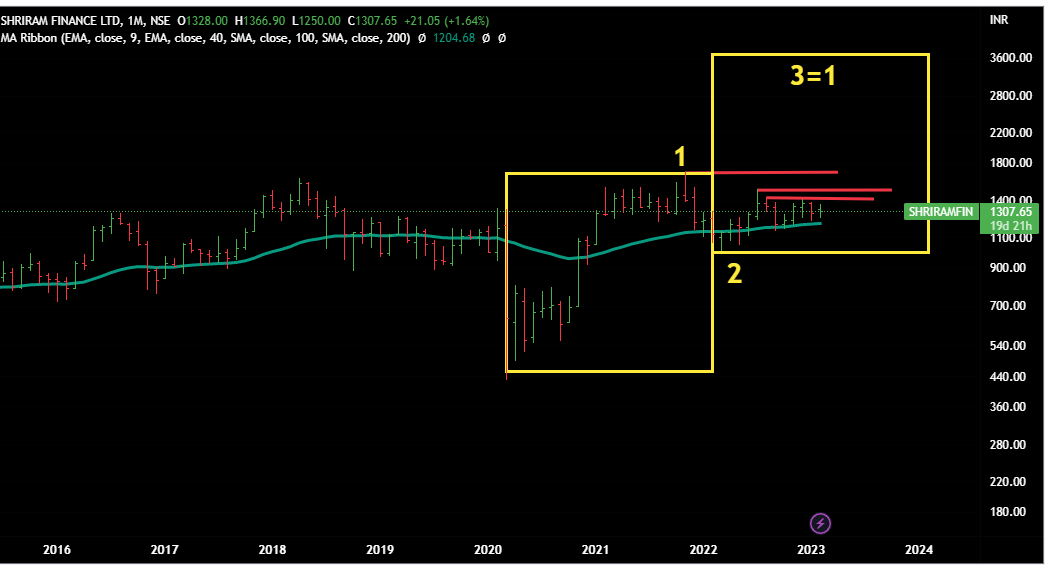
Shriram Finance
CMP 1307
Whenever it starts 3rd wave ( first ot needs to cross several red-lines )- the target as per current situation is coming someweher between 3500-4000.
But for that ![]()
a) Company has to continue its current performance
b) Finance sector overall should continue its bull-run
c) And no doubt ,it needs to cross the res-lines hurdles.
d) Monthly MACD should turn into buy
And because this is monthly chart, targets would take months/years.
So many slips expeted between the cup & the lips.
Monthly Chart
Disclaimer :This post is just for learning few methods of price-patterns. Views are personal. No buy/sell recommendations. These are probability study methods and chances of success/failure depend upon various factors.
3 Likes
Tks
Whats your view on VBL n Bharat rasayan?
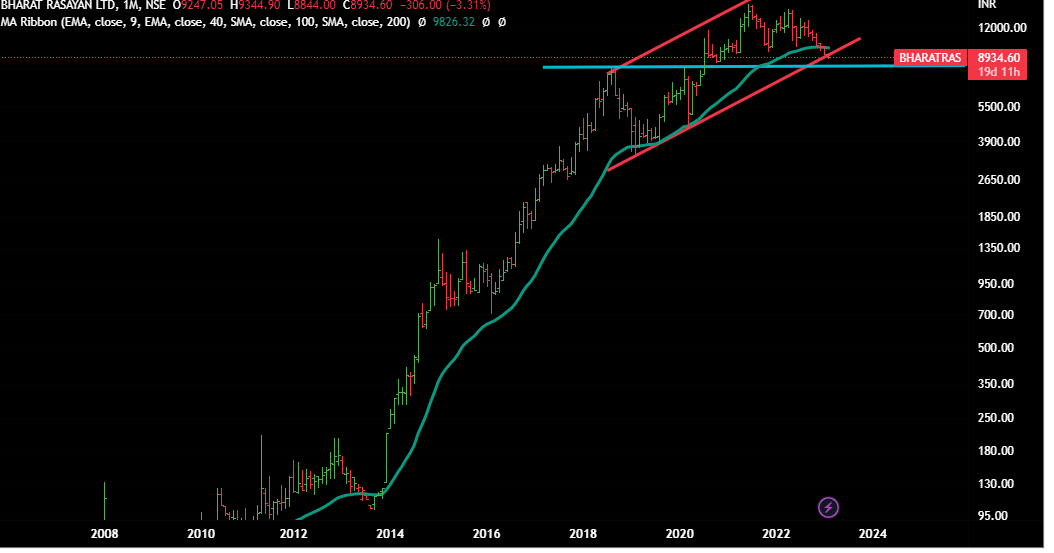
Bharat Rasayan
CMP 8934
It has just broken rising channel - it is in Stage 4 since last few months.
Currently it is trading below 40 months moving average - so it needs a lot of strength , lot of buying by big hands to re-start its upwards journey.
And it has broken the recent rising channle also - againa sign of weakness.
As per monthly chart , next support should be near 8100-8200 levels ( shown by blue line)
But of results don’t improve and sector-stocks do not change its path , then fall can be brutal.
In very short term it can halt or can remain range bound as RSI is at very low levels on daily charts and it needs to be heated up to start next leg of fall.
Monthly Chart
VBL
This is what we call a monster stock - these kind of stocks keep going up , keep extending by adding new legs. One can just track it by using certain moving averages. Difficult to predict the top .
Track them and exit if they start breaking key moving averages on weekly/monthly charts.
But if someone is thinking of entering of these kind of extended stocks after this kind of upmove - it can be a lottery - can go anyside.
If you wish to know more about these kind of stocks , you can read the book names Monster Stocks
Disclaimer :This post is just for learning few methods of price-patterns. Views are personal. No buy/sell recommendations. These are probability study methods and chances of success/failure depend upon various factors.
2 Likes
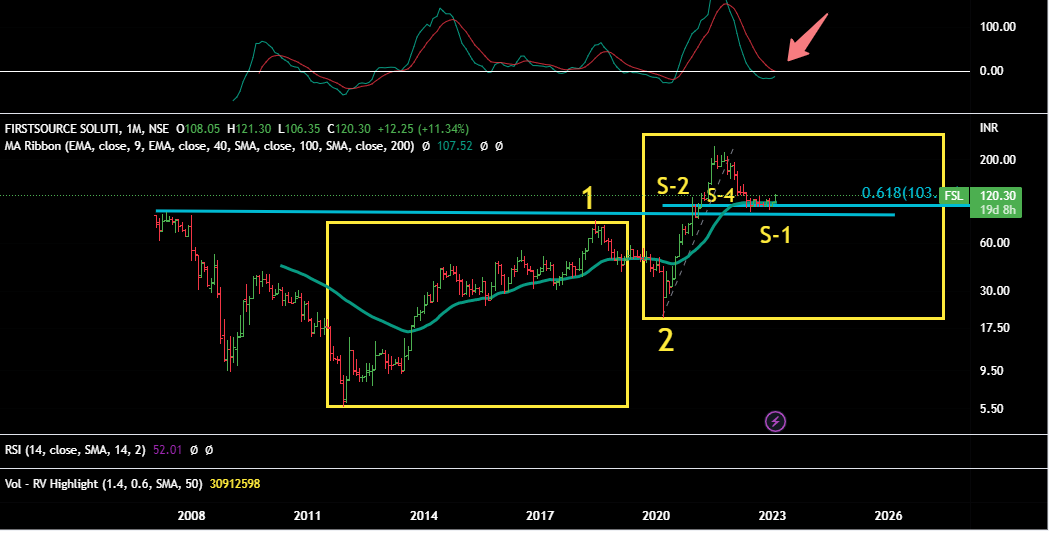
First Source Solutions (FSL)
CMP 120
Many lessons here if you’re on the journey of learning technical analysis with us.
We start from monthly chart to get the big picture first.
Stock has corrected 61.8% of whole rise from March 2020. Took support at ATH levels of 2007 . And is making a base.
MACD has completed the sell cycle and now is turning upwards. Yet to give a complete buy signal.
Monthly Chart
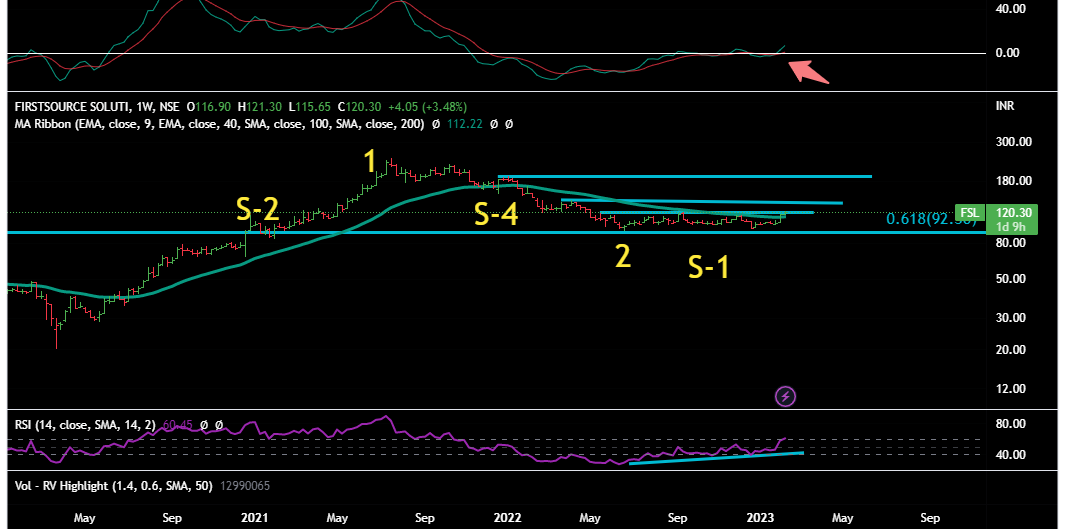
Weekly Chart
Price has moved above 40 WEMA , has formed a base of Satge 1 for last 8-9 months.
MACD has given a buy signal.
RSI divergence is clearly visible on the charts.
Good volumes in last few days.
Stock has corssed the initial trading range - all these are early signs of starting a fresh Stage 2 (fresh wave)
But has lots of left-side resistances.- hence entries can be staggered on the basis of crossing these resistances.
Daily Charts
In very short term, it seems that MACD is exxtended a bit, RSI is overheated.It can correct a bit- it may come back to re-test the breaking point of trading-range ( a normal behaviour)
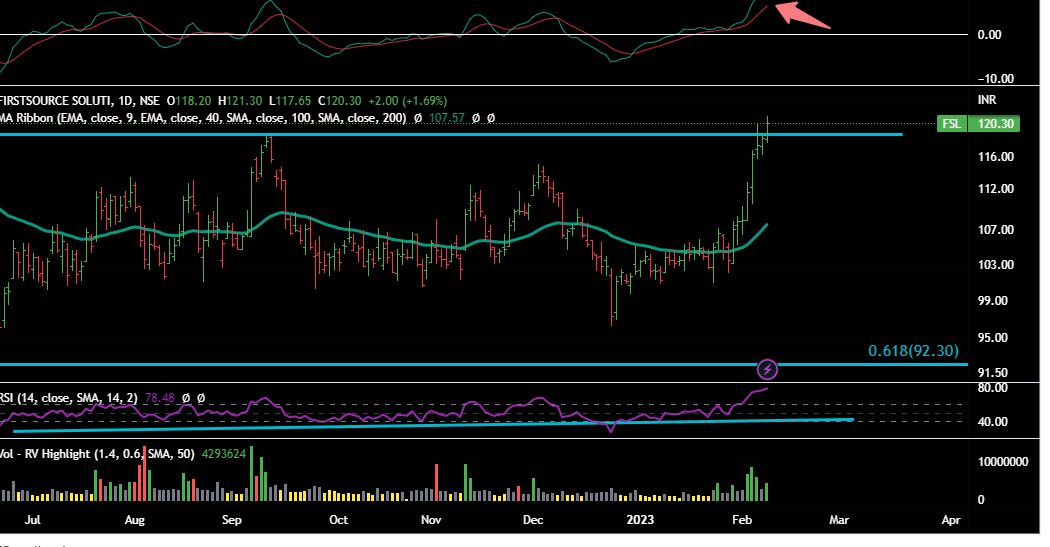
In short - this stock can be kept in watchlist , let it come back to retest the break-out levels and if it goes up again , one can start making the staggered entries based on crossing of dofferent trading -ranges.
Disclaimer :This post is just for learning few methods of price-patterns. Views are personal. No buy/sell recommendations. These are probability study methods and chances of success/failure depend upon various factors.
4 Likes
What’s your view on Oriental Carbon Chemicals Ltd and Vinati Organics? @StageInvesting
What’s your view on India glycols?