Sir
Thanks a lot for the quick inputs. Actually, i am already holding it from past 2 years. i completely agree it has delivered good returns. The price is maintaining good momentum after the recent pullback, hence i was thinking it is good to hold for some more time.
As in this market, it’s quite tough to find good Fundamental bets aligned with technical charts.
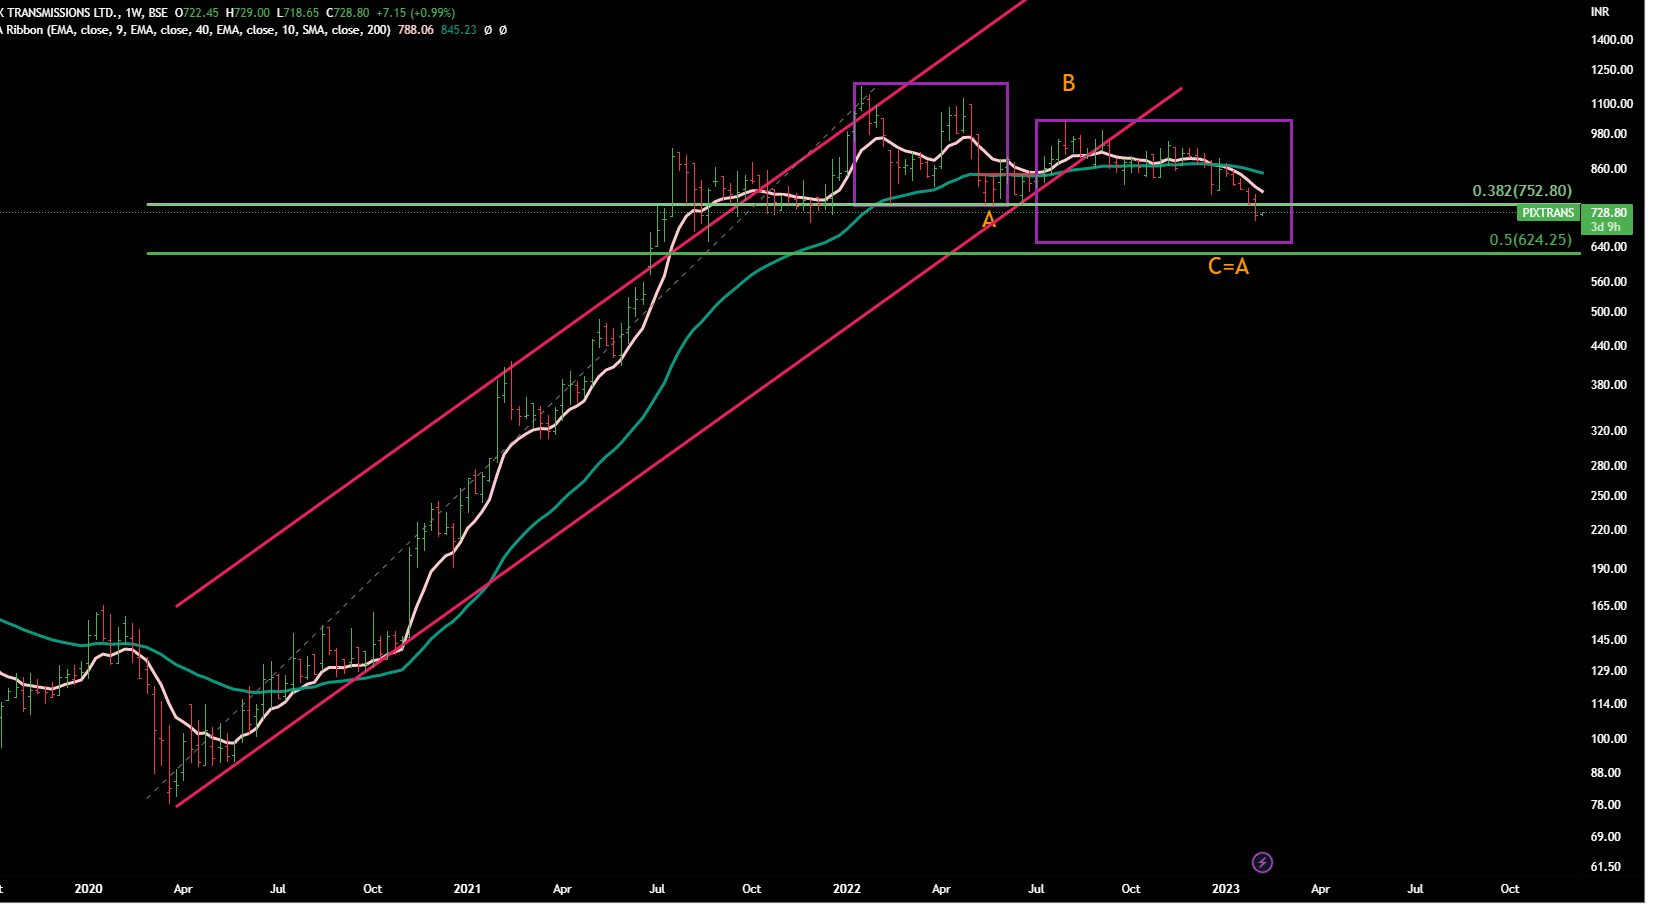
It seems to be in Stage 4 as of now. Some corrections is still due. After that it should form a base in Stage 1 (moving in a range) . Stage 1 would indicate the entry and slow absorpition (of supplies) by big hands. Weekly Chart
Disclaimer :This post is just for learning few methods of price-patterns. Views are personal. No buy/sell recommendations. These are probability study methods and chances of success/failure depend upon various factors.
Bottoming out means that price should stop dropping further and price should move in a range. MACD and RSI should look flat , mostly in oversold zones.
Don’t think we need to comment on most of the stocks mentioned by you .
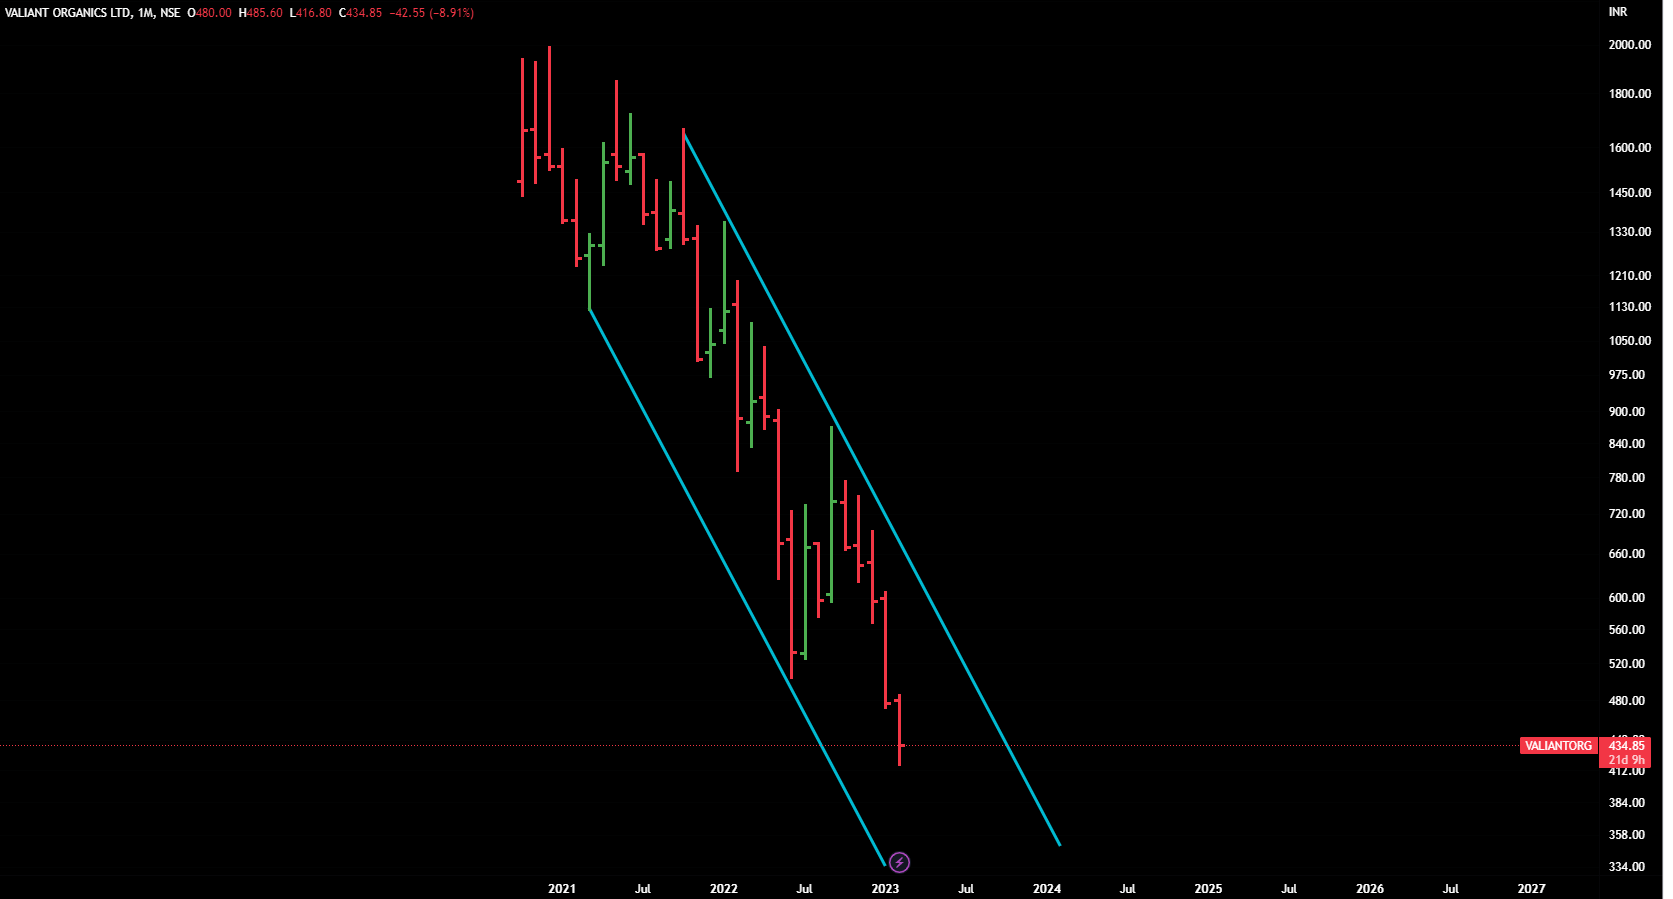
A simple look on price -action of last few weeks and eveb a newbie can judge that many of them are just acting like falling knives.
Fairchem.Prestige ,PNC are falling -Stage 4.
Let them stabilise , form a base in Stage 1 . Only then we can analyse.
SJS - has a very small history hence not suitable for technical analysis method- a stock should see at least one bear market to make any projection about it.
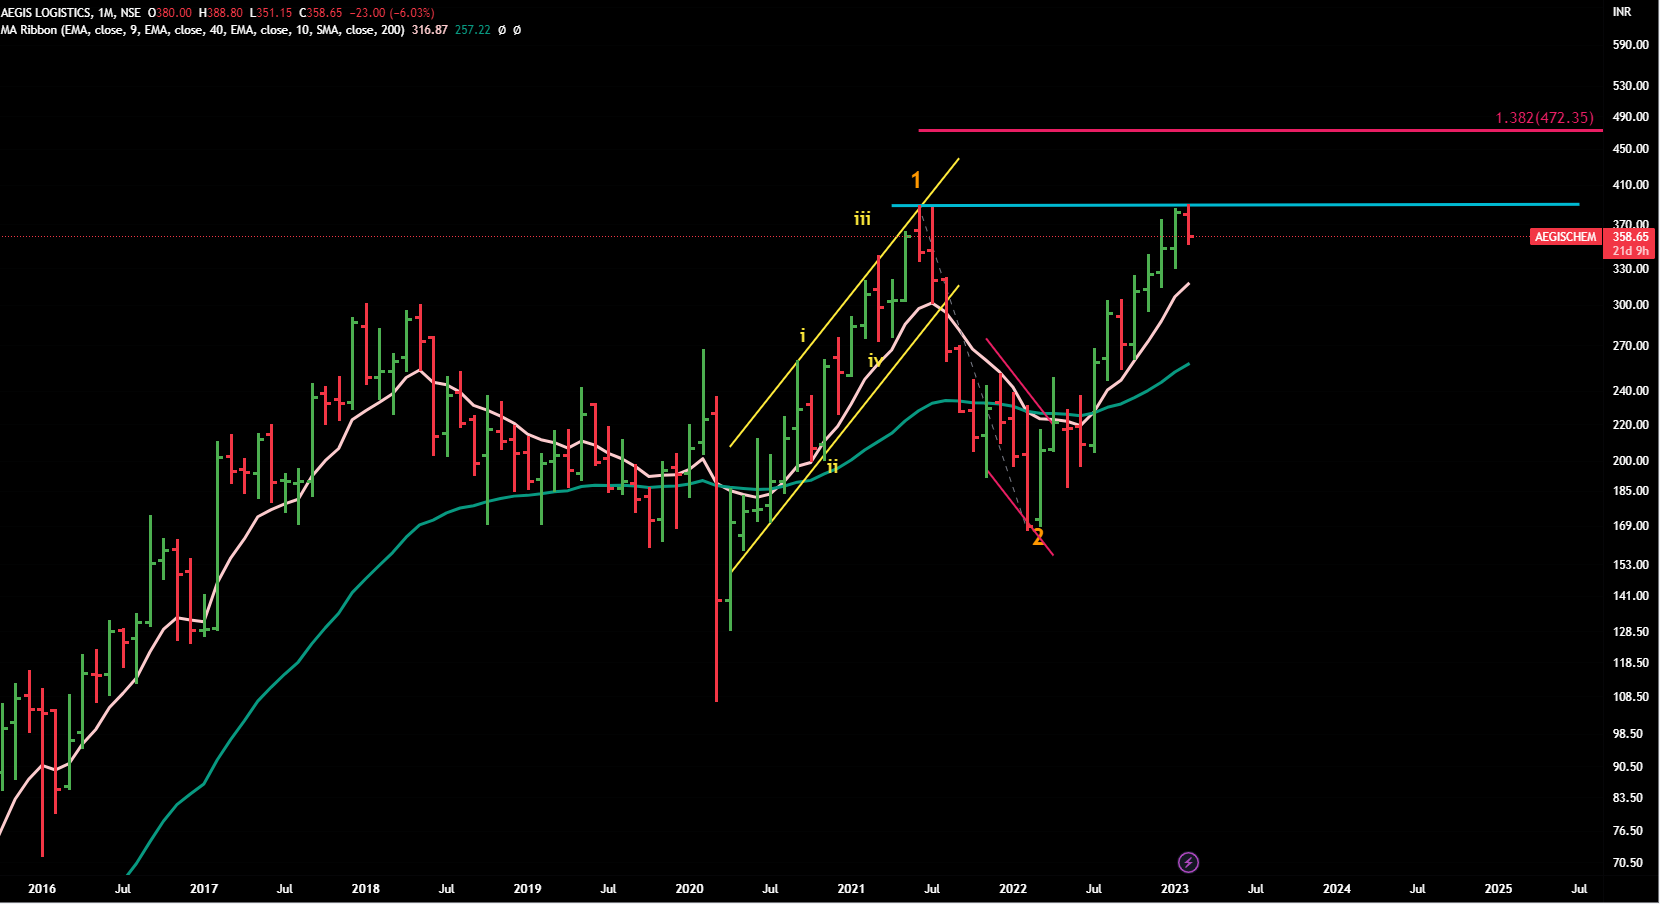
Aegis
CMP 358
Seems to be at a key resistance zone- should stabilise here .
If it again crosses and closes above its all time high in coming weeks with volumes, then we can assume that next leg of upward journey has started.
Disclaimer :This post is just for learning few methods of price-patterns. Views are personal. No buy/sell recommendations. These are probability study methods and chances of success/failure depend upon various factors.
Disclaimer :This post is just for learning few methods of price-patterns. Views are personal. No buy/sell recommendations. These are probability study methods and chances of success/failure depend upon various factors.
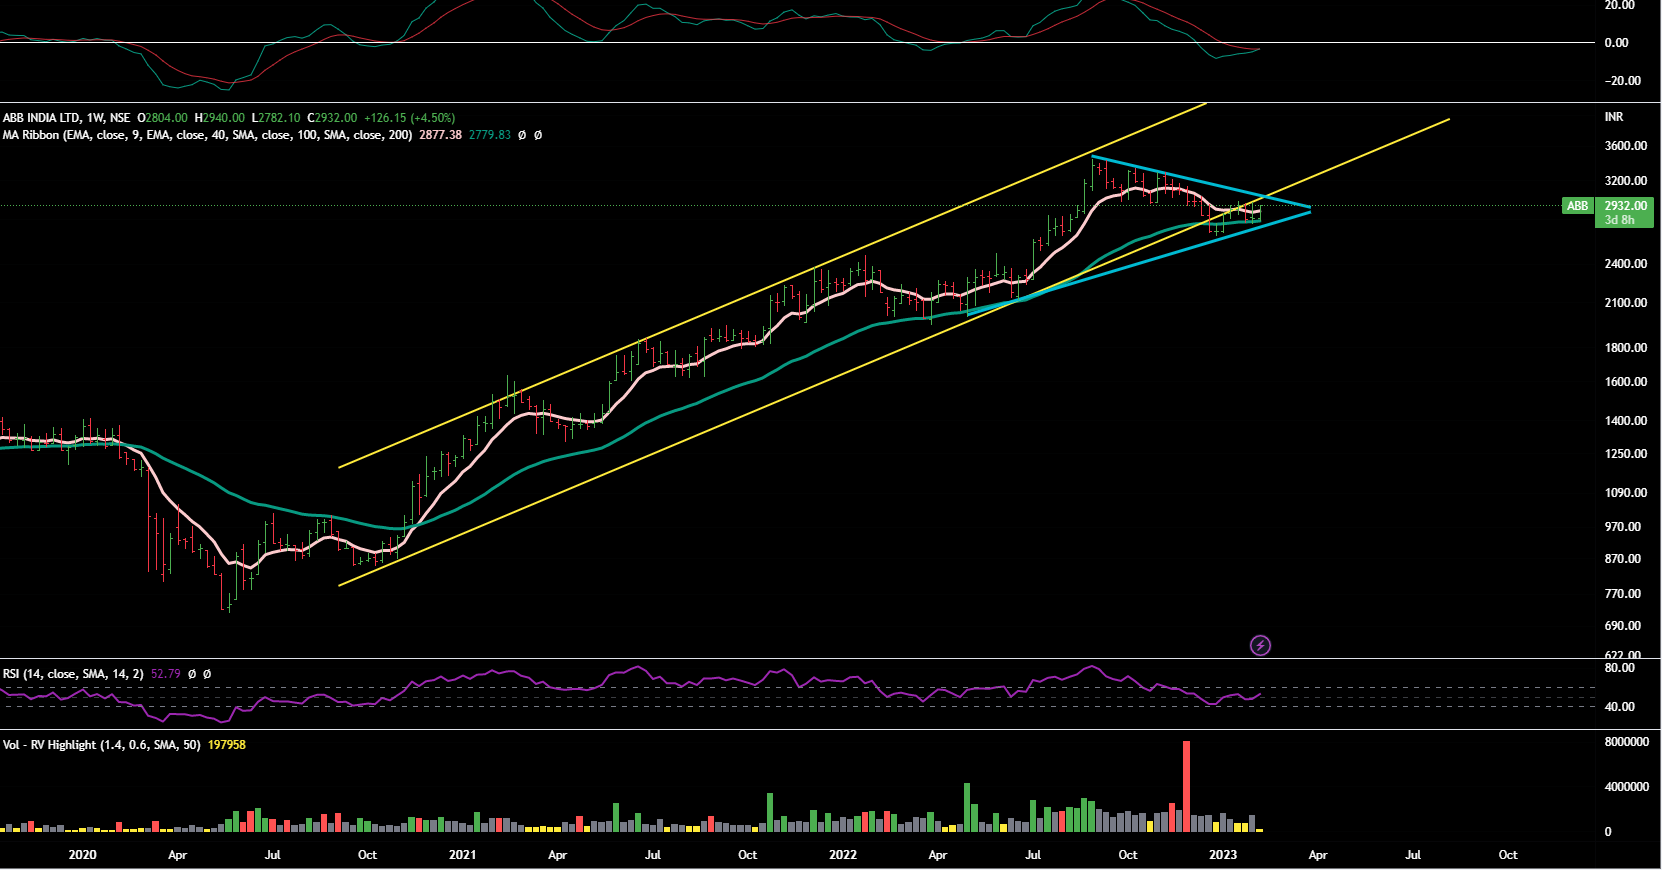
It is part of our core holdings ,a lkind of family jewel.
We entered from very low level -during Covid correction and we keep on holding this.
Currently it is trying to re-enter the channel. Weekly MACD has given a buy signal.
But it needs to cross/close above 3100 convincingly (with volumes) to starts its next leg.
Disclaimer :This post is just for learning few methods of price-patterns. Views are personal. No buy/sell recommendations. These are probability study methods and chances of success/failure depend upon various factors.
Sometimes in stocks in prolonged downtrend, stocks tend to remain well below the 40 month MA you mention often… But in early stage of recovery, after brief base building it goes above 30 WMA and gives an indication of a possible reversal. Though being below 40 MMA we are not too sure about trend reversal. How do you approach such a situation?
thanks , my query was for abb power (hitachi energy), my confusion is same as hitesh bhai , many times share price moves in range below 30wema and touching 40wema occassionaly . what should be our stand
In addition to moving averages, we tend to take a view from other indicators - MACD and RSI.
For example, in this case (ABB) , we see daily and weekly MACD has turned into a buy but the doubt remains as monthly MACD remains in sell here .
(But genearally it happens if any upward -wave is balance ,even if monthly MACD has turned into sell and it can turn towards buy later on , and first indications come from daily/weekly MACD turning up)
RSI divergence is other thing we check. For example, we recently took intial postion in SonaComs- because on weekly charts we observed RSI divergence .While price was falling , RSI was not making lower-low and MACD was whipsawing . So we took the cue from RSI.
Apart from that we try to check fib ratios of retracement in addtion to candle patterns.
Hi StageInvesting,
Thank you for teaching all of us through your analysis and it really helps a newbie like me.
What are your views on Galaxy Bearings as a long term pick and is it the right price to accumulate through SIP
Thanks for the detailed explanation you have given in recent reply about combination of indicators used.
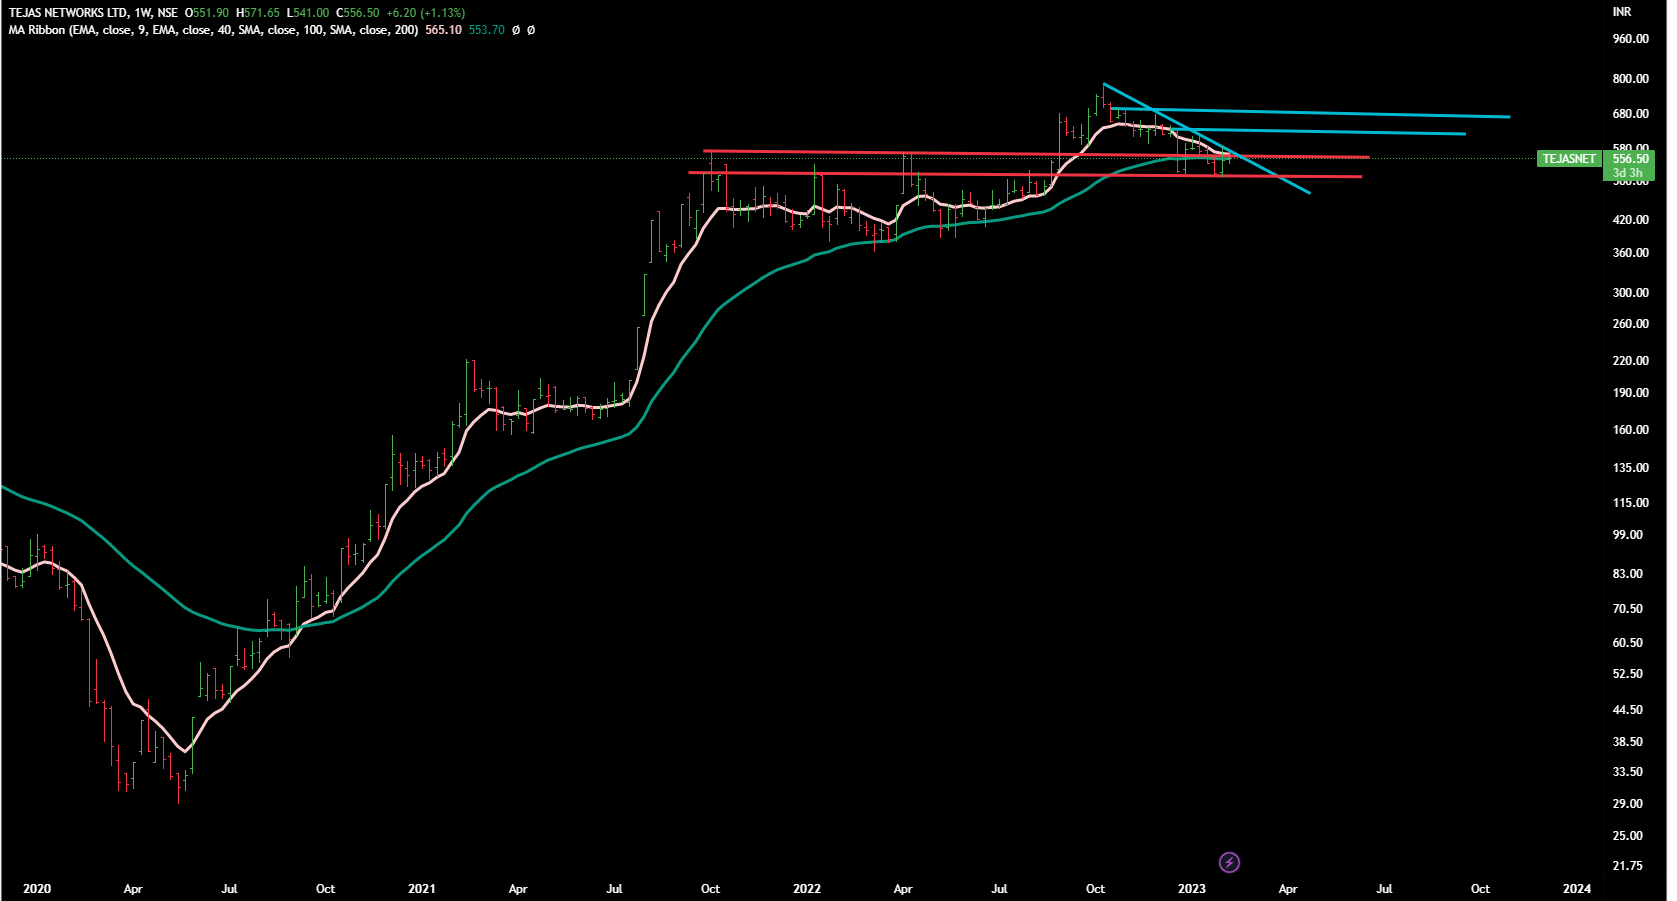
Pls check chart of Tejas network… results wise it still remains laggard…how u analyse current chart, BSNL 4G deal it is going to execute in coming quarters…thanks
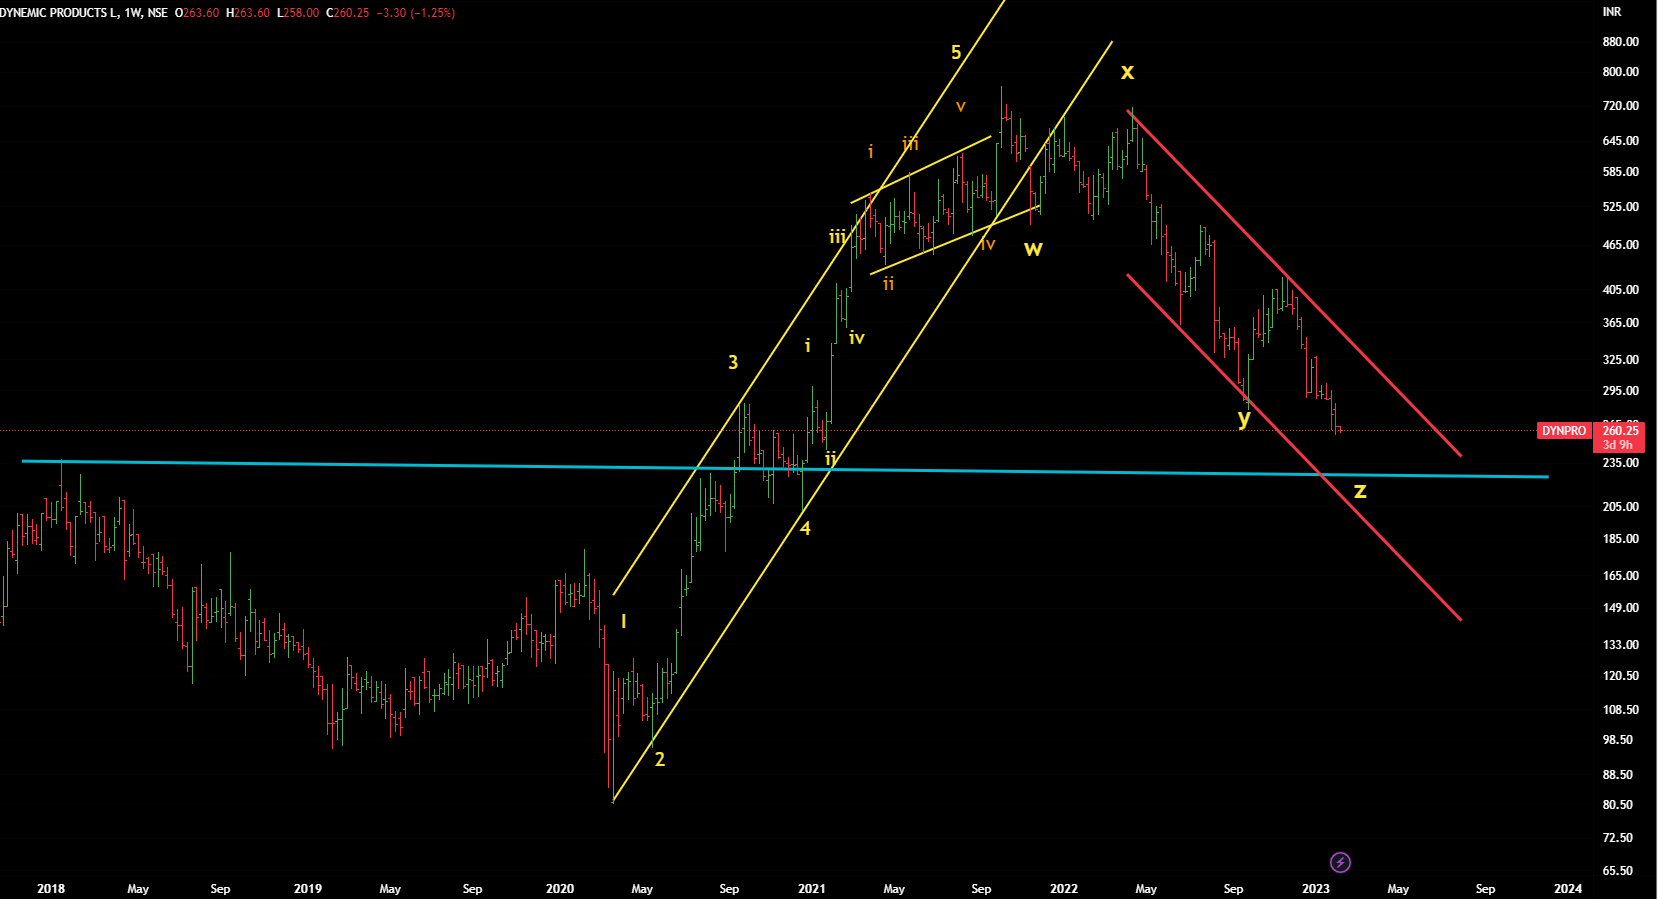
Majority of juice has been taken out -stock went from 30 to 770.
One leg of upmove might come in future.
But when?
Well, you can help yourself.
Draw these 5 lines on your weekly chart - 3 blue, 2 red.
In these kind of extended stocks, we always go for pyramiding.
When the price crosses/closes above the 1st tilted blue line, one can add small position. And when price crosses/closes above the horizontal blue lines, one can keep adding to the positions . Last postion should be added once the price crosses all time high.
Red lines show a trading zone -nothing would happen in this except rangebound movement. But if someone is holding and price starts closing below the lower red -line, sell and run away.
Disclaimer :This post is just for learning few methods of price-patterns. Views are personal. No buy/sell recommendations. These are probability study methods and chances of success/failure depend upon various factors.