Disclaimer :This post is just for learning few methods of price-patterns. Views are personal. No buy/sell recommendations. These are probability study methods and chances of success/failure depend upon various factors.
If you seriously follow us and understand simple concepts , you can check these things in a minute just by opening the charts and no need to wait for our reply
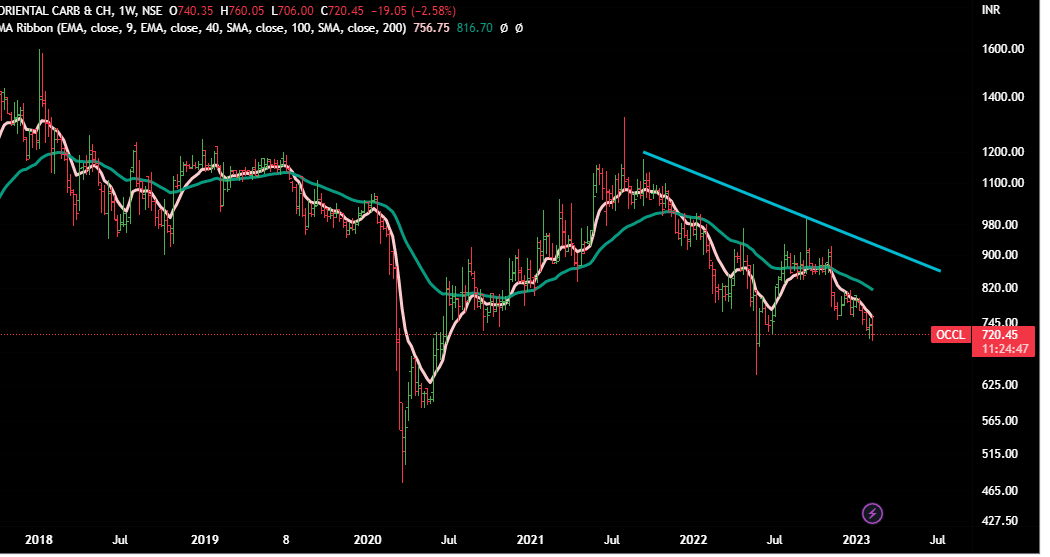
OCCL
CMP 720
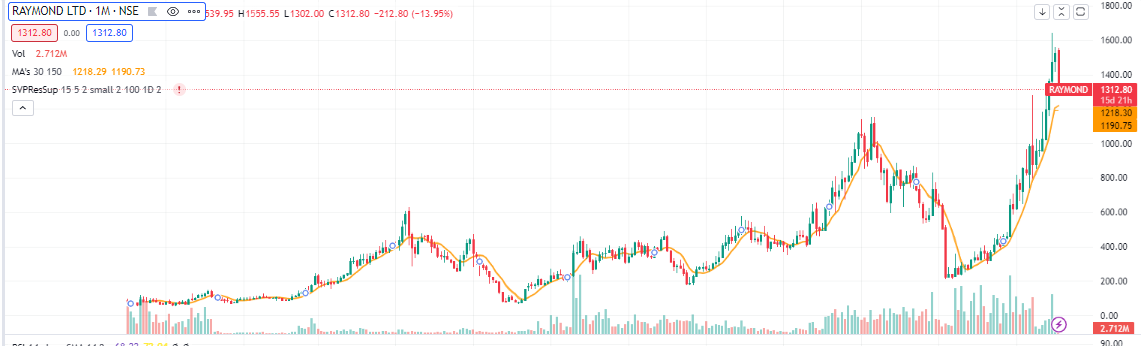
It is clearly a Stage 4 stock …nearby support is 645.
On monthly charts, it is well below 40 months moving average for last few months…it will need strong tailwinds and huge buying by big hands.
MACD on all time-frames is in sell mode…but it is moving in a range - we call it time correction.
It is not falling much -that tells that few big hands have belief in this compnay and they are not selling it.
Also it is not going up -seems the company is not showing any cutting -edge advantage that may attract fresh buying.
Overall in a time-correction for last one and half years .
But of the company does not show any significant changes , then old lovers may ditch it out of frustration and it might fall in Stage 4 .If markets get into selling -mood ,it can go to 40 MEMA - ie near 1650.
Disclaimer :This post is just for learning few methods of price-patterns. Views are personal. No buy/sell recommendations. These are probability study methods and chances of success/failure depend upon various factors.
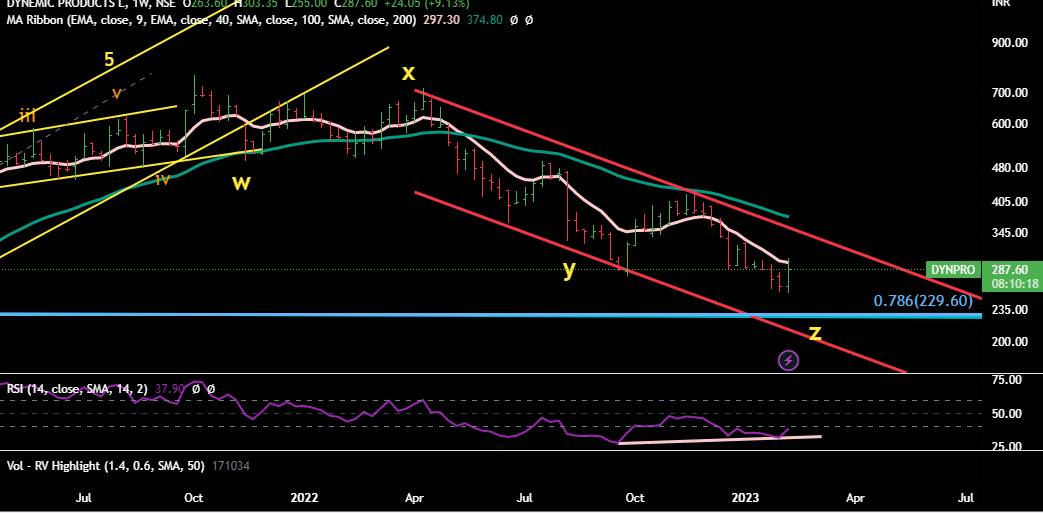
Well it played out yesterday - a good move with volumes.
But are we out of the woods for good -for that we first need a close above 40 DEMA ie 295.
Then we will wait for weekly MACD to turn into buy zone.
If the upmove really starts ( next wave) , then it would go very high - we can buy at a little higher price too ( as upside potential would be huge) but we need few confirmations to take bigger position. Disclaimer :This post is just for learning few methods of price-patterns. Views are personal. No buy/sell recommendations. These are probability study methods and chances of success/failure depend upon various factors.
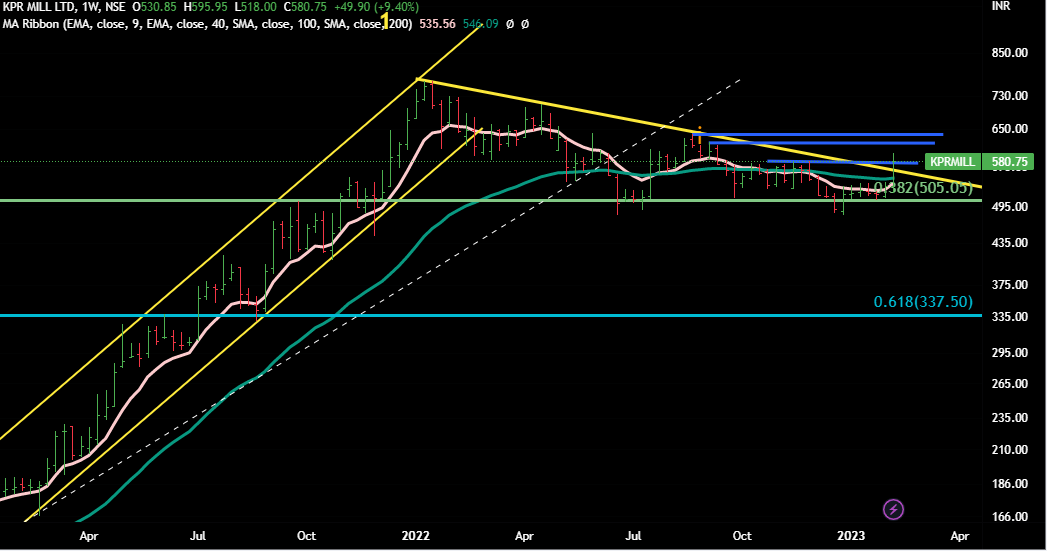
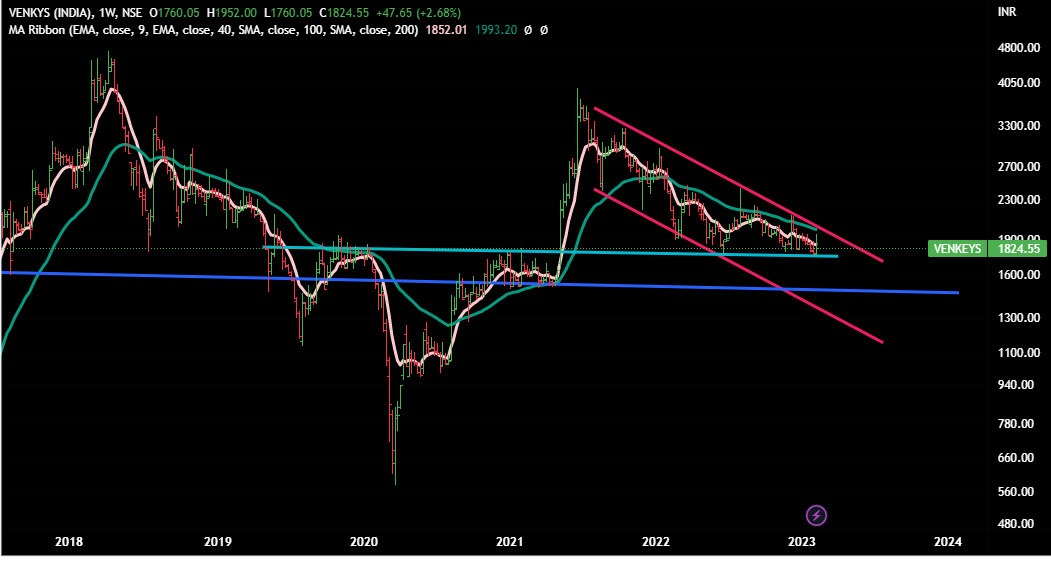
If we were to ride this stock, we would take first entry next week ( may be 10% of our intended investment) and then slowly build up our position after it closes above next resistance levels( immediate resistances show in blue line) . Will keep adding as it keeps moving up .
Would start exitting if it starts breaking below the trading ranges ( resistance levels)
Disclaimer :This post is just for learning few methods of price-patterns. Views are personal. No buy/sell recommendations. These are probability study methods and chances of success/failure depend upon various factors.
Disclaimer :This post is just for learning few methods of price-patterns. Views are personal. No buy/sell recommendations. These are probability study methods and chances of success/failure depend upon various factors.
@StageInvesting you shared some technical indicators for setting up charts to study stage investing. Could you reshare them or direct me to that thread?
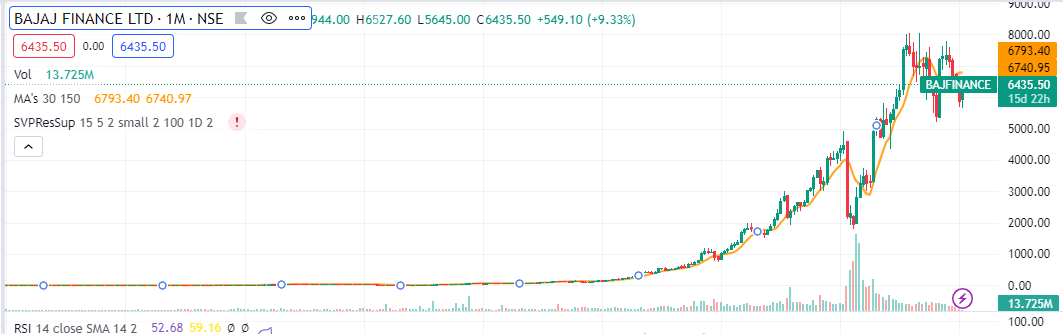
Bajaj Finance is in Stage 3 and it is undergoing a time correction as it is hovering up and down within 30 WMA and the strong hands are still holding the stock. If the story loses steam, it might enter Stage 4.
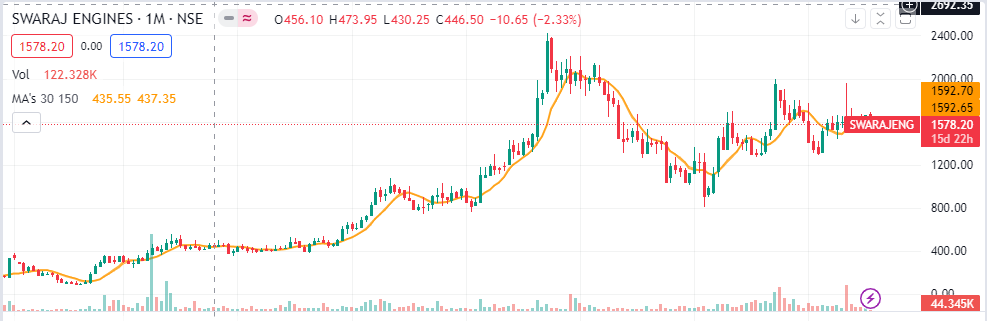
Biggest Mistake - You are using monthly charts - for stage analysis one has to use weekly charts.
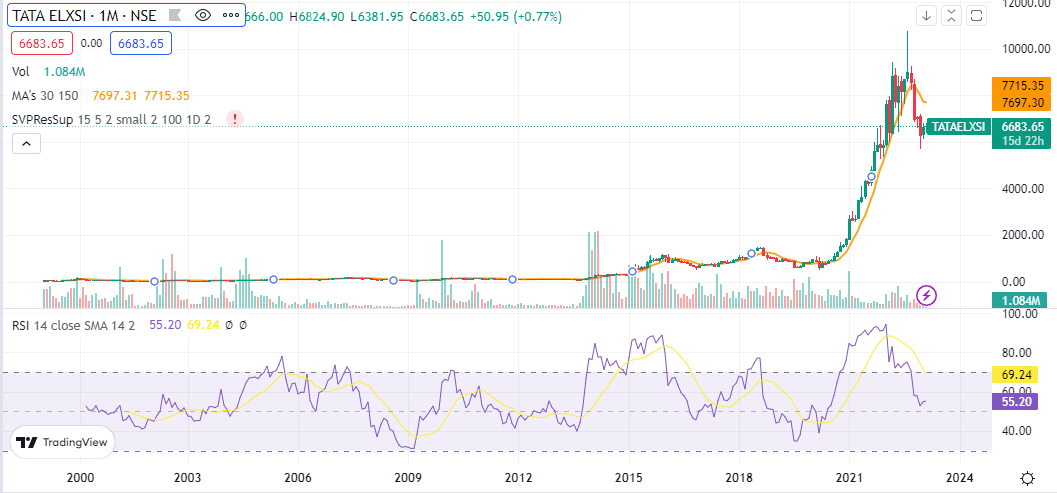
Need to be very clear whether stock has just entered in Stage 4 or it is in Stage 4 for many weeks/months (Tata Elexsi)- that might decide the extent of balance correction.
Here are few suggestions:
a)In place of 30 WEMA , start using 40 WEMA
b) Also add 9 WEMA - as an additional moving average - it gives sense of recent short-term direction
c) Also do see whether these EMAs are flat, upward/downward slanting - that can indicate whether there is some change of direction
d) Also start drawing trading ranges by drawing trend-lines for nearby left-side resistance- that would help you to decide - S-3 and S-1
You had earlier analysed rossell india. Post your analysis, it touched 380 and is on its way down at 220…Please tell your view on which stage is it in and the direction in the medium term.
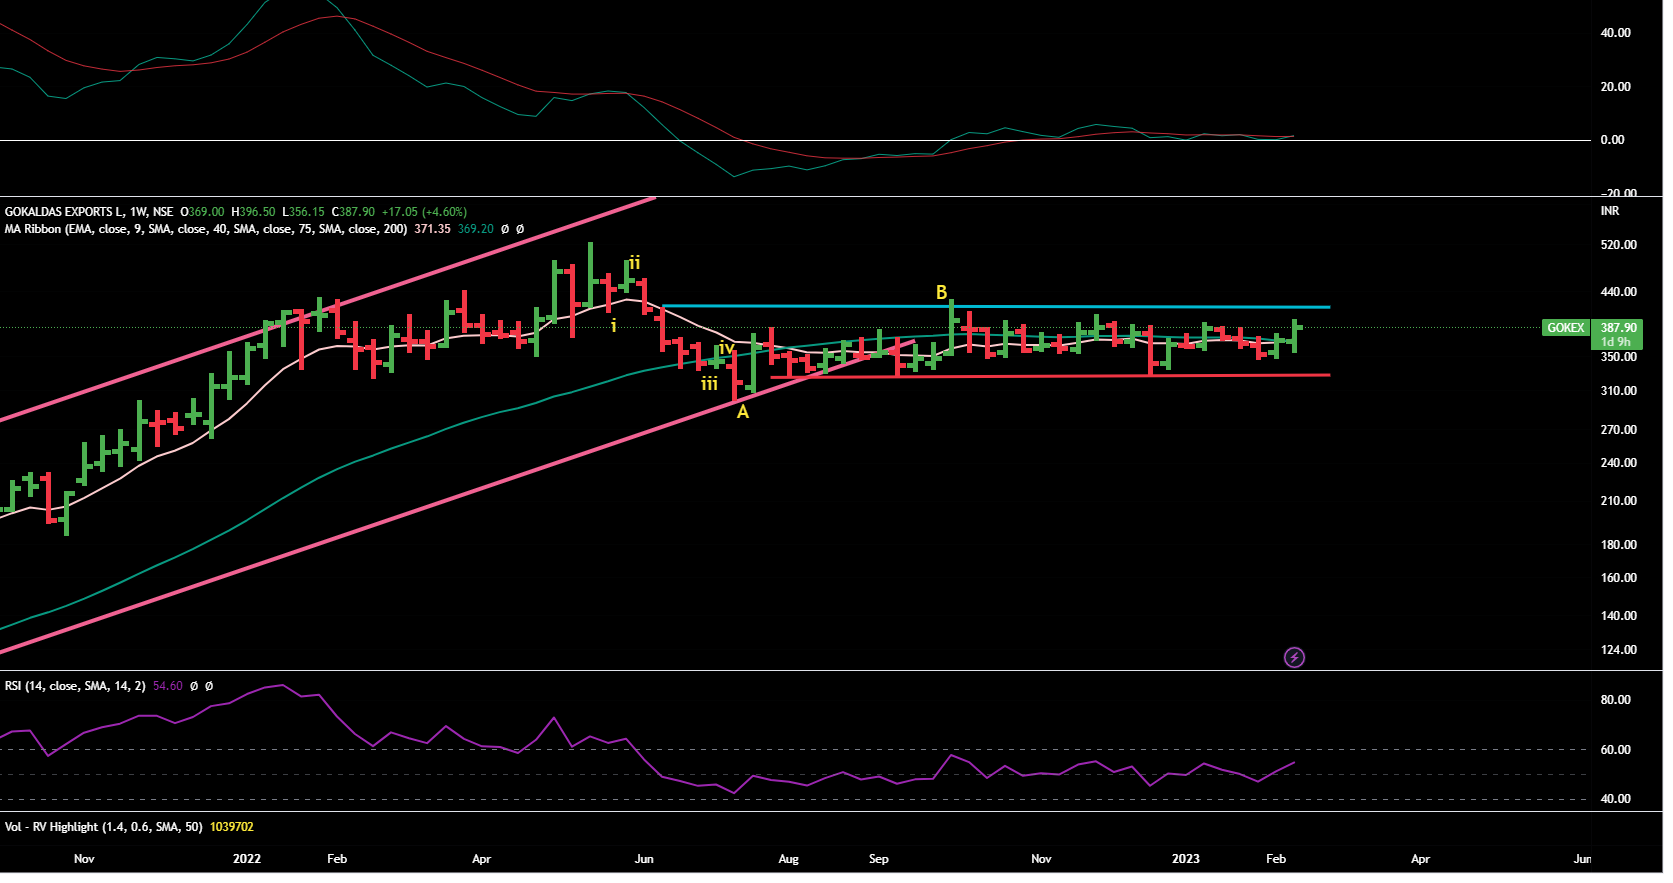
Can you please share your reading on Gokaldas Exports. The company is maintaining its strong performance even with several headwinds and are in consolidation mode between 350-380 for last few months. Do you see Stage 3 coming up for this stock ?
I really enjoy going through this thread and look forward to it as myself started learning technicals and stage analysis 2 years back.
Its an interesting portfolio. What caught my eye was Intellect which was in Stage 4 or transitioning to Stage 1. Is this purely on fundamental strength and confidence that bottom is in place?
As far as Intellect is concerened - we are trying to bottom fish .
Now bottom-fishing goes beyond the scope of Stage Analysis because in stage-alaysis one should pick those stocks only where they’re traing above 40 WMA and are closing above trading-ranges. Sometimes that becomes too late.
In those cases, where we’re fundamentally convinced , we try addtional indicators and studies ;
a) EW - here one can calcualte the extent of correction ( again it is a bout probability )
b) RSI divergences
c) MACD cycles
If you go through the above post, you would realise that we mentioned all of these factors in the same.
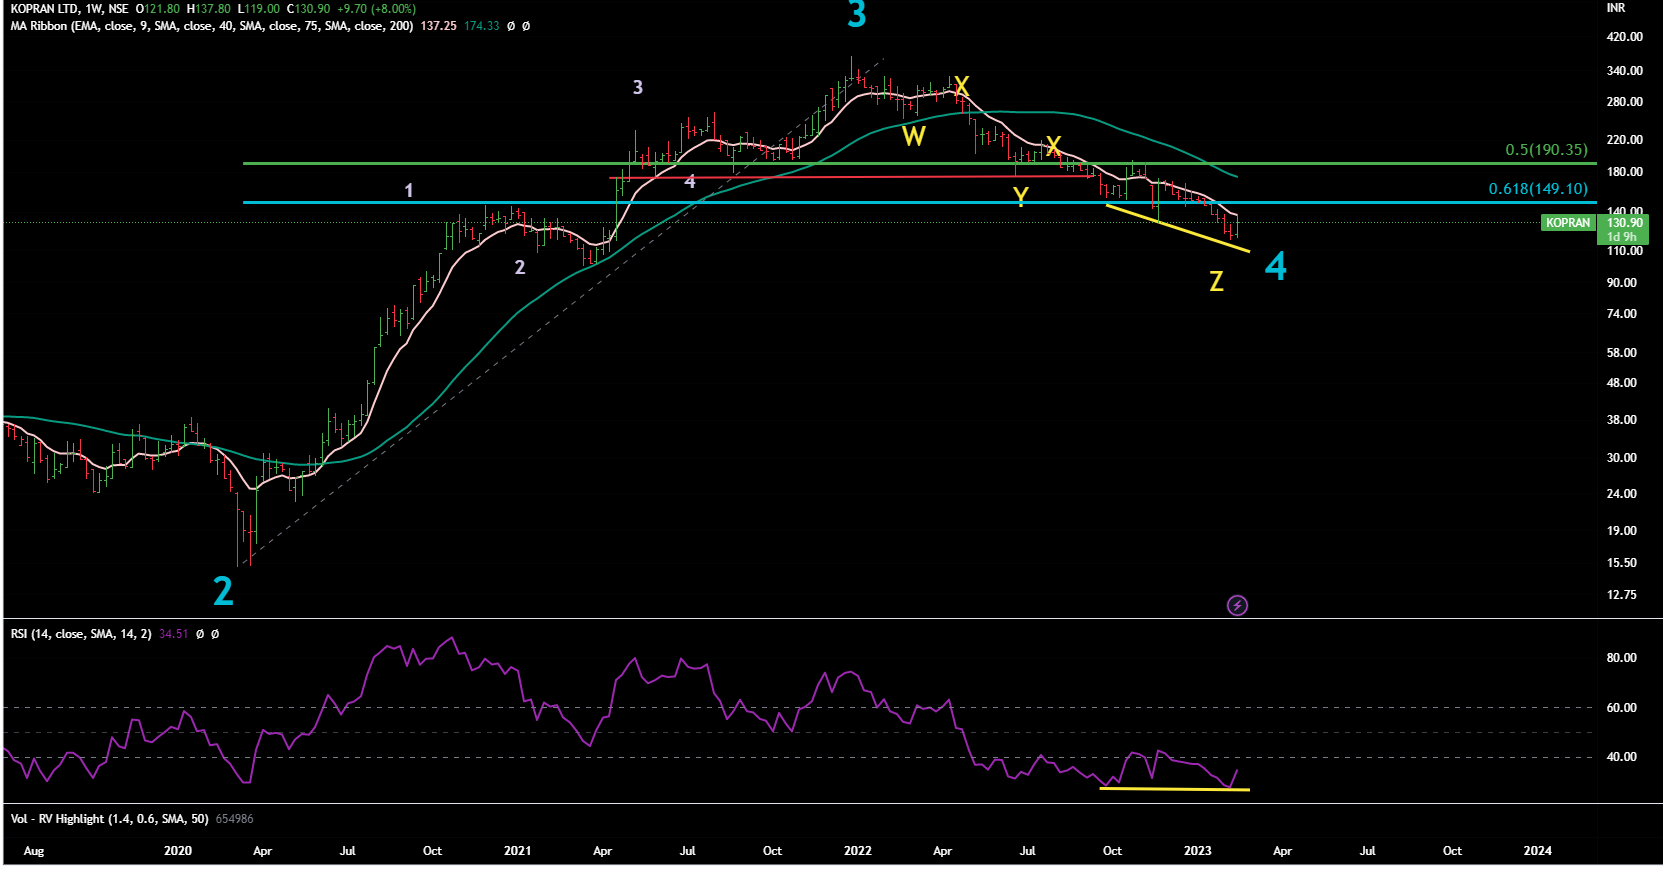
Same thing we’re trying in Kopran- CMP 130 as of now Weekly Chart
Other day we realised that
a) Daily RSI had gone near 20 - an oversold zone.
b) Divergence on weekly RSI
c) A 70.7 % correction done in wave 3
d) Daily MACD turned into buy.
So we took a small postion becuase if 5th wave is really starting , it can become multibagger from here , hence no hurries to buy all at once. We would keep adding as soon as more confirmations come. But at the same time , we would be ready to exit from our small postion if it reverses back and again starts showing the bearish signs.
Well- we’re bit doubtful here - whether it is Stage 1 ( from where Stage 2 can start) or it in Stage 3 ( a breakdown can take it to Stage 4).
We don’t see any clear impulse wave from its recent rally from 328 - that increases the doubt whether the rally has long term legs or it would fizzle out after some more upside. Weekly Side
Hence if we have to enter in it , we will wait for a clear breakout above the range - and more volumes. Disclaimer :This post is just for learning few methods of price-patterns. Views are personal. No buy/sell recommendations. These are probability study methods and chances of success/failure depend upon various factors.