First of all please keep in consideration that we analyse charts from long term investing prespective ie for more than 6 months time horizon . We don’t share any views for short term trading ( i.e for a week or for a month)
Shriram Finance
CMP 1279
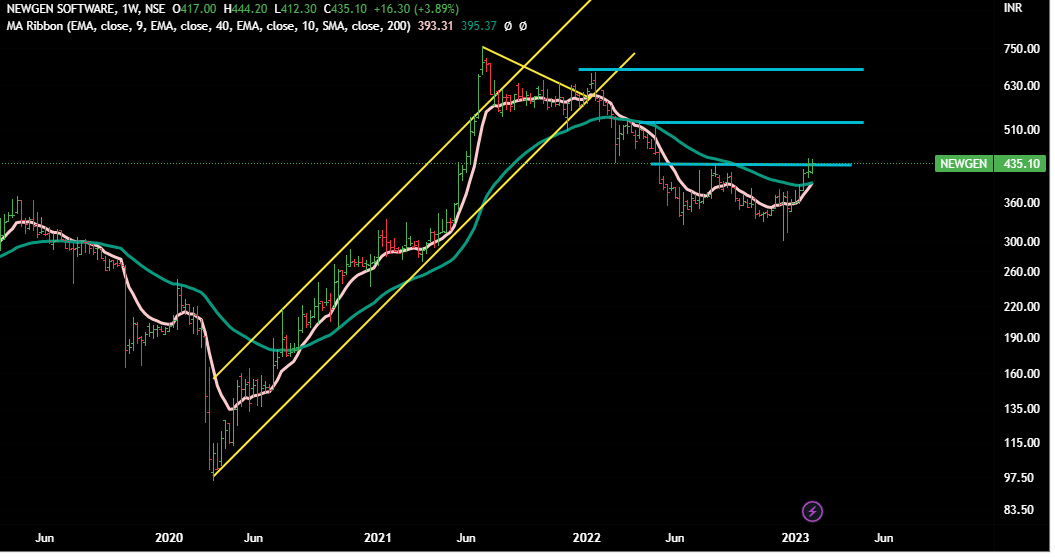
Seems that stock is consolidating in Stage 1 (Wave 2). Need to cross /close above the treading ranges ( as shown by red lines). These read-lines are the resistance levels.
In short, we need lot of big hands to enter to absorb the overhead supplies. Currently the momentum seems to be weak.
Weekly Chart
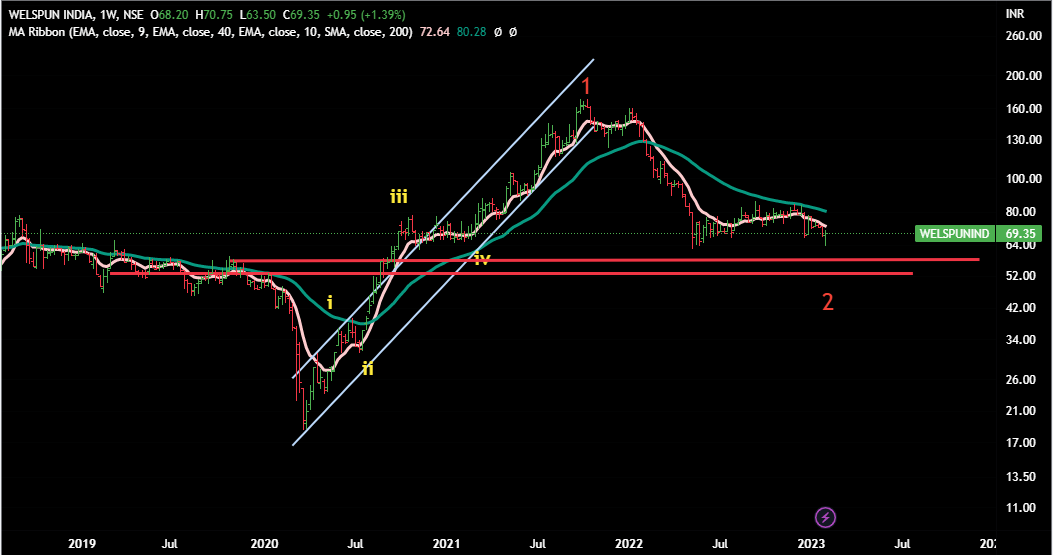
Welspun India
CMP 69
Again a stage 4 stock - trading below 40 WEMA .Weak on RSI as well as in sell zone in almost all time-frames on MACD.
62 is an important support level and if that breaks we can see it going in 50-55 zone.
Low probability : In very short term ,it can go to 72 (76 in best case).
Untill it does not cross 86 , no hopes !
Weekly Chart
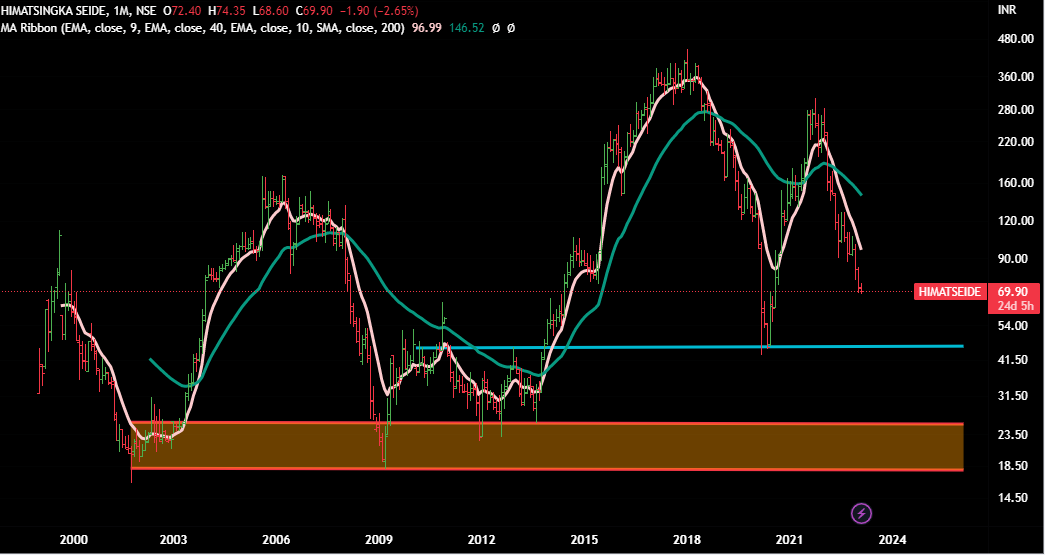
Himatsingka
CMP 70
It seems that promoters themselves have diluted their private holdings.
A beautiful Stage 4 stock. Forget 40 WEMA, it has not been able to cross even 9 WEMA for last 9 months.
Seems something is very wrong in the company - it needs something very rotten for a stock to fall from 400 to 70 - won’t be surprised if it touches or goes much below Covid lows ( 44)
If it does not stop near mid-40s, the worst case scenario is that it might become a penny stock (<25) in case things don’t improve.
On upside - levels near 100 have strong resistance .
Monthly Chart
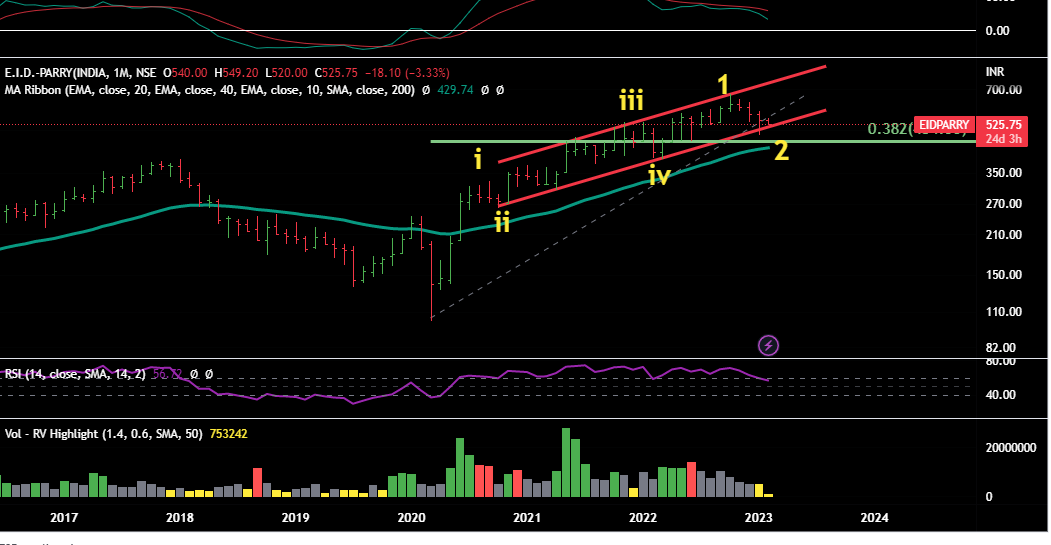
Avanti Feeds
We categories companies in 4 types
a) Good companies ,good investments ( growing companies at reasonable price or avaialble at discount)
b) Good companies ,bad investments ( Overvalued +sector headwinds)
c) Bad comanies, bad investments ( degrwoing, promoters ethics,bad -sector)
d) Bad companies, great trading-opportuities ( trading/story/pumping)
Currently for us , Avanti falls in category (b).
It is a stage 4 stock as per Stage Analysis .
Chances are that it can fall below 300 if it does not stop near 350-360 range.
On upside, there are resistances at every level.
These can only be broken if few big hands jump in and buy huge quantities .
Weekly Chart
Disclaimer :This post is just for learning few methods of price-patterns. Views are personal. No buy/sell recommendations. These are probability study methods and chances of success/failure depend upon various factors.