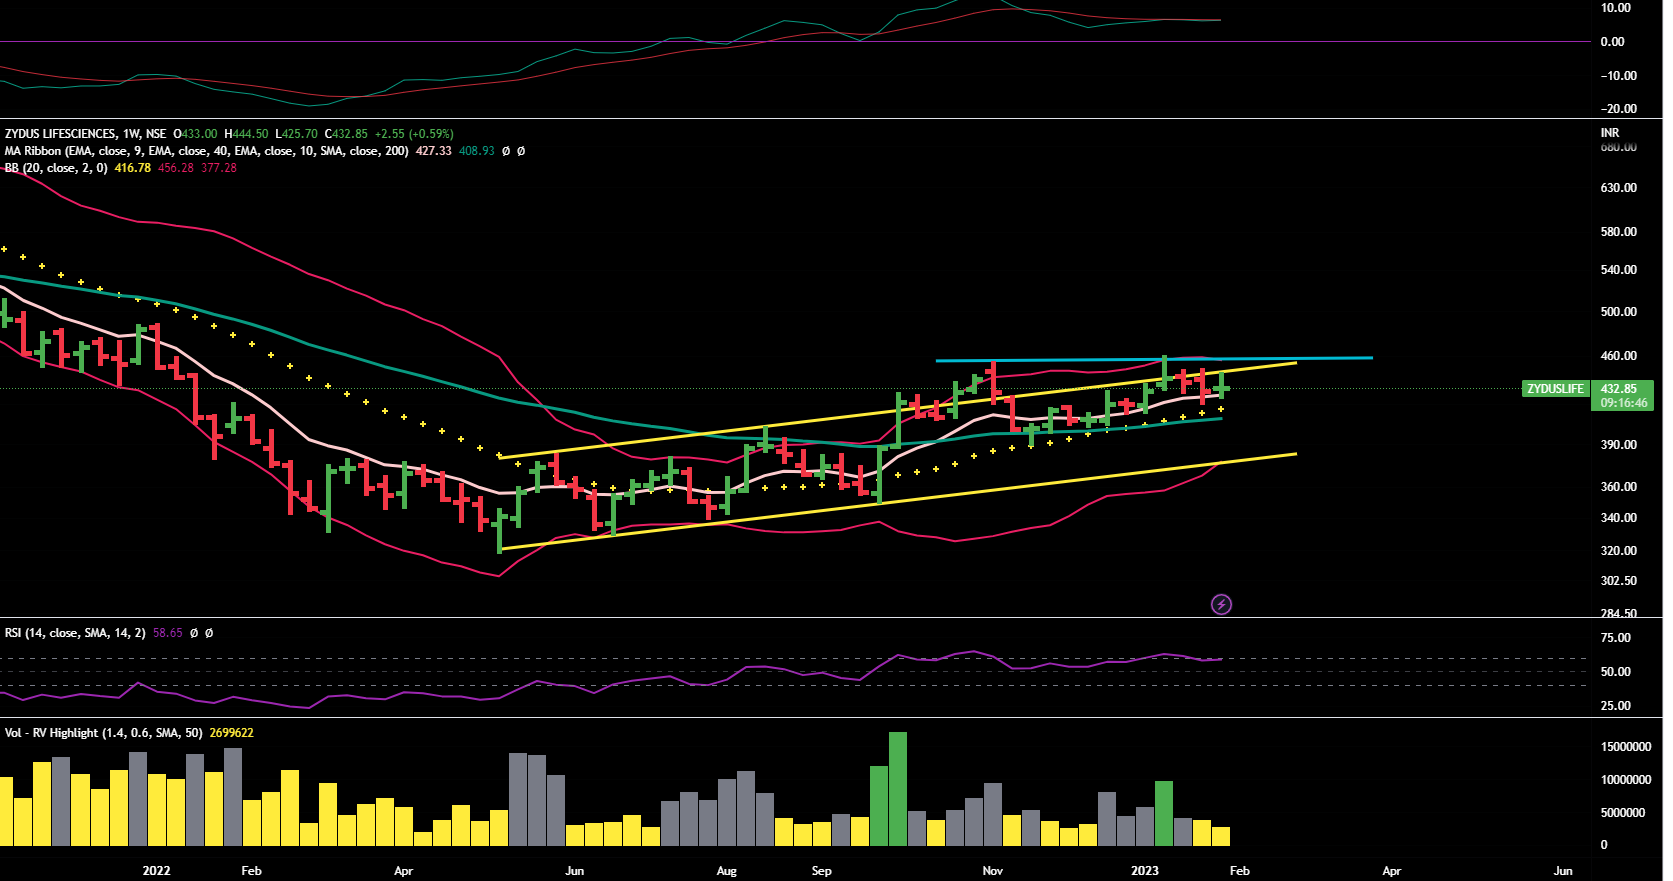
StageInvesting +Elliot Waves

Navkar Corp
CMP 55

Should do well in the long run as the stocks that come and stay above 40 months moving average after gap of many years, they indicate that something has changed structurally in the company (unless they fall back belwo 40 MEMA that meand they were pumped and dumped)

On monthly chart, it is trading above 40 MMA last last 7-8 months .That is a positive sign for lonf term.

In short term, it is showing the signs of making stage 1 base ( trading up-down over 40 WEMA) and as per EW ,it is in wave ii of larger wave 3.

As of now , it seems to be in consilidation zone.

If it has to run, it should first cross 70 and then its recent ATH of 90.Once the wave iii starts, one can expect an intial target of 155 ( iii=i)
Weekly Chart

Disclaimer :This post is just for learning few methods of price-patterns. Views are personal. No buy/sell recommendations. These are probability study methods and chances of success/failure depend upon various factors.

2 Likes

CDSL
CMP -1021

As of now, we can’t say that it has completed its correction. It is still falling.

It is in sell zone on daily/weekly/monthly time-frames.Weekly/daily RSI is below 30 that means it is not showing any strength.

Also we don’t see any significant buying volumes of up-days ( for any stock to move up, we need big hands to enter that counter) .

To move upwards, it should stop making lower-lows, should form a base for few weeks, let the volumes come in. For better undertanding, read about stage analysis . Have shared the write-ups several times in previous posts.

CAMS
CMP -2260
Although its chart is better than CDSL but we are doubtful about whether it would start its long term upward journey in coming monts…

It is better beacuse unlike CDSL, it is forming a Stage -1 base in a range for last 9-10 months.

But it can remain in this range for many more months.

First sign of any long term real upward moentum would be it convicing crosses and close above 2700 for few weeks - above the current trading range as shown by blue line.

Before that one should see it closing above the 40 WEMA for few weeks.That would intial sign.

Would request again to learn stage-investing. It is very simple and easy to master.

Disclaimer :This post is just for learning few methods of price-patterns. Views are personal. No buy/sell recommendations. These are probability study methods and chances of success/failure depend upon various factors.

5 Likes

Shared in July last year… working well.

Many a times charts tell the truth well ahead of time

2 Likes

Surya Roshni
CM 643

It looks good . It can consolidate (rest ) a bit before re-starting its upwards journey.It also depends upon overall market conditions.

Once it crosess and closes above 670 - then it can go near or beyound its ATH of 883.

Apar Industry
One can keep riding till it does not break 40 WEMA.
Disclaimer :This post is just for learning few methods of price-patterns. Views are personal. No buy/sell recommendations. These are probability study methods and chances of success/failure depend upon various factors.

Genrally the market recovers from this zone !

Or this time it is different ? :grinning:

3 Likes

What’s your view on Kovai Medical Center Hospital and Ambika Cotton Mills? @StageInvesting

We shared our thoughts in June - it moved in a narrow-range and now it is back to same level.

Kovai
Seems to be a dead stock-not going anywhere for last one and half years.

Very low volumes - seems to be in limited hands. Hence mass psychology does not apply here.
Also as per our view, single hospital stocks have inherent risk .
Disclaimer :This post is just for learning few methods of price-patterns. Views are personal. No buy/sell recommendations. These are probability study methods and chances of success/failure depend upon various factors.

Don’t mess with head and shoulders. A support at 1550. Might see some pullback now. Stocks don’t go up and down in straight lines.

Hi please can u check chart of Zydus life and Aarti drugs

Hi Sir

Thanks for such a detailed analysis …Request if you can once check IDFC & Oriental Aromatics Ltd ( OAL ).

ZYDUS Life
CMP -432

Stock is making higher -highs and higher -lows - as per Dow theory it is in uptrend.
Also on weekly charts, it is taking support at 20 WEMA (yellow dotted line)

There’re few worries though :grinning:

a) It is not showing much strength (RSI is <60 on all time frames)
b) It is currently in sell mode on daily /weekly MACD but in buy -zone on monthly.Inference is that though it is in uptrend in long run but in short-term it needs to show more momentum .
Weekly Chart

What we will do ?
Scenario 1 -If are already in from much lower level-
We will keep a close watch that it does not break 410 (it has storong support there and in worst case scenario 390 is final support level.

Scenario 2- If we want to take fresh entry :
We will wait that it crosses and closes above 455 (blue line- trading zone) ,at least for a week.

At the same time, we will keep a watch on sector (pharma) . If sector also starts performing then it would also gather some momentum.
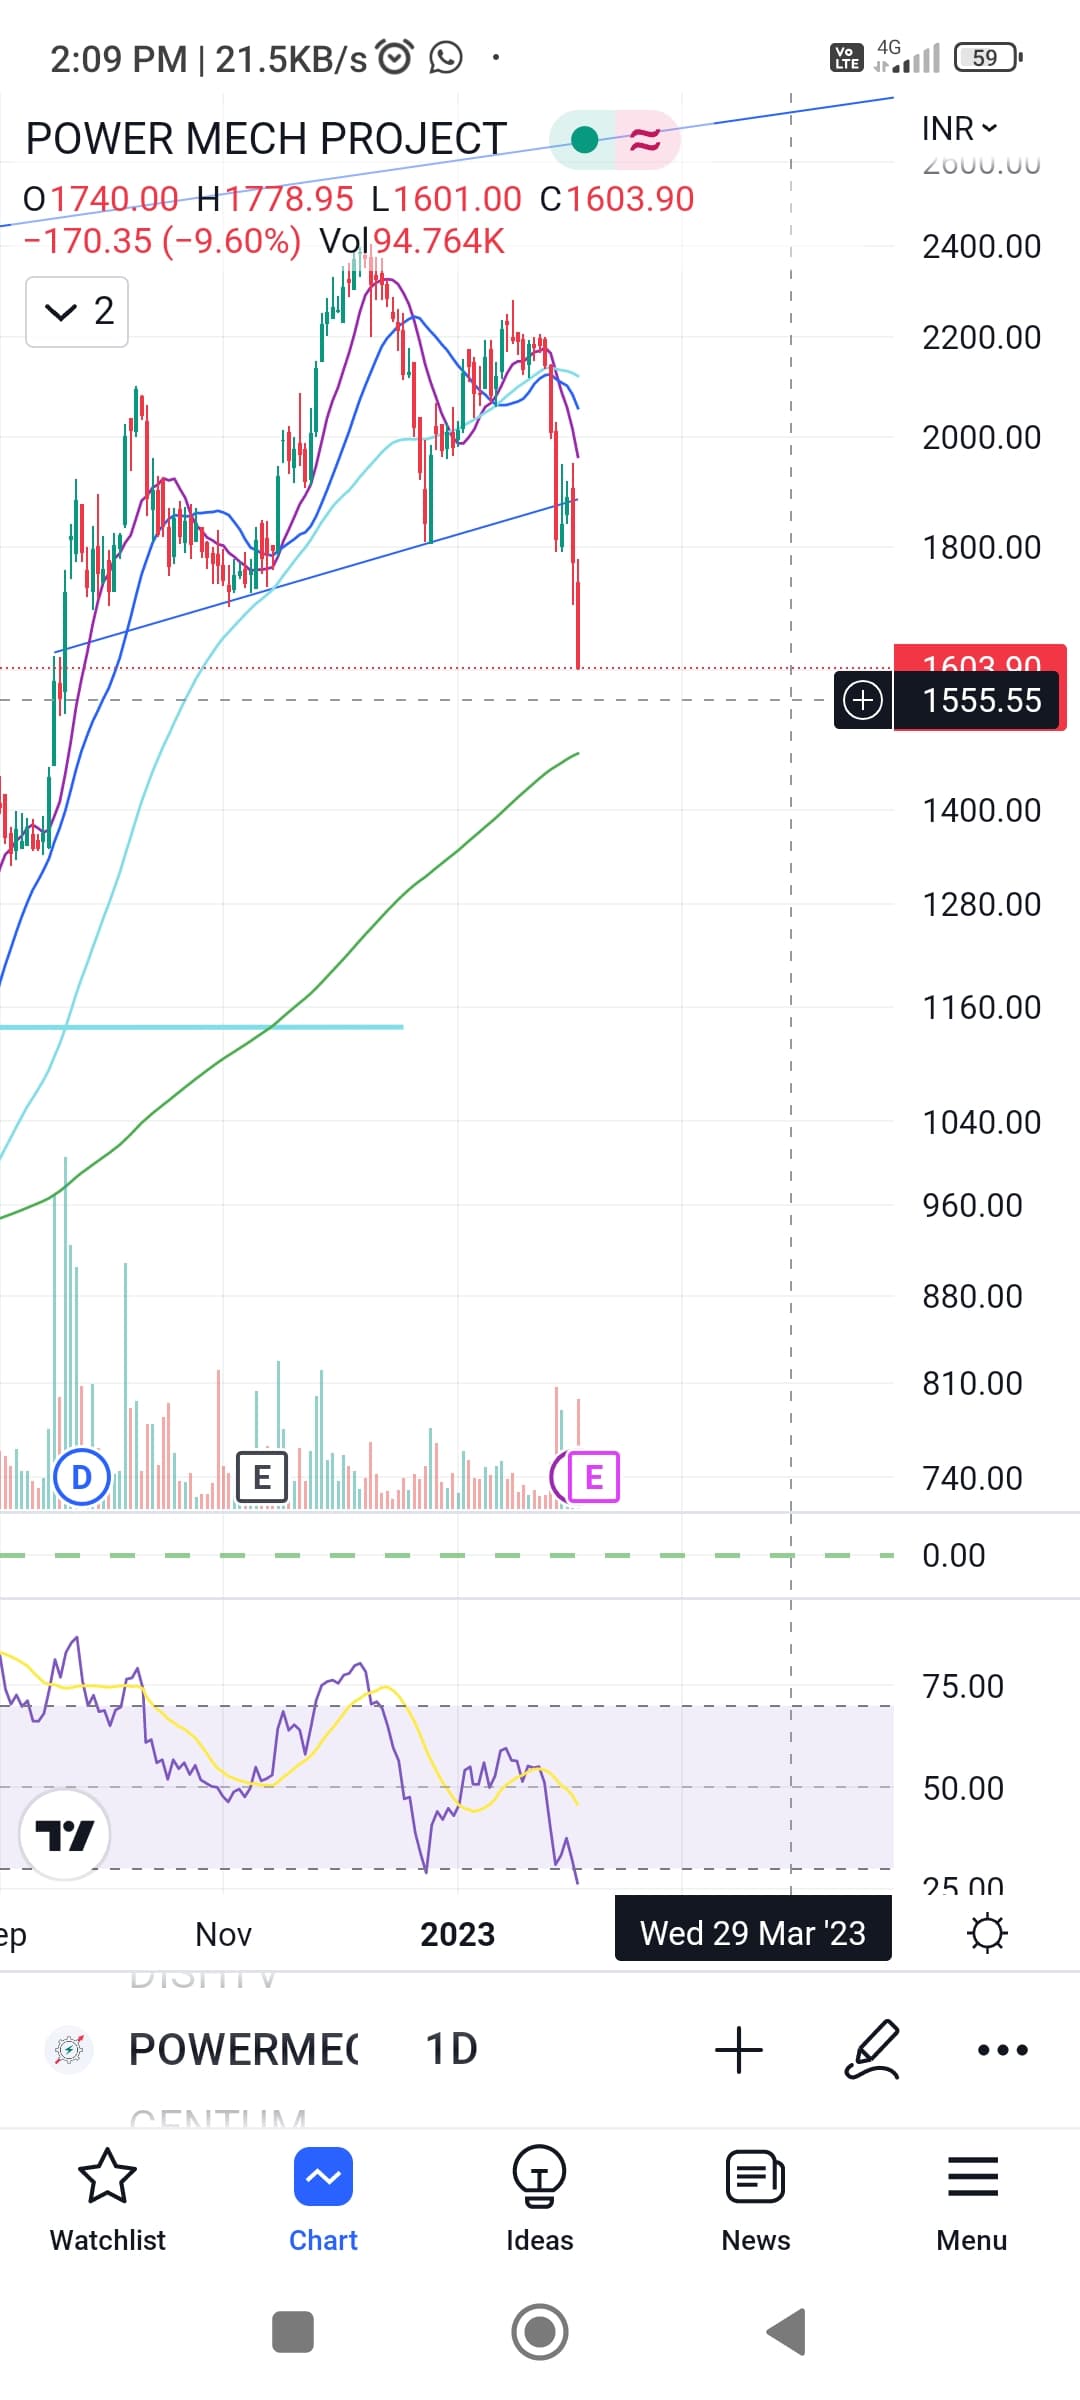
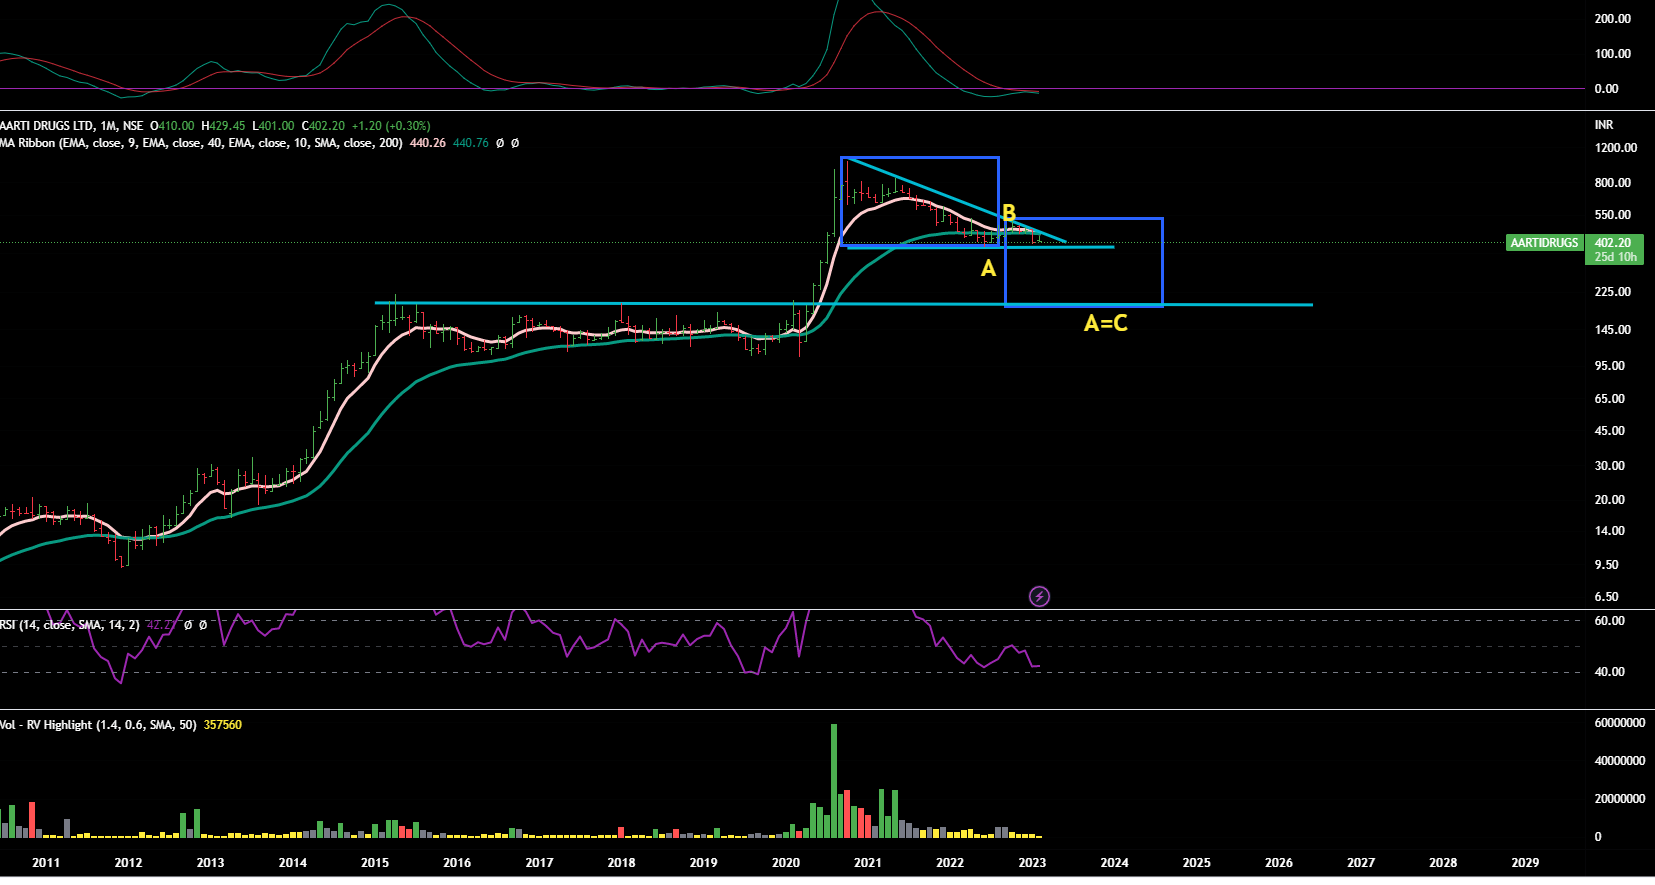
Aarti Drugs
CMP 402

It is in Stage 4 . On weekly chart , it is trading below 40 WEMA as well as 9WEMA .
It is in sell mode on all time -frames on MACD and RSI is also very weak.

And it is on verge of breaking its June 22 low of 378. If that happens then it can plunge more deeper.

On monthly chart , it is trading trading below 40 MMA . Any stock trading below 40 MMA for few months , requires lot of buying by big hands to start its upward journey.

Monthly Chart

In worst case scenario, Aarti Drugs can go down to pre-covid levels i.e. near 200. We can see a string support near that level and also at that point A=C.

In short, If we were looking at this stock for long term, we will stay away from it till we see it trading above 540 .

Also keep in consideration that weekly/monthly charts projections take few months to play out fully.

Disclaimer :This post is just for learning few methods of price-patterns. Views are personal. No buy/sell recommendations. These are probability study methods and chances of success/failure depend upon various factors.

3 Likes

Hi - please keep the following points in consideration

a) We analyse charts from long term investing prespective ie for more than 6 months time horizon . We don’t share any views for short term trading ( i.e for a week or for a month)
b) We always encourage our readers to learn Stage -Analysis method . It is very easy to learn and can help a lot if someone is a long term investor. We already shared links to the article in several of our previous posts.

Oriental Aromatics
CMP -391

We don’t see any strength here. It is in Stage 4 . It is difficult to say whether it will stabilise here (best case scenario) or will plunge further.

We won’t touch this stock till it crosses the falling trendline (blue line ). And then we would need more conformations as per stage analysis.
Weekly Chart

IDFC Ltd
CMP 88
Well the stock is on uptrend .
But it has strong resistances nearby - near 90 and then near 110.

For long term prespective and for bigger gains , it should cross and close above 110-115 range for few weeks.
Monthly Chart

Keep in consideration that weekly/monthly charts projections take few months to play out fully.

Disclaimer :This post is just for learning few methods of price-patterns. Views are personal. No buy/sell recommendations. These are probability study methods and chances of success/failure depend upon various factors.

4 Likes

Hello @StageInvesting

Really grateful for the work you are putting into the thread.
Wanted to know how do you see ITC on the charts. Whatever little technical analysis I know, according to that it seems to be in an uptrend, but don’t know how long it might last.
Would love to know your thoughts.

Thanks :slight_smile:

1 Like

Hello @StageInvesting , I’ve been following your thread for quite a while now. I really like your insights. Would you mind sharing your chart view on shriram finance, welspun India, himatsingka and avanti feeds? I believe shriram finance still has supply overhang, while other three are going temporary headwinds. I have been following the textile sector for a couple of quarters now, all the negatives seemed to have been priced in and I have been accumulating them for the past few months. Would love to hear your take on the same. Thanks!

ITC

CMP -378

Well this one we can reply very quickly as it is part of our long term portfolio.

As per EW , we feel that it is in 5th wave and can go beyond 500.

5th waves happen to be tricky , many a times they get turncated ie they don’t achive the targets or sometime they go beyond the targets.

In very short term, it seems bit extended -can cool off a bit as short t-erm investors/traders can go for profit-booking.
Monthly Chart


Disclaimer :This post is just for learning few methods of price-patterns. Views are personal. No buy/sell recommendations. These are probability study methods and chances of success/failure depend upon various factors

3 Likes

BTW , IDFC Ltd uptick is on the RS. 11 dividend :slight_smile:

1 Like

Hey @StageInvesting, very good insights by following your stage based analysis. Could you please share your views on Indian hotels.

Aurobindo
CMP 399

First posted in October.

A=C target achieved but it seems to be extending.

1 Like

What is your view on ttk prestige?

TTK Prestige
CMP -750

First of all would request you and every reader here to spend some time in learning stage-analysis.

Just in one hour , one can master the same.If you learn this method then you don’t need to be dependent upon us and can decide at your end in less than a minute. Please.

We would love to answer all the queries if one feels stuck even after learning or there is some complex chart.

So as per stage -analysis,thiis stock is in Stage 4 - a declining stage.
It is below 40 WEMA as well as 9WEMA .

It tried to come over but failed at trading -range resistance (sky-blue line) .

For future , on upside -let it cross falling trend line and then check different parameters of Satge Analysis to get in.

On downside -Although it has retraced 61.8% of whole rise and may start forming a base here but there are also chances that it can plunge further to meet the target of C or little above that near red-line that is a strong support of the past.

Weekly Chart

Disclaimer :This post is just for learning few methods of price-patterns. Views are personal. No buy/sell recommendations. These are probability study methods and chances of success/failure depend upon various factors

1 Like